Journal of Water Resource and Protection
Vol.6 No.6(2014), Article ID:45422,10 pages DOI:10.4236/jwarp.2014.66052
Water Quality Index Assessment under Climate Change
Nassir El-Jabi1, Daniel Caissie2, Noyan Turkkan1
1Department of Civil Engineering, Université de Moncton, Moncton, Canada
2Department of Fisheries and Oceans Canada, Moncton, Canada
Email: nassir.el-jabi@umoncton.ca
Copyright © 2014 by authors and Scientific Research Publishing Inc.
This work is licensed under the Creative Commons Attribution International License (CC BY).
http://creativecommons.org/licenses/by/4.0/


Received 3 March 2014; revised 1 April 2014; accepted 19 April 2014
ABSTRACT
Surface water quality may change in the future due to climatic variability as natural processes will most likely be modified by anthropogenic activities. As such, stream temperature is very likely to change as well which will impact on surface water quality and aquatic ecosystem dynamics. The present study focused on improving modelling of surface water quality indices and water quality parameters under various climate change scenarios in relationship with stream temperature. Future climate data were extracted from the Canadian Coupled General Climate Model (CGCM 3.1/ T63) under the greenhouse emission scenarios B1 and A2, as defined by the Intergovernmental Panel on Climate Change (IPCC). This study illustrates the usefulness of the stream temperature models, coupled with Climate Change Scenarios to predict the evolution of future stream water temperature regimes and associated biogeochemical water quality parameters pertaining to drinking water quality. The specific objectives of the present study were to analyze the surface water quality of 15 rivers in New Brunswick (Canada) on the basis of 9 parameters under climate change. A Weighed Method and the Canadian Council of Ministers of the Environment (CCME) Method were used to assess the water quality for each river under present and future climate. The knowledge gained from this study will enable engineers and water resources managers to better understand river thermal regimes and climate change impact on water quality related to Drinking Surface Water.
Keywords:Water Quality Index, CCME Method, Weighted Method, Climate Change Scenarios

1. Introduction
Climate Change impacts on river systems include changes in runoff, groundwater flow as well as the timing of streamflow (e.g. high and low flows). To these quantitative aspects, water quality also needs to be assessed for effective water resources management. With respect to the biogeochemical water quality, most climate change impacts can be attributed to changes in stream temperature. With increases in stream temperature, dissolved oxygen will decrease and biological activities will increase. Such changes in stream temperature will also have consequences on nutrients, organic matter as well as biomass within the river environment. The impact of climate change on stream temperature is highly dependent on the future evolution of air temperature and other meteorological and physical parameters [1] . As air temperature is the parameter that is expected to change most significantly under climate change; therefore, stream temperature is also expected to be an extremely important parameter.
The thermal regime of rivers represents the natural variation in water temperatures for a selected period (seasonal, daily or diel) and watercourses. Many factors can influence the thermal regime and they can be classified using different methods. Poole and Berman [2] classified the factors influencing thermal regime in two categories: internal and external factors. The external factors consider the net energy and water inputs whereas internal factors are related to the fluvial processes and river characteristics (riparian zone, surface/subsurface water interaction, etc.). Changes in these factors will ultimately modify water temperature variability along river reaches.
According to Caissie [3] the main drivers or factors influencing stream temperatures can be classified into: atmospheric conditions, topography, stream discharge, and riverbed thermal fluxes. This study showed that the atmospheric conditions are considered the most influential group. Atmospheric conditions are principally responsible for the heat exchange process at the water surface. It includes the solar radiation, air temperature, humidity, wind speed as well as the type and quantity of precipitation. Topography can also influence the thermal regime of rivers and it includes factors such as latitude/longitude, riparian vegetation, geology, river aspect (orientation) and upland shading (e.g., prairie vs. mountain). Some topography factors can be influenced by human activities like timber harvesting, resulting in an increase in river water temperatures, especially for small streams. Stream discharge factors are mostly related to river hydraulic conditions (e.g. surface area, water volume, etc.). Some stream discharge factors are extremely important like the volume of water whereas other can be neglected like the slope or waterfalls. Streambed conditions can also influence the thermal regime depending on the size of the river and these mainly include the heat conduction at riverbed and the contribution of groundwater flow.
In eastern Canada, the air temperature is expected to increase by 2˚C to 6˚C in the next 100 years [4] . Such an increase will greatly affect stream water temperatures. Higher water temperatures and changes in extreme precipitation events are projected to affect water quality from sediments, nutrients, dissolved organic carbon, pathogens, pesticides and salt, with possible negative impacts on ecosystems, human health, and water system reliability and operating costs [5] . Many studies have looked at the impact of climate change on river water temperatures [6] . However, the impact of climate change is difficult to predict due to a lack of long-term water temperature data [7] . Climate change was shown to affect water quality, potentially violating the Safe Drinking Water Act regulations [8] . Many studies have shown a decline in stream water quality under a climate change scenario [9] -[12] , but very few have focused on the impact of drinking water quality. Expected impacts of climate change are flow reduction that will lower water levels in rivers and lakes, as well as an increase in water demand and higher temperatures [13] . The main impacts of the consequence of rising temperatures and heavy rainfalls would be the rise in concentration of dissolved organic matter, pollutants and pathogens [14] . Water quantity changes due to climate change have been identified as a water quality related threat to sources of drinking water [15] . In Canada, 288 outbreaks of infectious disease were linked to a drinking water source between 1974 and 2001 [16] .
Flow variability was found to deteriorate water quality in general [17] -[20] . A reduction in water flow is expected to increase water pollutant concentration, resulting from a lower dilution capacity, whereas an increase in water flow will increase the transport of diverse compounds from soil to water resources trough fluvial erosion [5] . Kundzewick and Krysanova [21] have presented some key consequences of declining water quality due to climate change. They cited the increase of water withdrawals from low-quantity sources. They also noted the risk of occurrence of water infrastructure malfunction, overloading the capacity of water and wastewater treatment plants, and greater pollutant loads from diffuse sources during extreme rainfall. An increase in waterborne disease is also expected due to insufficient supply of potable water and higher turbidity, nutrients loads, and pathogens transport into water supply [22] [23] . In regions where water availability is likely to decrease, water managers will need to ensure adequate water supplies, such as building new storage reservoirs or using alternative water sources [24] . Low water availability could lead to groundwater over-exploitation, creating the need to pump water from deeper sources at higher costs [5] .
As river temperature will increase in the future, water quality index is also expected to change under climate Change and these changes need to be quantified. The Canadian Council of Ministers of the Environment Water Quality Index (CCME-WQI) as well as the Weighted Water Quality Index could be used in Canada. As such, the present paper will focus on water quality indices in New Brunswick (Canada) applied to drinking water quality and how such indices many be affected by climate change.
2. Methods
2.1. Water Quality Index
A Water Quality Index (WQI) is a simple number that expresses overall water quality for a water sample based on several water quality parameters. A water quality index is a convenient method to summarized complex water quality data and facilitates its communication to managers and a general audience. To calculate a WQI, the body of water, time period, variables and the objectives need to be identified. The water quality index can be applied to one station, to monitor a particular river, only if there are enough data available for the analysis. It can also be applied to a number of different stations, e.g., sites throughout a lake. Data are usually collected over a time period of a minimum one year [25] . Data from different years may be combined, but a degree of variability could be lost. Variables are water quality parameters measured to calculate the WQI. The water quality objectives are numerical concentrations or narrative statements establishing necessary conditions to support and protect the most sensitive designated used of water (e.g., drinking water, aquatic life) at the study site [26] . There is no “rule of thumb” on the selection of input or important variables; however, parameter selection should be based on measurements of water quality relevant to the study site [27] . CCME [25] recommends that CCME WQI should not be run with less than four parameters and four sampling visits per year, but they do not set a maximum number of variables. CCME [27] have conducted a sensitivity analysis of the Canadian Council of Ministers of the Environment (CCME) Water Quality Index (WQI), based on random parameter removal trials on a water quality data set involving 11 parameters. It suggested the CCME WQI should be calculated with a minimum of 7 parameters with a minimum of six samples. The choice of parameters should be based on the significance of the relationship with the goal of the WQI and the availability of monitoring data for the parameter [28] [29] . In this study the CCME WQI Method and the WQI Weighted Method were considered for the calculation of the WQI. These two WQI will then be applied on 15 stations across the province of New Brunswick. The monthly values for 9 water quality-related parameters for the period 2003-2011 were obtained from New Brunswick Department of the Environment. These parameters included: dissolved oxygen (DO), conductivity (Cond), pH, total phosphorus (TP), water temperature (Tw), ammonia (NH3), nitrite (NO2), nitrate (NO3) and suspended solids (SS).
2.2. CCME-WQI Method
The Canadian Council of Ministers of the Environment (CCME) Water Quality Index (CCME WQI) is useful for many different purposes including drinking water quality data communications, ambient water quality data analysis, integrated watershed planning and management in the forestry sector, and assess the effectiveness of best management practices [30] . The CCME WQI relies on measures of three factors [25] :
1) The number of variables whose objectives are not met (scope);
2) The frequency with which the objectives are not met (frequency);
3) The amount by which the objectives are note met (amplitude).
These values are combined to produce a single value (between 0 and 100) describing the water quality. A value of 100 is the best possible index score and a value of 0 is the worst possible (Table 1).
Table 2 shows the objectives or thresholds required for a good water quality index used the by CCME WQI.
The Canadian Council of Ministers of the Environment Water Quality Index (CCME WQI) is calculated as follows:
 (1)
(1)
where

Table 1. Categorization of the WQI CCME and WQI Weighted Methods.
Table 2. Variables and objectives used with CCME method.


2.3. WQI Weighted Method
In this widely used method, the WQI is calculated as the weighted sum of the different sub index scores [31] [32] . The individual parameter scores are aggregated into a final index value (between 0 and 100).
The following empirical equation was used for the determination of the WQI [31] -[33] :
 (2)
(2)
where  is the normalized value of the parameters and
  is the relative weight of each parameter in term of its importance for aquatic life and drinking water. The parameter Pi has a maximum value of 4, assigned to parameters of relevant importance for drinking water, such as Dissolved Oxygen (DO), Suspended Sediments (SS) and Water Temperature (Tw). Also, the minimum value assigned to parameters with minor relevance is the value of 1. Table 3 shows the weights and the normalization factors of the parameters used in this study. WQI Weighted Method is also an objective based index similar to the CCME WQI (Table 1). As such, the index will provide an indication if the water quality is fair, good, etc.
2.4. Study Area
The study area consists of 15 rivers in New Brunswick as shown in Figure 1. New Brunswick lies on Canada’s Atlantic coast, and is bordered by the ocean on its southern (Bay of Fundy), northern and eastern (Gulf of St. Lawrence) shores. Generally, average air temperatures in New Brunswick range from −10˚C in January to 19˚C in July. New Brunswick receives approximately 1100 mm of precipitation annually, with 20% to 33% falling in the form of snow. Precipitation tends to be highest in southern parts of the province and the northern part of New Brunswick receives correspondingly higher amounts of precipitation in the form of snow due to colder winters. Major rivers and many smaller streams flow from the interior highlands of New Brunswick. Rainfall, snowmelt, and groundwater all contribute to the volume of flow, producing variations from season to season and year to year. Most high flows are caused by the spring snowmelt with at times a combination of snowmelt and rainfall. Heavy rainfall can also cause high flows, especially in small streams during the summer and autumn periods. Low flows generally occur in late summer, when precipitation is low and evaporation is high, and in late winter, when precipitation is stored until spring in the form of ice and snow. Winter low flows are more dominant in the northern part of the province.
2.5. WQI Modeling under Climate Change
The climate model used in the study was the third generation coupled global climate model (CGCM3.1). The time-slice simulations followed the Intergovernmental Panel on Climate Change [5] [34] “observed 20th century” 20C3M scenario for years 1970-2000 and the Special Report on Emissions Scenarios (SRES) B1 and A2 for years 2010-2100. Simulated daily minimum, mean and maximum air temperatures for the period 1970-2100 were obtained from Canadian Centre for Climate Modelling and Analysis and downscaled using delta change approach. Water temperatures were then obtained through modeling using these air temperature data [1] .
Table 3. Relative weights (Pi) and normalized values (Ci) of the water quality variables.
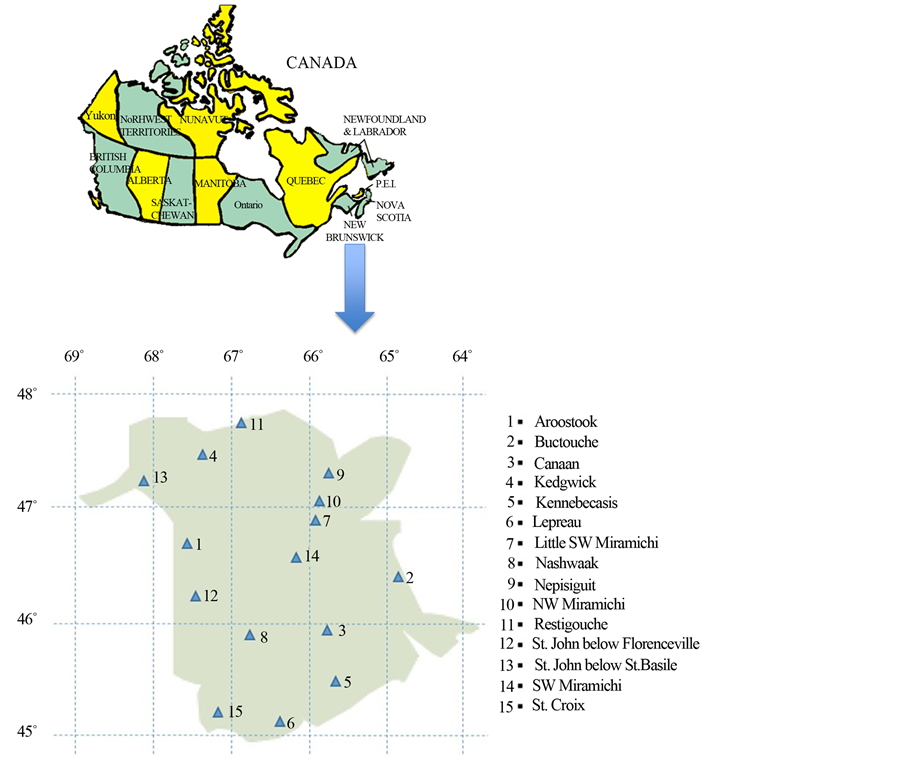
Figure 1. Locations of studied stations in New Brunswick (Canada).
3. Results and Discussion
Table 4 shows results of the averaged water and air temperature increases using emission scenarios B1 and A2 at Doaktown (air) and for the Little Southwest Miramichi River (LSWM River). Over the next 30 years (2010-2039), water temperatures are expected to increase by between 0.7˚C (B1) to 1.2˚C (A2). The stream water temperatures show a more significant increase for the period 2070-2099 compared to current climate conditions (1970-1999), with an increase of 2.1˚C (B1) and 3.7˚C (A2) [1] . Results from Little Southwest Miramichi River (Table 4) indicate that, during all future periods, the water temperature increases will be in the range of 60% - 75% of the increases projected for air temperature. This means that water temperature will increase in the future, but at a slower rate than air temperature. This is mainly due to evaporative cooling of rivers. The scenario B1 seems to show a more gradual increase whereas the scenario A2 seems to show a high variability over the years. Therefore, water temperature in New Brunswick, for all future time slices (2020’s, 2050’s or 2080’s) and scenarios (B1 or A2), were estimated as:
 (3)
(3)
where  are water and air temperatures, respectively. The projected increases in water temperature were then applied for each of the 15 sites, as similar increases are expected throughout the province [35] .
It should be noted that the WQI under climate change scenarios were calculated for each site using unchanged future water quality parameters for pH, Cond, TP, NH3, NO2, NO3 and SS. The only parameter that are projected
Table 4. Averaged air temperature (Ta) increases at Doaktown and averaged stream water temperature (Tw) increases at LSWM River.
to change in the present study are Tw and DO. Changes in other parameters identified above are beyond the scope of the present study.
Following the study of increase river temperatures under climate change the relationship between Tw and DO was studied for each studied rivers. Only DO was selected because the correlation analysis showed that this parameter was the only parameter related to river temperature. Therefore, other quality parameters are projected not to change as a result of increased water temperature. However, other parameters could change as a result of other factors, e.g., increase runoff and soil erosion, etc. As pointed out in Caissie et al. [1] and from equation 3 (above), each river is projected to increase in water temperature by 0.7 Ta. Therefore, the Tw-DO relationship will be subject to these changes under climate change, i.e., . As such, for an increase of 2˚C in Tw (or 2.9˚C Ta) the DO would decrease by 0.4 mg/L. The relationship for all other sites was calculated as the Tw-DO relation is specific to each river and this relationship is required to calculate future water quality index. Then the WQI was calculated for all sites under current and future conditions by both approaches.
For both methods the WQI was not highly different than during current conditions; however, a slight decrease in WQI is expected in the future under A2 scenario. Overall, the CCME WQI does not show a significant decrease in the future based on projected increase in air and river temperature under climate change. Under A2 scenario, the Weighted WQI will most likely decreased from 90.6 (current 2003-2011), to 90.1 (2020’s), 89.5 (2050’s) and 88.6 (2080’s), again a decrease that is very small overall. Somewhat large differences are noted between the two approaches and Figure 2 shows the comparison of both WQI approaches. Figure 2(a) compares the calculated WQI by CCME method and the weighted method under B1 whereas Figure 2(b) compares WQI under the A2 scenarios. The Weighted method generally showed a consistent 7 points higher than the CCME WQI.
4. Conclusion
Climate change impacts within river systems include changes in runoff, river flow and groundwater storage. In addition to these quantitative aspects, some water quality parameters are also expected to change. With respect to biogeochemical water quality, most climate change impacts can be attributed to changes in stream water temperature. The impact of climate change on stream water temperature is highly dependent on the future evolution of air temperature as well as on other meteorological and physical parameters. The present study showed that projected air temperature increase of 2˚C - 5˚C was very consistent across the province of New Brunswick and that the water temperature would most likely increase in the range of 70% of air temperature increase. This information was based on a long-term data and modeling analysis at Little Southwest Miramichi River. These changes will have an impact on dissolved oxygen concentrations and instream biological activities. The present study showed that dissolved oxygen (DO) was the only parameter (from the available water quality data in New Brunswick) which was correlated to water temperature. Therefore, a Tw-DO relationship was established for each river in order to predict future water quality index based on both water temperature and dissolved oxygen. Therefore, future water temperature was project for each river and corresponding WQI were calculated. The present study concluded that the water quality in New Brunswick Rivers was not projected to deteriorate significantly under climate change (from a drinking water perspective) based on the two methods and criteria used in the present study. Nevertheless, it should be pointed out that the present study makes the assumption that other water quality parameters will remain constant in the future under climate change. However, climate change may results in these parameters changing by other processes that increased air temperature. For instance, if climate change increases runoff, it is very likely that some parameters, particular those related to soil erosion, will also change in the future. In addition, the present study dealt with drinking water quality parameters and criteria. If the water quality was studied for other purposes, e.g. aquatic habitat conditions,
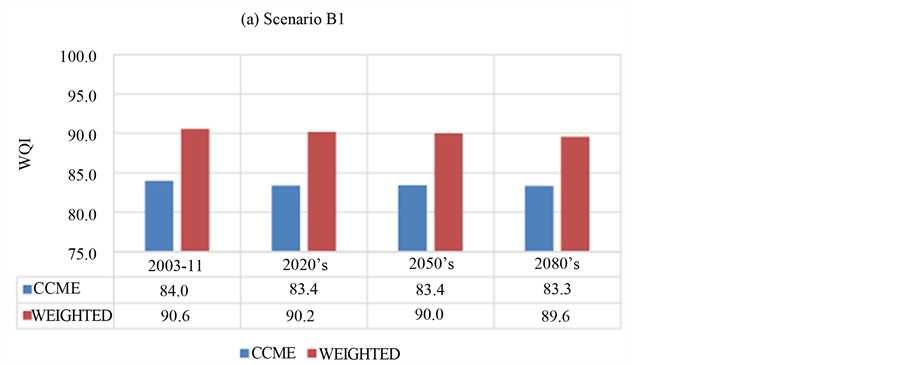
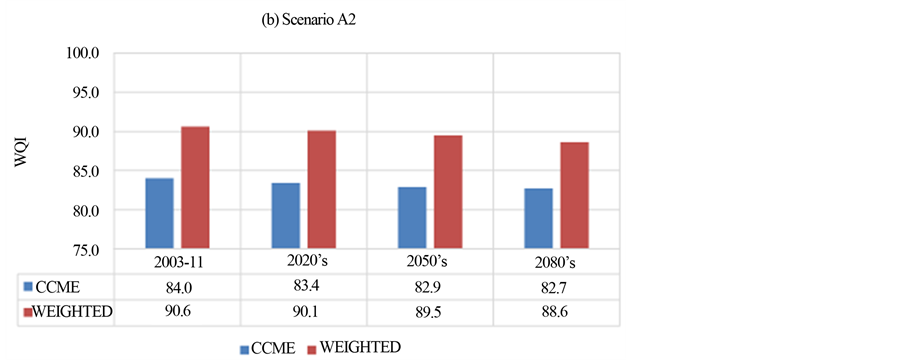
Figure 2. Comparison of CCME WQI and WEIGHTED WQI using a) scenario B1 b) scenario A2.
the selected criteria as well as thresholds would be very different than the one used in the present study. Under these conditions it is very likely that the results would be different. For instance, a good body of research is showing that from an aquatic habitat perspective, some New Brunswick rivers are currently experiencing close to lethal water temperatures (30˚C) in summer. Such high temperatures may not have a great influence on drinking water quality, but may have a significant impact on Atlantic salmon population as well as for other cold water species.
Acknowledgements
This study was funded by the New Brunswick Environmental Trust Fund. The authors remain thankful to Darryl Pupek and his team at the Department of Environment New Brunswick for helpful comments.
References
- Caissie, D., El-Jabi, N. and Turkkan, N. (2014) Stream Water Temperature Modeling under Climate Change Scenarios B1 & A2. Canadian Technical Report of Fisheries and Aquatic Sciences.
- Poole, G.C. and Berman, C.H. (2001) An Ecological Perspective on in-Stream Temperature: Natural Heat Dynamics and Mechanisms of Human-Caused Thermal Degradation. Environmental Management, 27, 787-802. http://dx.doi.org/10.1007/s002670010188
- Caissie, D. (2006) The Thermal Regime of Rivers: A Review. Freshwater Biology, 51, 1389-1406. http://dx.doi.org/10.1111/j.1365-2427.2006.01597.x
- Parks Canada (1999) Climate Change Scenario, Summer and Winter Temperatures, 2090. Air Issues Bulletin No. 100, Air Quality, Climate Change and Canada’s National Parks, Ottawa.
- IPCC (2008) Climate Change and Water. Technical Paper of the Intergovernmental Panel on Climate Change, IPCC Secretariat, Geneva, 210 p.
- Meisner, J.D. (1990) Potential Loss of Thermal Habitat for Brook Trout, Due to Climatic Warming, in Two Southern Ontario Streams. Transactions of the American Fisheries Society, 119, 282-291. http://dx.doi.org/10.1577/1548-8659(1990)119<0282:PLOTHF>2.3.CO;2
- Webb, B.W. (1996) Trends in Stream and Water Temperatures. Hydrological Processes, 10, 205-226. http://dx.doi.org/10.1002/(SICI)1099-1085(199602)10:2<205::AID-HYP358>3.0.CO;2-1
- Li, Z., Buchberger, S.G., Clark, R.M. and Yang, Y.J. (2010) Customizing Climate Change Adaptation at Drinking Water Treatment Plants. Water Distribution System Analysis 2010, Tucson.
- Arheimer, B., Andréasson, J., Fogelberg, S., Johnsson, H., Pers, C.B. and Persson, K. (2005) Climate Change Impact on Water Quality: Model Results from Southern Sweden. Ambio, 34, 559-566.
- Cruise, J.F., Limaye, A.S. and Nassim, A.-A. (1999) Assessment of Impacts of Climate Change on Water Quality in the Southeastern United States. Journal of the American Water Resources Association, 35, 1539-1550. http://dx.doi.org/10.1111/j.1752-1688.1999.tb04236.x
- Marshall, E. and Randhir, T. (2008) Effect of Climate Change on Watershed System: A Regional Analysis. Climatic Change, 89, 263-280. http://dx.doi.org/10.1007/s10584-007-9389-2
- Mimikou, M.A., Baltas, E., Varanou, E. and Pantazis, K. (2010) Regional Impacts of Climate Change on Water Resources Quantity and Quality Indicators. Journal of Hydrology, 234, 95-109. http://dx.doi.org/10.1016/S0022-1694(00)00244-4
- Carrière, A., Barbeau, B. and Cantin, J.F. (2007) Vulnerability of Drinking Water Treatment Plants to Low Water Levels in the St. Lawrence River. Journal of Water Resources Planning and Management, 133, 33-38. http://dx.doi.org/10.1061/(ASCE)0733-9496(2007)133:1(33)
- Delpla, I., Jung, A.-V., Baures, E., Clement, M. and Thomas, O. (2009) Impacts of Climate Change on Surface Water Quality in Relation to Drinking Water Production. Environment International, 35, 1225-1233. http://dx.doi.org/10.1016/j.envint.2009.07.001
- Environment Canada (2001) Threats to Sources of Drinking Water and Aquatic Ecosystem Health in Canada. National Water Research Institute, Burlington, NWRI Sceintific Assessment Report Series No. 1, 72 p.
- Schuster, C.J., Ellis, A.G., Robertson, W.J., Charron, D.F., Aramini, J.J., Marshall, B.J. and Medeiros, D.T. (2005) Infectious Disease Outbreaks Related to Drinking Water in Canada, 1974-2001. Revue Canadienne de Santé Publique, 96, 254-258.
- Dale, V.H. (1997) The Relationship between Land-Use Change and Climate Change. Ecological Applications, 7, 753- 769. http://dx.doi.org/10.1890/1051-0761(1997)007[0753:TRBLUC]2.0.CO;2
- Murdoch, P.S., Baron, J.S. and Miller, T.L. (2000) Potential Effects of Climate Change on Surface-Water Quality in North America. Journal of the American Water Resources Association, 36, 347-366. http://dx.doi.org/10.1111/j.1752-1688.2000.tb04273.x
- Schindler, D.W. (2001) The Cumulative Effects of Climate Warming and Other Human Stresses on Canadian Freshwaters in the New Millennium. Canadian Journal of Fisheries and Aquatic Sciences, 58, 18-29. http://dx.doi.org/10.1139/f00-179
- Thorne, O. and Fenner, R.A. (2011) The Impact of Climate Change on Reservoir Water Quality and Water Treatment Plant Operations: A UK Case Study. Water and Environment Journal, 25, 74-87. http://dx.doi.org/10.1111/j.1747-6593.2009.00194.x
- Kundzewicz, Z.W. and Krysanova, V. (2010) Climate Change and Stream Water Quality in the Multi-Factor Context. Climatic Change, 103, 353-362. http://dx.doi.org/10.1007/s10584-010-9822-9
- Kovats, R.S., Campbell-Lendrum, D. and Matthies, F. (2005) Climate Change and Human Health: Estimating Avoidable Deaths and Disease. Risk Analysis, 25, 1409-1418. http://dx.doi.org/10.1111/j.1539-6924.2005.00688.x
- Ebi, K.L., Mills, D.M., Smith, J.B. and Grambsch, A. (2006) Climate Change and Human Health Impacts in the United States: An Update on the Results of the US National Assessment. Environmental Health Perspectives, 114, 1318-1324. http://dx.doi.org/10.1289/ehp.8880
- Harman, J., Gawith, M. and Calley, M. (2005) Progress on Assessing Climate Impacts though the UK Climate Impacts Programme. Weather, 60, 258-262. http://dx.doi.org/10.1256/wea.105.05
- Canadian Council of Ministers of the Environment (2001) Canadian Water Quality Guidelines for the Protection of Aquatic Life: CCME Water Quality Index 1.0, User’s Manual. Canadian Environmental Quality Guidelines 1999, Canadian Council of Ministers of the Environment, Winnipeg.
- Canadian Council of Ministers of the Environment (2003) Canadian Water Quality Guidelines for the Protection of Aquatic Life: Guidance on the Site-Specific Application of Water Quality Guidelines in Canada: Procedures for Deriving Numerical Water Quality Objectives. Canadian Environmental Quality Guidelines 1999, Canadian Council of Ministers of the Environment, Winnipeg.
- Canadian Council of Ministers of the Environment (2006) A Sensitivity Analysis of the Canadian Water Quality Index. Canadian Council of Ministers of the Environment, Winnipeg.
- Lumb, A., Halliwell, D. and Sharma, T. (2006) Application of CCME Water Quality Index to Monitor Water Quality: A Case of the Mackenzie River Basin, Canada. Environmental Monitoring and Assessment, 113, 411-429. http://dx.doi.org/10.1007/s10661-005-9092-6
- Carr, G.M. and Rickwood. C.J. (2008) Water Quality Index for Biodiversity Technical Development Document. Report Prepared for Biodiversity Indicators Partnership, World Conservation Monitoring Center, Cambridge, 64 p.
- Khan, H., Khan, A.A. and Hall, S. (2005) The Canadian Water Quality Index: A Tool for Water Resources Management. MTERM International Conference, AIT, Thailand.
- Sánchez, E., Colmenarejo, M.F., Vincente, J., Rubio, A., García, M.G., Travieso, L. and Borja, R. (2007) Use of the Water Quality Index and Dissolved Oxtgen Deficit as Simple Indicators of Watersheds Pollution. Ecological Indicators, 7, 315-328. http://dx.doi.org/10.1016/j.ecolind.2006.02.005
- Liu, Z., Sun, G., Huang, S., Sun, W., Guo, J. and Xu, M. (2012) Water Quality Index as a Simple Indicator of Drinking Water Source in the Dongjiang River, China. International Journal of Environmental Protection, 2, 16-21.
- Debels, P., Figueroa, R., Urrutia, R., Barra, R. and Niell, X. (2005) Evaluation of Water Quality In Chillán River (Central Chile) Using Physicochemical Parameters and a Modified Water Quality Index. Environmental Monitoring and Assessment, 110, 301-322. http://dx.doi.org/10.1007/s10661-005-8064-1
- Alcamo, J., Bouwman, A., Edmonds, J., Grübler, A., Morita, T. and Sugandhy, A. (1995) An Evaluation of the IPCC IS92 Emission Scenarios. In: Houghton, J.T., MeiraFilho, L.G., Bruce, J., Lee, H., Callander, B.A., Haites, E., Harris, N. and Maskell, K., Eds., Climate Change 1994, Radiative Forcing of Climate Change and an Evaluation of the IPCC IS92 Emission Scenarios, Cambridge University Press, Cambridge, 233-304.
- Turkkan, N., El-Jabi, N. and Caissie, D. (2011) Floods and Droughts under Differentclimate Change Scenarios in New Brunswick. Canadian Technical Report of Fisheries and Aquatic Sciences 2928.