Journal of Water Resource and Protection
Vol.5 No.12(2013), Article ID:40544,5 pages DOI:10.4236/jwarp.2013.512118
Assessment of Sedimentation Impacts on Small Dams—A Case of Small Reservoirs in the Lotsane Catchment
1University of Botswana, Department of Geology, Gaborone, Botswana
2Centre for Coordination of Agricultural Research & Development in Southern Africa (CCARDESA), Gaborone, Botswana
Email: alemaw@mopipi.ub.bw, bfalemaw@gmail.com
Copyright © 2013 Berhanu F. Alemaw et al. This is an open access article distributed under the Creative Commons Attribution License, which permits unrestricted use, distribution, and reproduction in any medium, provided the original work is properly cited.
Received May 31, 2013; revised July 2, 2013; accepted August 3, 2013
Keywords: Sedimentation; Erosion; Revised Universal Soil Loss Equation; Sediment Yield; Sediment Delivery Ratio; Small Reservoirs; Botswana
ABSTRACT
Sedimentation is a major problem for agricultural dams in Botswana, as it reduces the storage capacity and life span of the reservoirs. The process of sedimentation starts from day one of the impounding of water in any given reservoir. Even though a provision is made for every reservoir during planning for a certain storage capacity, specifically for sediment deposition, called dead storage, a major portion of the sediment gets deposited for many years of the reservoir’s life in areas other than the dead storage, and this trend cannot be reversed at easy cost. This study is aimed at the analysis of prevailing sedimentation processes in the nearby dozens of dams found in the Lotsane catchment located within the Limpopo Basin of Botswana, and focuses on assessment of annual sedimentation rate. A spatial analysis and modelling study was conducted based on the Revised Universal Soil Loss Equation and GIS to determine sediment yield and degree of impact of each reservoir for a given landscape, rainfall and catchment heterogeneity. Field observations and soil sampling were carried out in order to determine the factors that lead to reservoir sedimentation. Spatial data on the dams in Lotsane catchment were also collected from Ministry of Agriculture, which were used for ground-truthing, GIS-based calculations and model validation. The average sediment rate and sediment delivery ratio were found to be 1.74 t/ha/year and 81%, respectively. These are useful parameters to estimate service life of the dams and plan remedial measures related to sedimentation problems.
1. Introduction
Accelerated soil erosion is a serious problem worldwide, with high economic and environmental impacts because of its extent, magnitude, rate, and complex processes [1]. Numerous human-induced activities, such as mining, construction, and agricultural activities, disturb land surfaces, thus resulting in erosion. Other problems caused by soil erosion include loss of soil nutrients, declining crop yields, reduction in soil productivity [2]. Moreover, soil moved by erosion carries nutrients, pesticides and other harmful farm chemicals into rivers, streams, and ground water resources [3] and as a result, protecting soils from erosion is important to sustain human life.
The most important physical factors for process of soil erosion are climate, topography, and soil characteristics. Many parts of the world are extremely prone to erosion as it suffers from long dry periods followed by heavy erosive rainfall, falling on steep slopes with fragile soils, resulting in considerable amounts of erosion. With a slow rate of soil formation, any soil loss of more than 1 t/ha year−1 can be considered as irreversible within a time span of 50 - 100 years depending on the size of the catchment.
Various approaches and methods for risk assessment or predictive evaluation on soil erosion by water are available in international literature. By analysing and assessing various dominating factors of soil erosion, [4] introduced the universal soil loss equation (USLE) to assess soil erosion by water by collecting soil erosion data of 8000 communities in 21 states in USA. Basically, USLE predicts the long-term average annual rate of erosion on a field slope based on rainfall pattern, soil type, topography, crop system, and management practices (soil erosion factors). By including additional data and incorporating recent research results, the USLE methodology was improved and a revised version of this model (RUSLE) further enhanced its capability to predict water erosion by integrating new information that made available through research of the past 40 years [2]. Moreover, the combined use of GIS and erosion models, such as USLE/ RUSLE, has been proved to be an effective approach for estimating the magnitude and spatial distribution of erosion [5-7].
Siltation, in-flowing sand that takes up the active storage capacity of reservoirs, is a common problem in most SRs in the Lotsane catchment and the entire Limpopo basin. In addition to siltation in Small Reservoirs, other common challenges are: 1) Limited storage capacityLimpopo Basin landscape and valley geomorphology are generally not suitable for siting efficient dams. Furthermore available flows in small watersheds are not reliable due to limited and high variability of rainfall; 2) Limited resilience under climate change and competing water demands-Climate change, increasing demand for water and competing water demands reduce small reservoir resilience when compared with smaller ones [8]. This by itself poses a challenge to improve sustainability in planning and management of small reservoirs; and 3) Livestock watering-Livestock watering directly supplied from reservoirs is a common practice in most small reservoirs in the Limpopo Basin. Failure to install specific livestock water delivery systems such as drinking troughs leads to structural damage of embankments of most small reservoirs. Pollution control can also be enhanced through fencing and building of drinking troughs.
Similarly, recent version is the spatially distributed soil erosion and sediment delivery model WaTEM/SEDEM [9]. This is a combined version of two empirically-based soil erosion modes, namely WaTEM (Water and Tillage Erosion Model) [10] and SEDEM (Sediment Delivery model) [11].
The main aim of the manuscript and the modeling study is to predict sediment delivery to river channels in the watersheds that drain to selected SR sites, and to eventually simulate transport and deposition in small reservoirs. In this study we applied RUSLE model and derived its parameters to estimate the sediment yield from the various watersheds that drain to 22 dams in the Lotsane catchment. The model focuses on spatial variability and is useful in estimating the spatial patterns of soil loss and sediment flow across land units. Critical rainfall intensities for each season can also be incorporated to determine the maximum seasonal erosion potential from a watershed or land units.
2. Study Area and Data
The study area is situated at latitudes between 26˚17ʹE and 28˚54ʹE longitudes between 22˚51ʹS and 22˚02ʹS, in Central Botswana. The land cover consists mainly of strongly grazed range land vegetation consisting of herbs, low shrub and grassland with different canopy densities. Lotsane catchment is considered to be in a semi-arid region, and the average annual precipitation is estimated to be 400 mm.
Its altitude ranges between 425 m and 1693 m. The catchment consists of twenty three dams, most of which are distributed at the northern part. This is due to the high density of streams in the upland areas as illustrated in Figure 1 which also shows the stream network extracted from the digital elevation model of the catchment.
Some general soil, geological and geometrical characteristics of the studied watersheds and dam characteristics (namely: terms of coordinates, catchment areas, dam volume, stream length) have been obtained from the Ministry of Agriculture and a ground-truthing exercise has been conducted through continuous site visits and data collection.
The climate of the study area is sub-humid Saharan with humid and relatively hot summers and dry and chilly winters. The drought period extends over more than 6 months (May to October). Finally, the land use of the study area is mainly agricultural (up to 50%), pasture coverage is up to 10% while the natural vegetation coverage represents less than the 40%. All the aforementioned conditions constitute the study area particularly sensitive to extended soil washout in case of intense rainfall events.
3. Methodology
This modeling study was based on soil erosion prediction by universally known model called Revised Universal Soil Loss Equation (RUSLE). RUSLE according to [2] is an empirically based model founded on the Universal Soil Loss Equation, USLE [4]. RUSLE model enables prediction of an average annual rate of soil erosion for a site of interest for any number of scenarios involving cropping systems, management techniques, and erosion control practices, and it has been found to produce realistic estimates of surface erosion over small areas, hence the catchment has been divided in twenty two subcatchments.
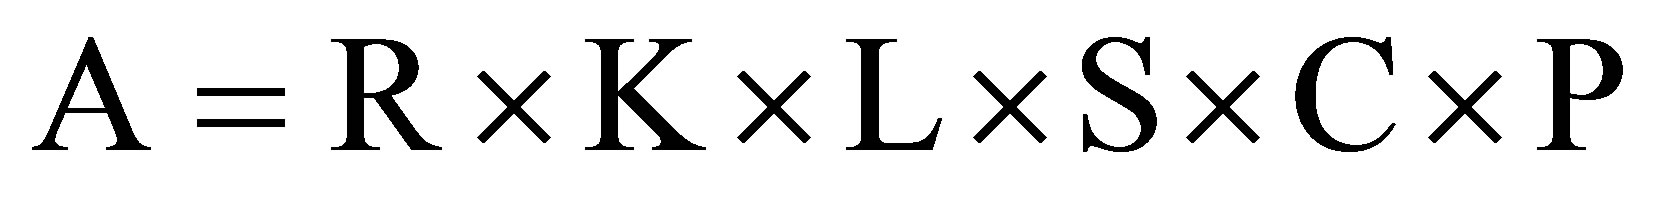
Five major factors (rainfall pattern, soil type, topography, crop system, and management practices) are used in RUSLE for computing the expected average annual erosion [2] through the following equation:
 (1)
(1)
where A is the estimated soil loss (t ha−1yr−1); R is the Rainfall Erosivity factor (MJ mm ha−1hr−1); and K is Soil Erodibility factor (t ha hr MJ−1ha mm−1). The other factors which are all dimensionless are: L is slope length factor; S is slope gradient factor; C is land cover factor;
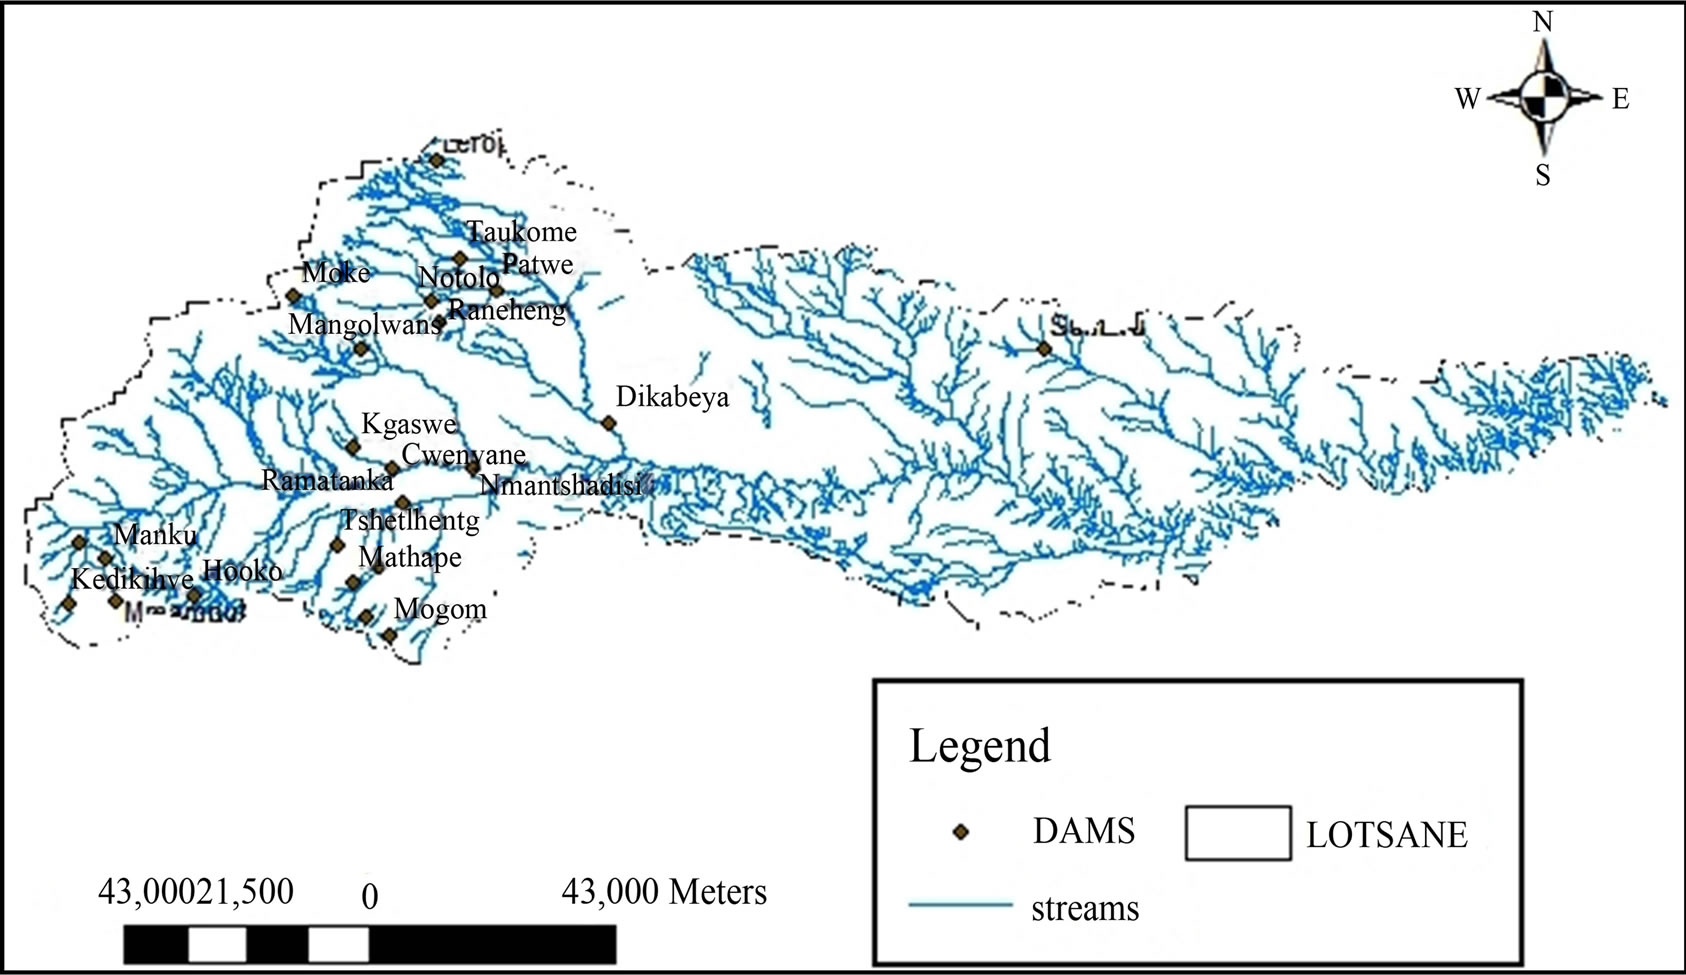
Figure 1. Streams and dam distribution in Lotsane catchment.
and P is management practice factor.
These factors explain sedimentation processes from watersheds which are related to catchment physiography, sediment sources, transport system, texture of eroded material, land cover etc. At each of the dams and for each sub-catchment draining to the respective dams, the variables and factors in sediment yield computation using RUSLE were computed and evaluated from various physiographic, catchment and hydrologic data sources.
Rainfall Erosivity factor (R) is dependent on the kinetic energy and the maximum 30 minute intensity and it shows the erosivity of rainfall events [4]. Rainfall Erodibility Factor (K) which is used to consider the soil’s resistance to erosion besides the rainfall erosivity. Soil erodibility is the rate of soil loss per unit of R-factor on a unit plot [2]. Values for K typically range from about 0.013 to 0.059 SI units [12], high-sand and high-clay content soils have the lower values and high-silt content soils have higher values. Direct measurement of soil erodibility, resistance offered by the soil to both detachment and transport processes, is not only costly but time consuming also. So, efforts have been made to predict it from the soil physical properties. The soil erodibility monograph [13] is a popular tool for estimating K values.
The Slope-Length Factor (LS) is an aggregate factor representing slope length, L (in meter) and the slope steepness factor, S, whereas Land Cover Factor (C) is defined as the ratio of soil loss from land with specific vegetation to the corresponding soil loss from continuous fallow [4]. The C factor was estimated using local landuse maps and Google earth satellite image to determine the major land uses in the various watersheds.
On the other hand, Management Practice Factor (P) gives the ratio between the soil loss expected for a certain soil conservation practice to that with upand downslope ploughing [4]. At the large watershed scale, the differences in support practices, such as terracing, contour tillage, and so on, cannot be reflected from a landuse map. Also, the possible method for calculating Pfactor is by means of an empirical equation. In this study, the Wener method [14] was used to determine the value for the P-factor.
4. Results and Discussions
Results of calculations of the RUSLE parameters of the twenty two dams and the respective watersheds are illustrated. The estimated K values from the soil samples collected from the field ranged between 0.31 and 0.42. The physical, chemical, and mineralogical soil properties and their interactions that affect K values are many and varied.
Moreover, several erosion mechanisms are operating at the same time, each one relating differently to a specific soil property. It is therefore unlikely that a relatively few soil characteristics will accurately describe K values for each soil, thus it proved difficult to determine the K values. Variations in K through the seasons seem to be primarily related to two factors, soil texture, and soil water. Table 1 summarizes the R, K and LS Factors at the various watersheds of the Lotsane catchment draining to each dam site.
Furthermore, Sediment Delivery Ratio (SDR) is also computed which is part of the soil eroded in an overland region, which a catchment deposits within the catchment
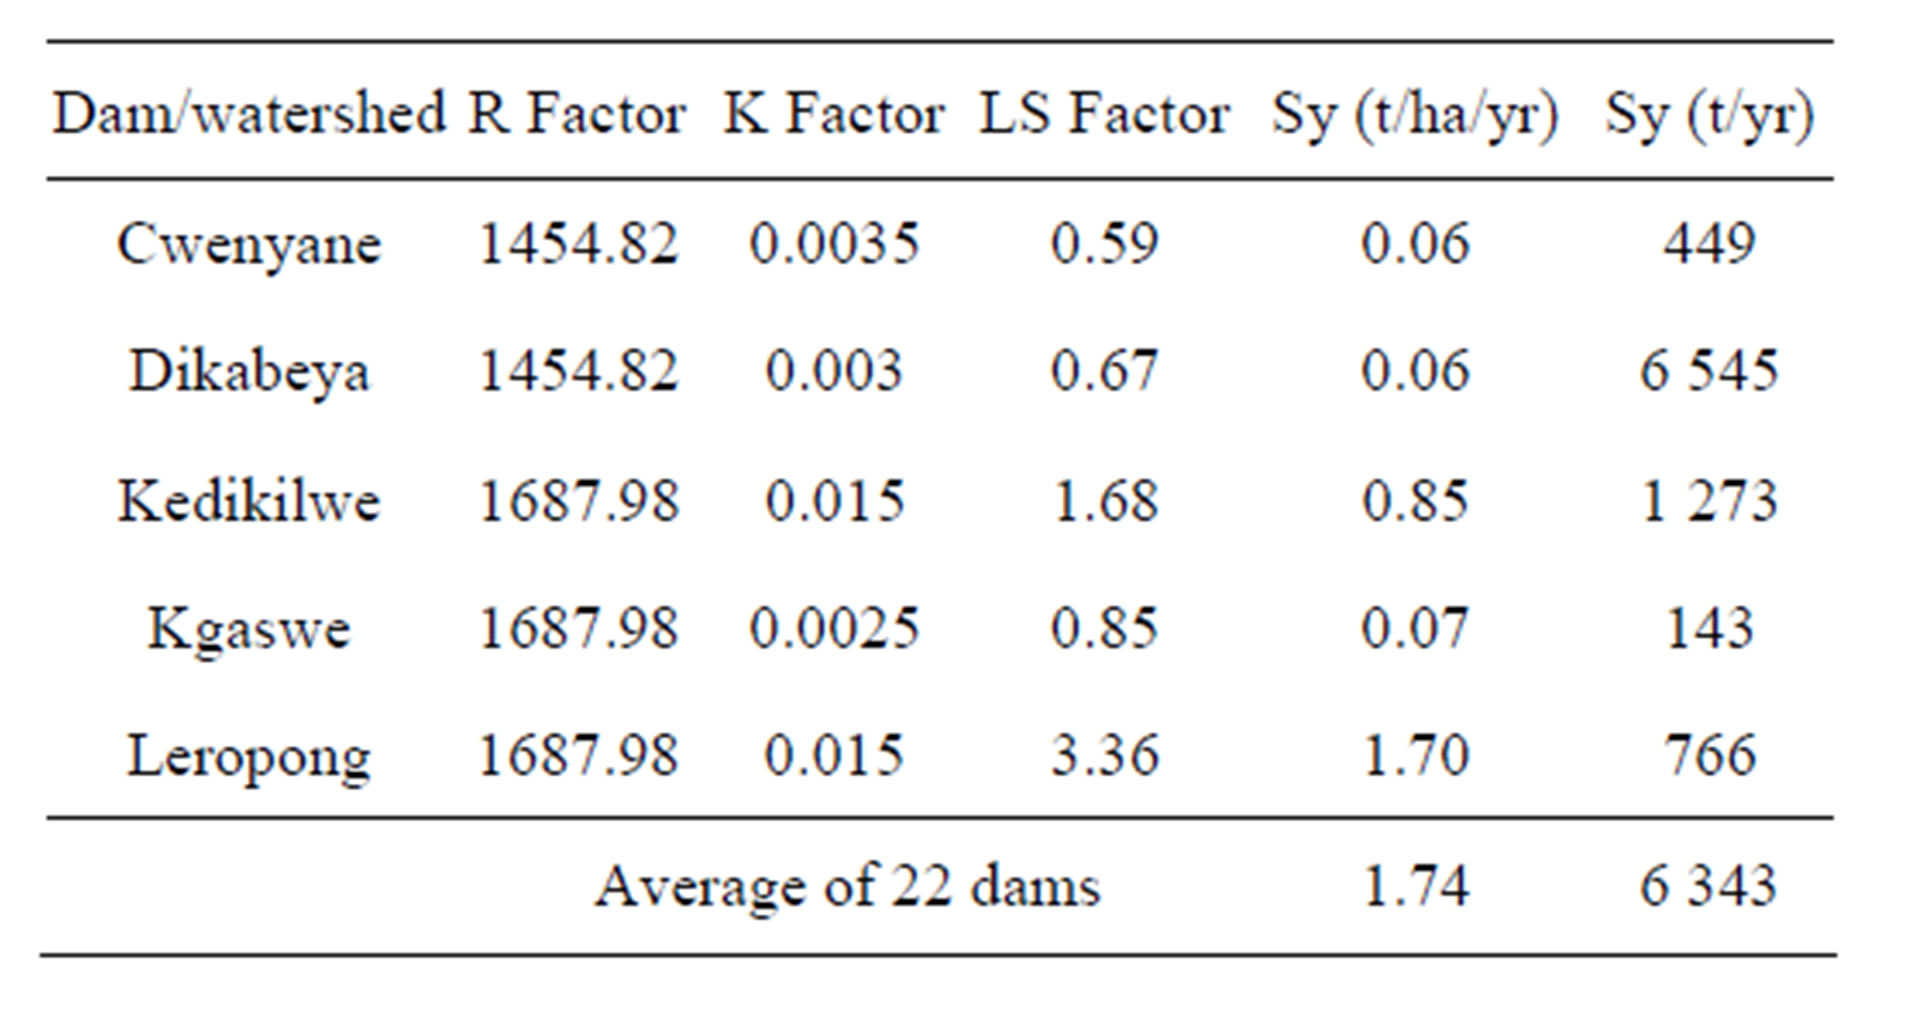
Table 1. Calculated sediment yield (Sy) at five selected dams.
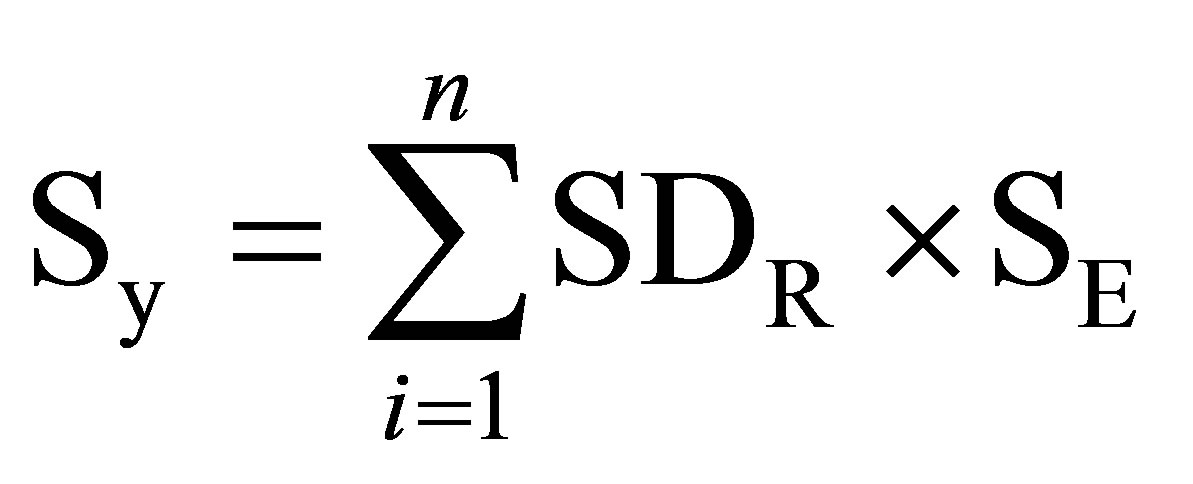
before reaching its outlet. The ratio of sediment yield to total surface erosion is termed as sediment delivery ratio (SDR). In a GIS framework, if SE is the amount of soil erosion produced within the ith cell of the catchment, estimated using the RUSLE Equation (1), then the sediment yield for the catchment, Sy, was obtained as below:
 (2)
(2)
where n is the total number of cells over the catchment, and SDR is the fraction of SE, that ultimately reaches the nearest channel. SDR Values for areas at channel cells are assumed to be unity.
The sediment delivery ratio was derived using the empirical equation of [15] expressed as a function of % slope of main stream channel (SLP) as SDR = 0.627 × (SLP)0.403. Table 2 shows the sediment delivery ratio (SDR) and the sediment yields of the first five of the watersheds. The average of the 22 dams’ Total Potential Erosion is found to be 184,057 t/yr and the sediment yield in 132,886 t/yr. The specific sediment yield (SpSy) is illustrated in Figure 2.
5. Conclusions
Mantshadidi shows the highest sediment yield, despite the relatively low sediment rate in the area, this may be due to the fact that it has a rather large watershed area (1460 km2), as compared to other catchments, which had high sedimentation rate but lower sediment yield, for example, Pidimane, which had the highest sedimentation rate but a rather average sediment yield. Mathape showed the lowest sediment rate, which can also be attributed to its low catchment area (165 km2) and also the low sedimentation rate.
The average annual sedimentation rate ranges between 0.54 and 85.29 ton/ha/yr. High sedimentation rates were observed where there are steep slopes and high rainfalls, this indicates that sedimentation rate is highly dependent on the slope factor and the rainfall intensity. The annual average soil loss rate was predicted to be 26 tons/ha/year (2559 tons/km2/year) in the Lotsane watershed.
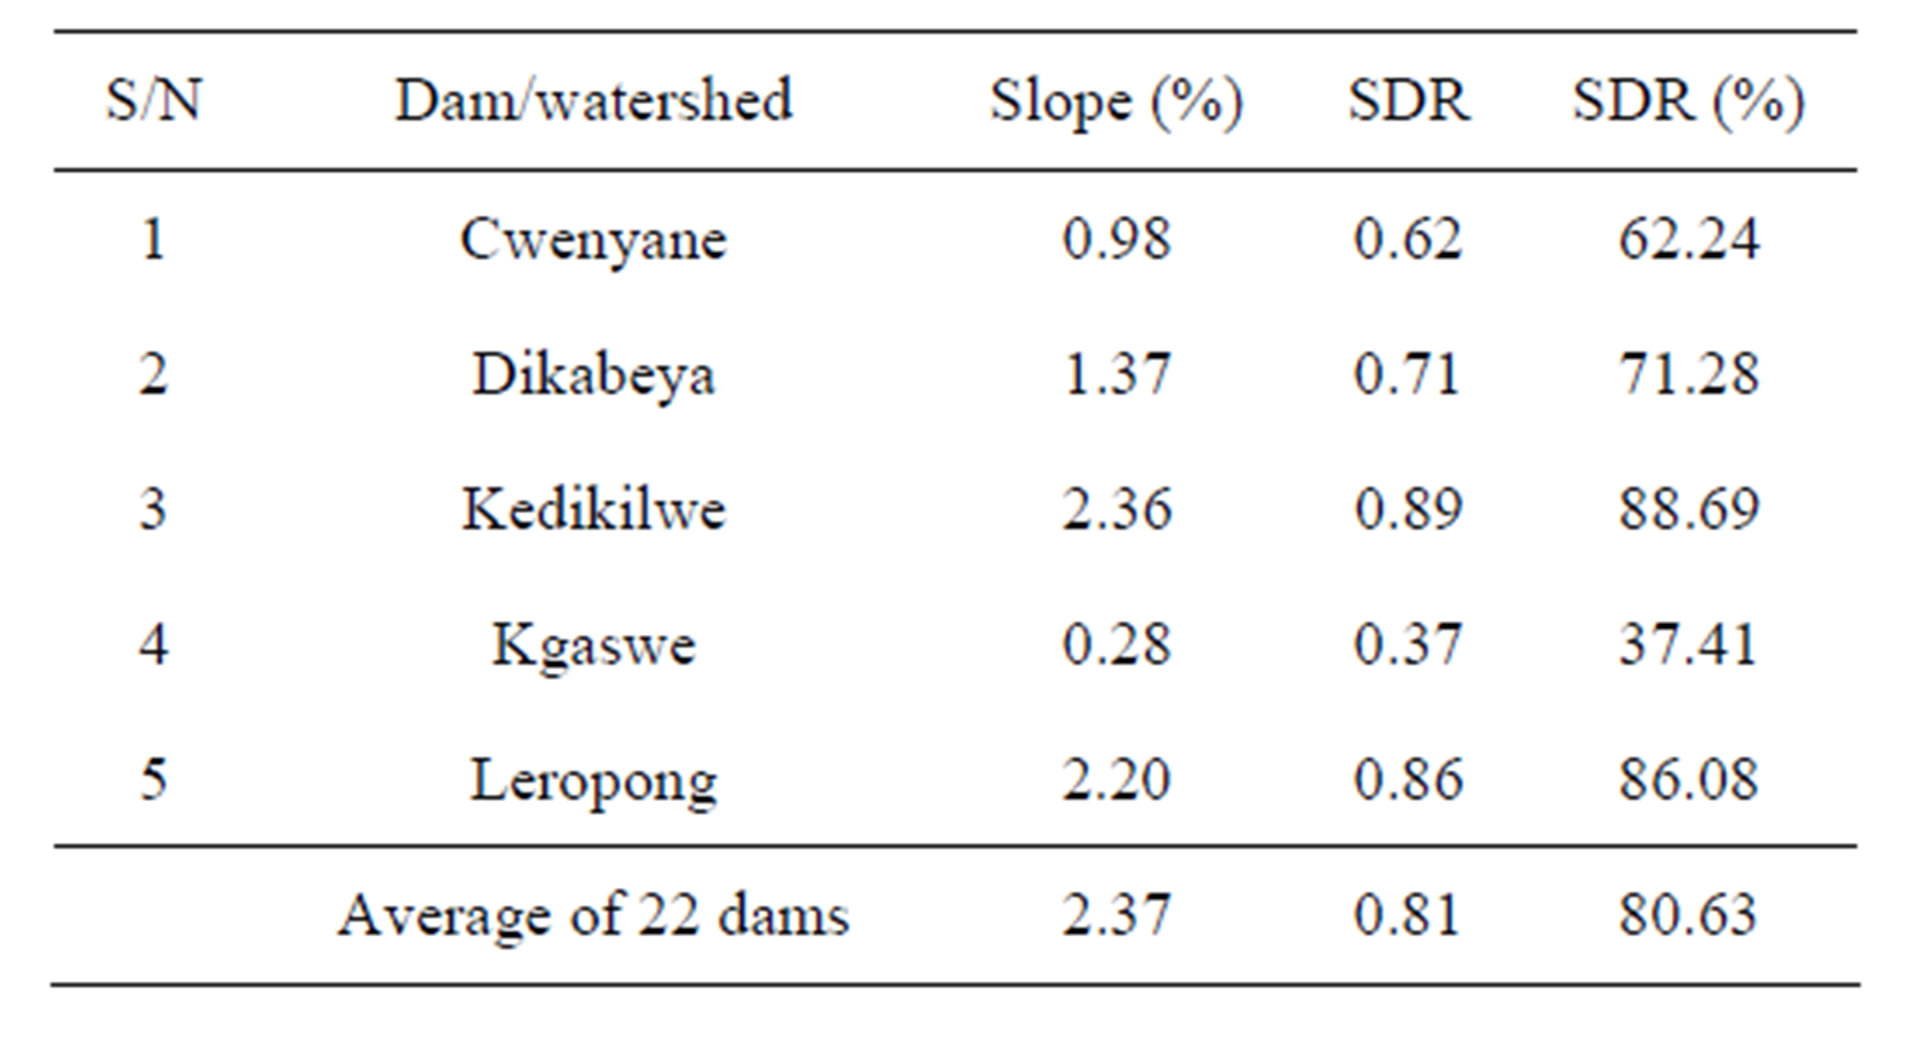
Table 2. Calculation of sediment delivery ratio (SDR).
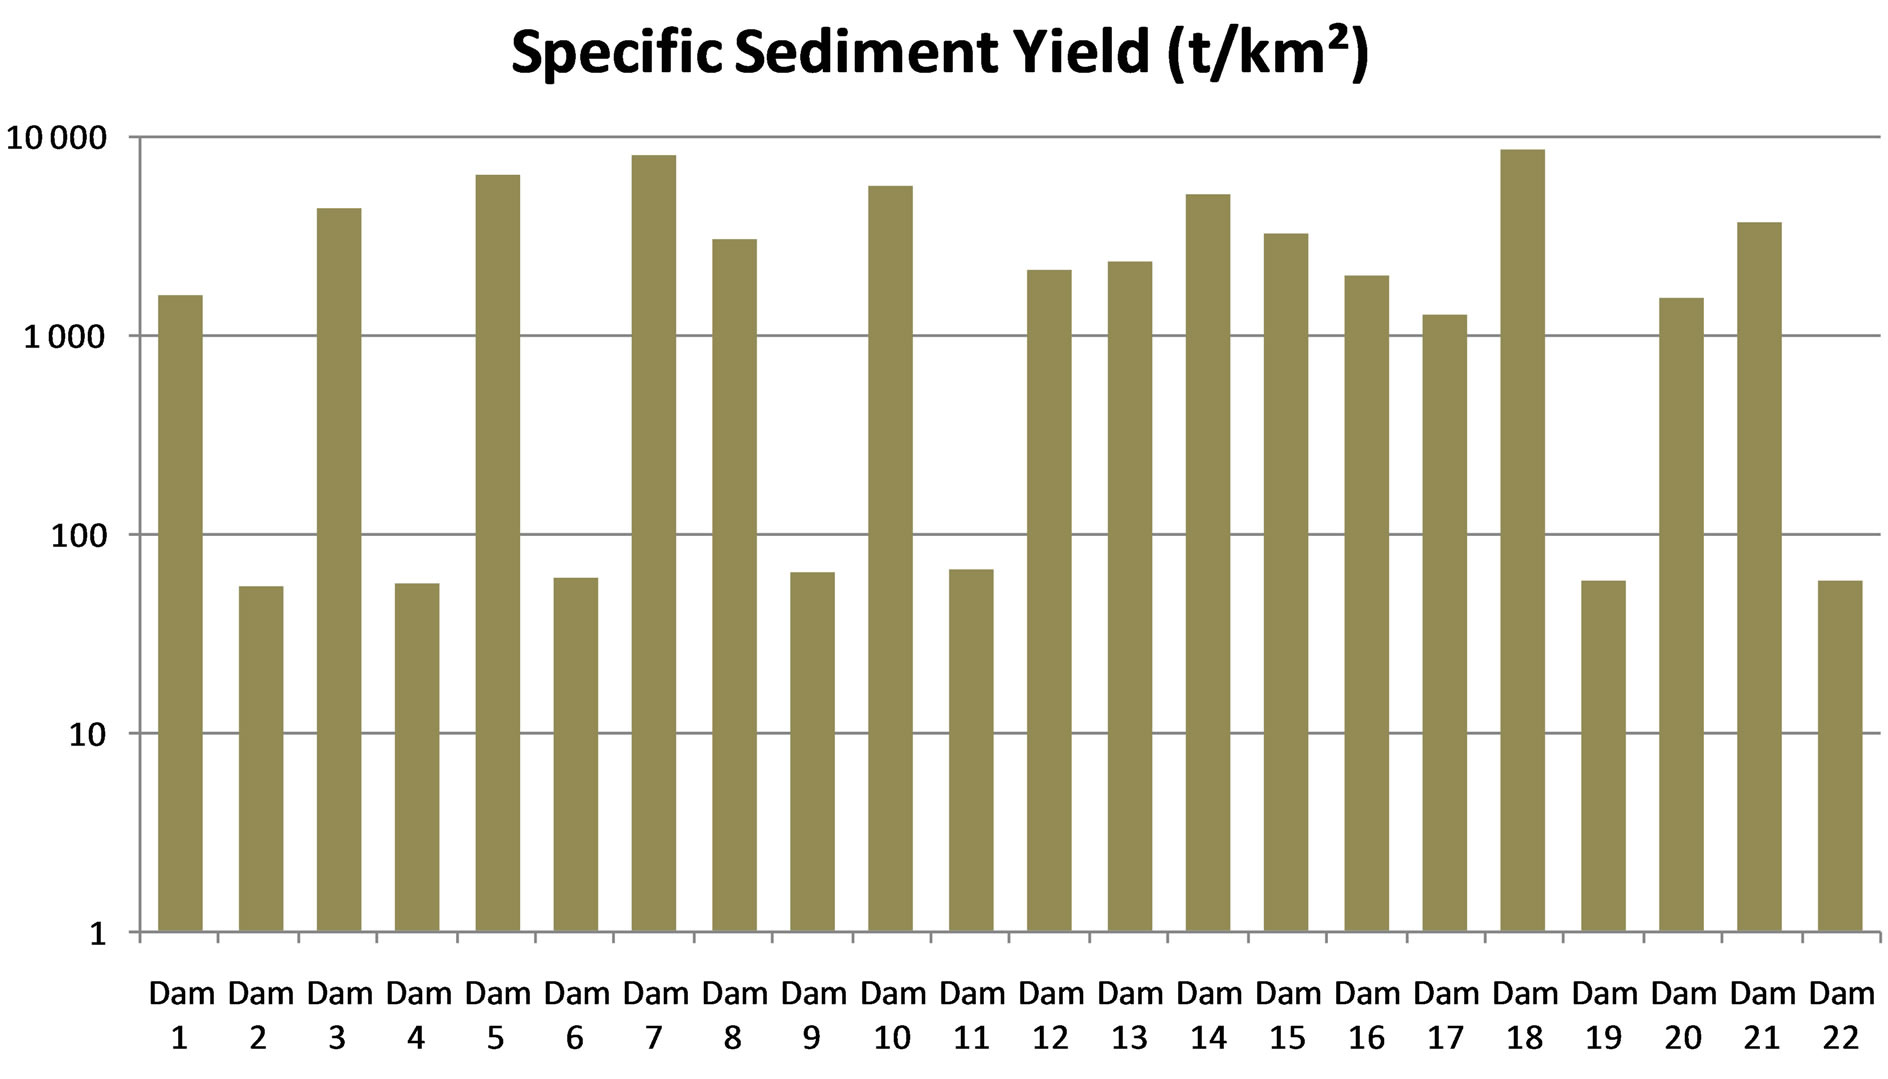
Figure 2. Variation of sediment yield with rainfall.
Based on the results of annual average soil loss rate, the SDR was predicted in the various reservoirs of Lotsane catchment. The average sediment delivery ratio of Lotsane catchment is 81%, which is considerably high and may be due to the fact that most of the sub-watersheds are located within hilly areas, resulting in steep slopes, for example Pidimane sub-watershed has a slope of 12%, and most of the streams in the catchment have no flood plain. The construction of these dams in the area may also be a contributing factor, since areas near the streams and the reservoirs are continuously developing, and also attracting farmers, because of the available water supply. It may also be due to the flat basin formation of the Lotsane watershed, resulting in faster rainfall runoff and high SDR values.
The approach and results can be used as a maintenance planning system by estimating recurrence interval of siltation filling up of active storage of small reservoirs. Actual decision on the timing of dredging should be based on more bathymetric information collection. This involves bathymetric survey [16]. Adequate characterization of the actual silts accumulated is also essential for implementation of cost-efficient dredging methods.
Furthermore, soil erodibility nomographs can be developed for local conditions that might be useful to be used for practitioners and managers of dam operation and maintenance. Similar monographs have been developed for farmlands and construction sites by [13].
Health, ecological and ecosystem aspects of small reservoir management should also involve stakeholders with key-indicators that are useful for sustainability of small reservoirs in this typical environment and the Limpopo basin.
6. Acknowledgements
The authors appreciate the Challenge Program on Water and Food which supported part of the study. Water Net is also appreciated for presentation of the draft paper during the 13th Annual Symposium.
REFERENCES
- R. Lal, “Soil Erosion by Wind and Water: Problems and Prospects,” In: R. Lal, Ed., Soil Erosion Research Methods, 2nd Edition, Soil and Water Conservation Society, St. Lucie Press, 1994, p. 19.
- K. G. Renard, G. R. Foster, G. A. Weesies, D. K. McCool and D. C. Yoder, “Predicting Soil Erosion by Water: A Guide to Conservation Planning with the Revised Universal Soil Loss Equation (RUSLE),” Agriculture Handbook No. 703, 1997, USDA-ARS.
- E. Z. Nyakatawa, K. C. Reddy and J. L. Lemunyon, “Predicting Soil Erosion in Conservation Tillage Cotton Production Systems Using the Revised Universal Soil Loss Equation,” Soil Till Research, Vol. 57, No. 4, 2001, pp. 213-224. http://dx.doi.org/10.1016/S0167-1987(00)00178-1
- W. H. Wischmeier and D. D. Smith, “Predicting Rainfall Erosion Losses,” Agriculture Handbook, No. 537, 1978, USDA Science and Education Administration.
- G. Fu, S. Chen and K. D. McCool, “Modeling the Impacts of No-Till Practice on Soil Erosion and Sediment Yield Using RUSLE, SEDD and ArcView GIS,” Soil Tillage Research, Vol. 85, No. 1-2, 2006, pp. 38-49. http://dx.doi.org/10.1016/j.still.2004.11.009
- E. H. Erdogan, G. Erpul and I. Bayramin, “Use of USLE/ GIS Methodology for Predicting Soil Loss in a Semiarid Agricultural Environment,” Environmental Monitoring and Assessment, Vol. 131, No. 1-3, 2007, pp. 153-161. http://dx.doi.org/10.1007/s10661-006-9464-6
- L. A. Lewis, G. Verstraeten and H. Zhu, “RUSLE Applied in a GIS Framework: Calculating the LS Factor and Deriving Homogeneous Patches for Estimating Soil Loss,” International Journal of Geographical Information Science, Vol. 19, No. 7, 2005, pp. 809-829. http://dx.doi.org/10.1080/13658810500105705
- B. F. Alemaw, J. Jiyane and T. E. Simalenga, “Resilience of Small Reservoirs and Water Development in the Limpopo Basin: The Human and Climate Change Dimension,” Proceedings of the 3rd International Forum on Water and Food, 14-17 November 2011.
- A. C. Brunner, “Soil Erosion Modeling at Small Reservoir Scale by WaTEM/SEDEM,” Small Reservoirs Tool Kit. 2012. www.smallreservoirs.org
- K. Van Oost, G. Govers and P. J. J. Desmet, “Evaluating the Effects of Changes in Landscape Structure on Soil Erosion by Water and Tillage,” Landscape Ecology, Vol. 15, No. 6, 2000, pp. 579-591. http://dx.doi.org/10.1023/A:1008198215674
- A. Van Rompaey, G. Verstraeten, K. Van Oost, G. Govers and J. Poesen, “Modelling Mean Annual Sediment Yield Using a Distributed Approach,” Earth Surface Processes and Landforms, Vol. 26, No. 11, 2001, pp. 1221- 1236. http://dx.doi.org/10.1002/esp.275
- G. R. Foster, D. K. McCool, K. G. Renard and W. G. Moldcrnhauer, “Conversion of the Universal Soil Less Equation to SI Metric Units,” Journal of Soil and Water Conservation, Vol. 3, 1981, pp. 355-359.
- W. H. Wischmeier, C. B. Johnson and B. V. Cross, “A Soil Erodibility Nomograph for Farmland and Construction Sites,” Journal of Soil and Water Conservation, Vol. 26, 1971, pp. 189-193.
- A. Lufafa, M. M. Tenywa, M. Isabirye, M. J. G. Majaliwa and P. L. Woomer, “Prediction of Soil Erosion in a Lake Victoria Basin Catchment Using a GIS-Based Universal Soil Loss Model,” Agricultural Systems, Vol. 73, 2003, pp. 1-12.
- J. R. Williams and H. D. Berndt, “Sediment Yield Computed with Universal Equation,” Journal of Hydraulic Division, ASCE, Vol. 98, 1972, pp. 2087-2098.
- A. C. Brunner, “Bathymetric Survey by Depth-Sonar and Lake Sediment Coring by Beaker Sampler to Identify Sediment Budgets and Siltation Rates of Small Reservoirs,” Small Reservoirs Tool Kit, 2012. www.smallreservoirs.org