Journal of Water Resource and Protection
Vol.4 No.6(2012), Article ID:19892,9 pages DOI:10.4236/jwarp.2012.46036
Modeling the Impact of Land-Use Change on Water Budget of Gaza Strip
1Civil Engineering Department, Islamic University of Gaza, Gaza, Palestinian Territory
2Engineering Science Department, University College of Applied Science, Gaza, Palestinian Territory
Email: jhamad@iugaza.edu.ps
Received March 21, 2012; revised April 18, 2012; accepted May 19, 2012
Keywords: Land-Use Change; Automated Geospatial Watershed Assessment; Water Budget; Hydrologic Modeling; Gaza Strip Water Crisis
ABSTRACT
Gaza has a water crisis and faces serious challenges for the future sustainability of its water resources. Land-use change has an expected effect on water budget of the Gaza Strip. Three different land cover scenarios; the and cover of 2007, land cover of 2020, and full urbanization land cover were simulated independently using The Automated Geospatial Watershed Assessment (AGWA) tool which work under the umbrella of GIS. In general, the simulation results indicate that land-cover changes will significantly alter the hydrologic response of Gaza region. Percolation is expected to decrease in all options as urban areas are expanded where as the simulated surface runoff reflected a relative departure from the first scenario comparing with other scenarios. In the baseline scenario (2007), the simulated surface runoff and percolation represent 12% and 41% respectively from the water budget components of the Gaza Strip. In year 2020, these values were expected by the simulation results to be 20% and 27% respectively. A unique linear relationship between the relative change in urban area and the corresponding relative change in surface water has been investigated from the simulation results. The analysis of the three urbanization scenarios can give decision makers better understand for the future situation and assist them to advance towards achieving sustainable development planning for water resources system in the Gaza Strip.
1. Introduction
Gaza Strip is a part of historical Palestine as shown in Figure 1. It is a narrow strip located on the north east of the Sinai Peninsula on the eastern coast of the Mediterranean Sea. It locates at longitude 34.20 degrees east and latitude 31.25 degrees north. It is about 41 km long and between 6 and 12 km wide with total area of 365 square kilometers [1].
Gaza Strip faces serious water crises. Groundwater aquifer is considered the main and only water supply source for all kind of human usage in the Gaza Strip (domestic, agricultural and industrial) and this aquifer can only be fed by rainfall and lateral flow from the east. An average of 317 mm rainfall per year is not a little quantity. However, this rainfall occurs only in about 41 days with high intensity so that only a little amount of this rainfall could infiltrate to the aquifer and the rest either evaporates or runoff to the sea or to the wastewater networks [2]. The average recharge is considered 40% of the whole rainfall quantity that is about 45 MCM/Year [3]. Another reason for the water deficit is the large increase in the urban areas that led to a decrease in the recharge quantity of the aquifer. This decrease will lead to seawater intrusion in some areas as a result of the pressure differences between the groundwater elevation and seawater level. Another important reason for the water deficit is that the Israeli authorities behavior which catch the flow from the catchment area outside Gaza region by collective dams. The study area (Gaza Strip) is not a one single watershed but contains many sub-watersheds. These watersheds extend out Gaza Strip region to the Israeli side. Figure 2 shows the main watersheds that extend through the region of the Gaza Strip. The main watershed, the largest basin in historical Palestine, is Wadi Gaza basin (3400 km2). The sub-watershed extended through Gaza Strip regions were considered as the study area.
Statistics show that about 150 million m3 from the aquifer is used in 2005 and only about 105 million m3 is recharged (45 million m3 from rainfall recharge and 60 million m3 from lateral flow) to the aquifer with deficit equal to 45 million m3.This deficit increases in 2007 to equal 62 million m3 [4]. The problem will be more complex in the future as the population increases and so the need to water.
Aish et al. (2010) used WetSpass model to estimate the groundwater recharge of the Gaza Strip. WetSpass was built to estimate the surface runoff, actual evapotranspiration and groundwater recharge. But the study focused on the ground water recharge. The spatial average recharge is estimated as 108 mm/year This corresponds to a volumetric average annual recharge of 39.40 Mm3/year [5]. Alslaibi and Mogheir (2009) performed an applied hydrological study to estimate the hydrologic cycle components of Gaza Strip. The average annual rainfall calculated by using Thissen method while evapotranspiration estimated by using Penman method, but empirical equations were used for computing the interception and infiltration. The analysis considered the data collected for the years 2005 and 2006. The results of the average annual precipitation, interception, evapotranspiration infiltration and the resulted runoff were 350.0 mm/year, 49.7 mm/year, 128.2 mm/year, 77.8 mm/year and 94.5 mm/year respectively [6]. Khalaf and et al. (2006) studied the hydrological system of Gaza governorates to assess Rainfall Losses due to Urban Expansion of Gaza Strip. The total amount of rainwater losses due to urbanization as surface runoff is estimated 14.5 Mm3 in the year of 1998 and expected to increase to about 20 Mm3 and 35 Mm3 for the years of 2005, and 2015 respectively [7].
The Automated Geospatial Watershed Assessment Tool

Figure 1. Gaza Strip map.

Figure 2. Watersheds of extended through the region of the Gaza Strip.
(AGWA) is a GIS based watershed modeling tool. AGWA was developed as a multipurpose hydrologic analysis system for use by watershed (semi-arid watershed), water resource, land use, and natural resource managers and scientists for developing watershed and basin-scale studies. AGWA prepares input files for the models using standardized spatially-distributed datasets such as elevation, soils, and land cover data. AGWA is an extension for the Environmental Systems Research Institute’s (ESRI) ArcGIS versions 9.X (ESRI, 2009), a widely used and relatively inexpensive Personal Computer (PC)- based GIS software package. AGWA was developed under the following guidelines: 1) its parameterization routines are simple, direct, transparent, and repeatable; 2) it is compatible with commonly available GIS data layers, and 3) it is useful for assessment and scenario development (alternative futures) at multiple scales. There are six major steps involved in AGWA analysis: 1) watershed delineation; 2) parameter estimation; 3) rainfall generation; 4) model execution; 5) change analysis; and 6) visualization of results [8].
The primary distribution method for AGWA is via the Internet as a free, modular, open-source suite of programs (www.tucson.ars.ag.gov/agwa or www.epa.gov/ nerlesd1/land-sci/agwa/). Under the modeling environment (AGWA), Kepner et al., (2004) studied The San Pedro River in Arizona and Sonora using SWAT model.
There study defined future scenarios, in the form of landuse/land-cover grids, were examined relative to their impact on surface-water conditions [9]. Miller et al., (2006) studied general application in details of AGWA. AGWA provides the functionality to conduct all phases of a watershed assessment for SWAT and KINEROS2. SWAT2000 is the current version of SWAT and is a continuous-simulation model for use in large (river-basin scale) watersheds. KINEROS2 is an event-driven model designed for watersheds characterized by predominantly overland flow [10]. The AGWA tool combines these models in an intuitive interface for performing multiscale change assessment, and provides the user with consistent, reproducible results. Tripathi et al. (2004) applied (SWAT) model to the runoff and sediment yield of a small agricultural watershed in eastern India using generated rainfall [11].
In this paper, a hydrological modeling has been performed using modeling environment AGWA and SWAT model to evaluate land-use change on the water budget of the Gaza Strip.
2. Data Collection and Preparation
AGWA tool requires four basic files to run the tool successfully, these files are Digital Elevation Model (DEM), Land Cover map, Soils map and Climate Information which shown in Figures 3-5 and Table 1 respectively.
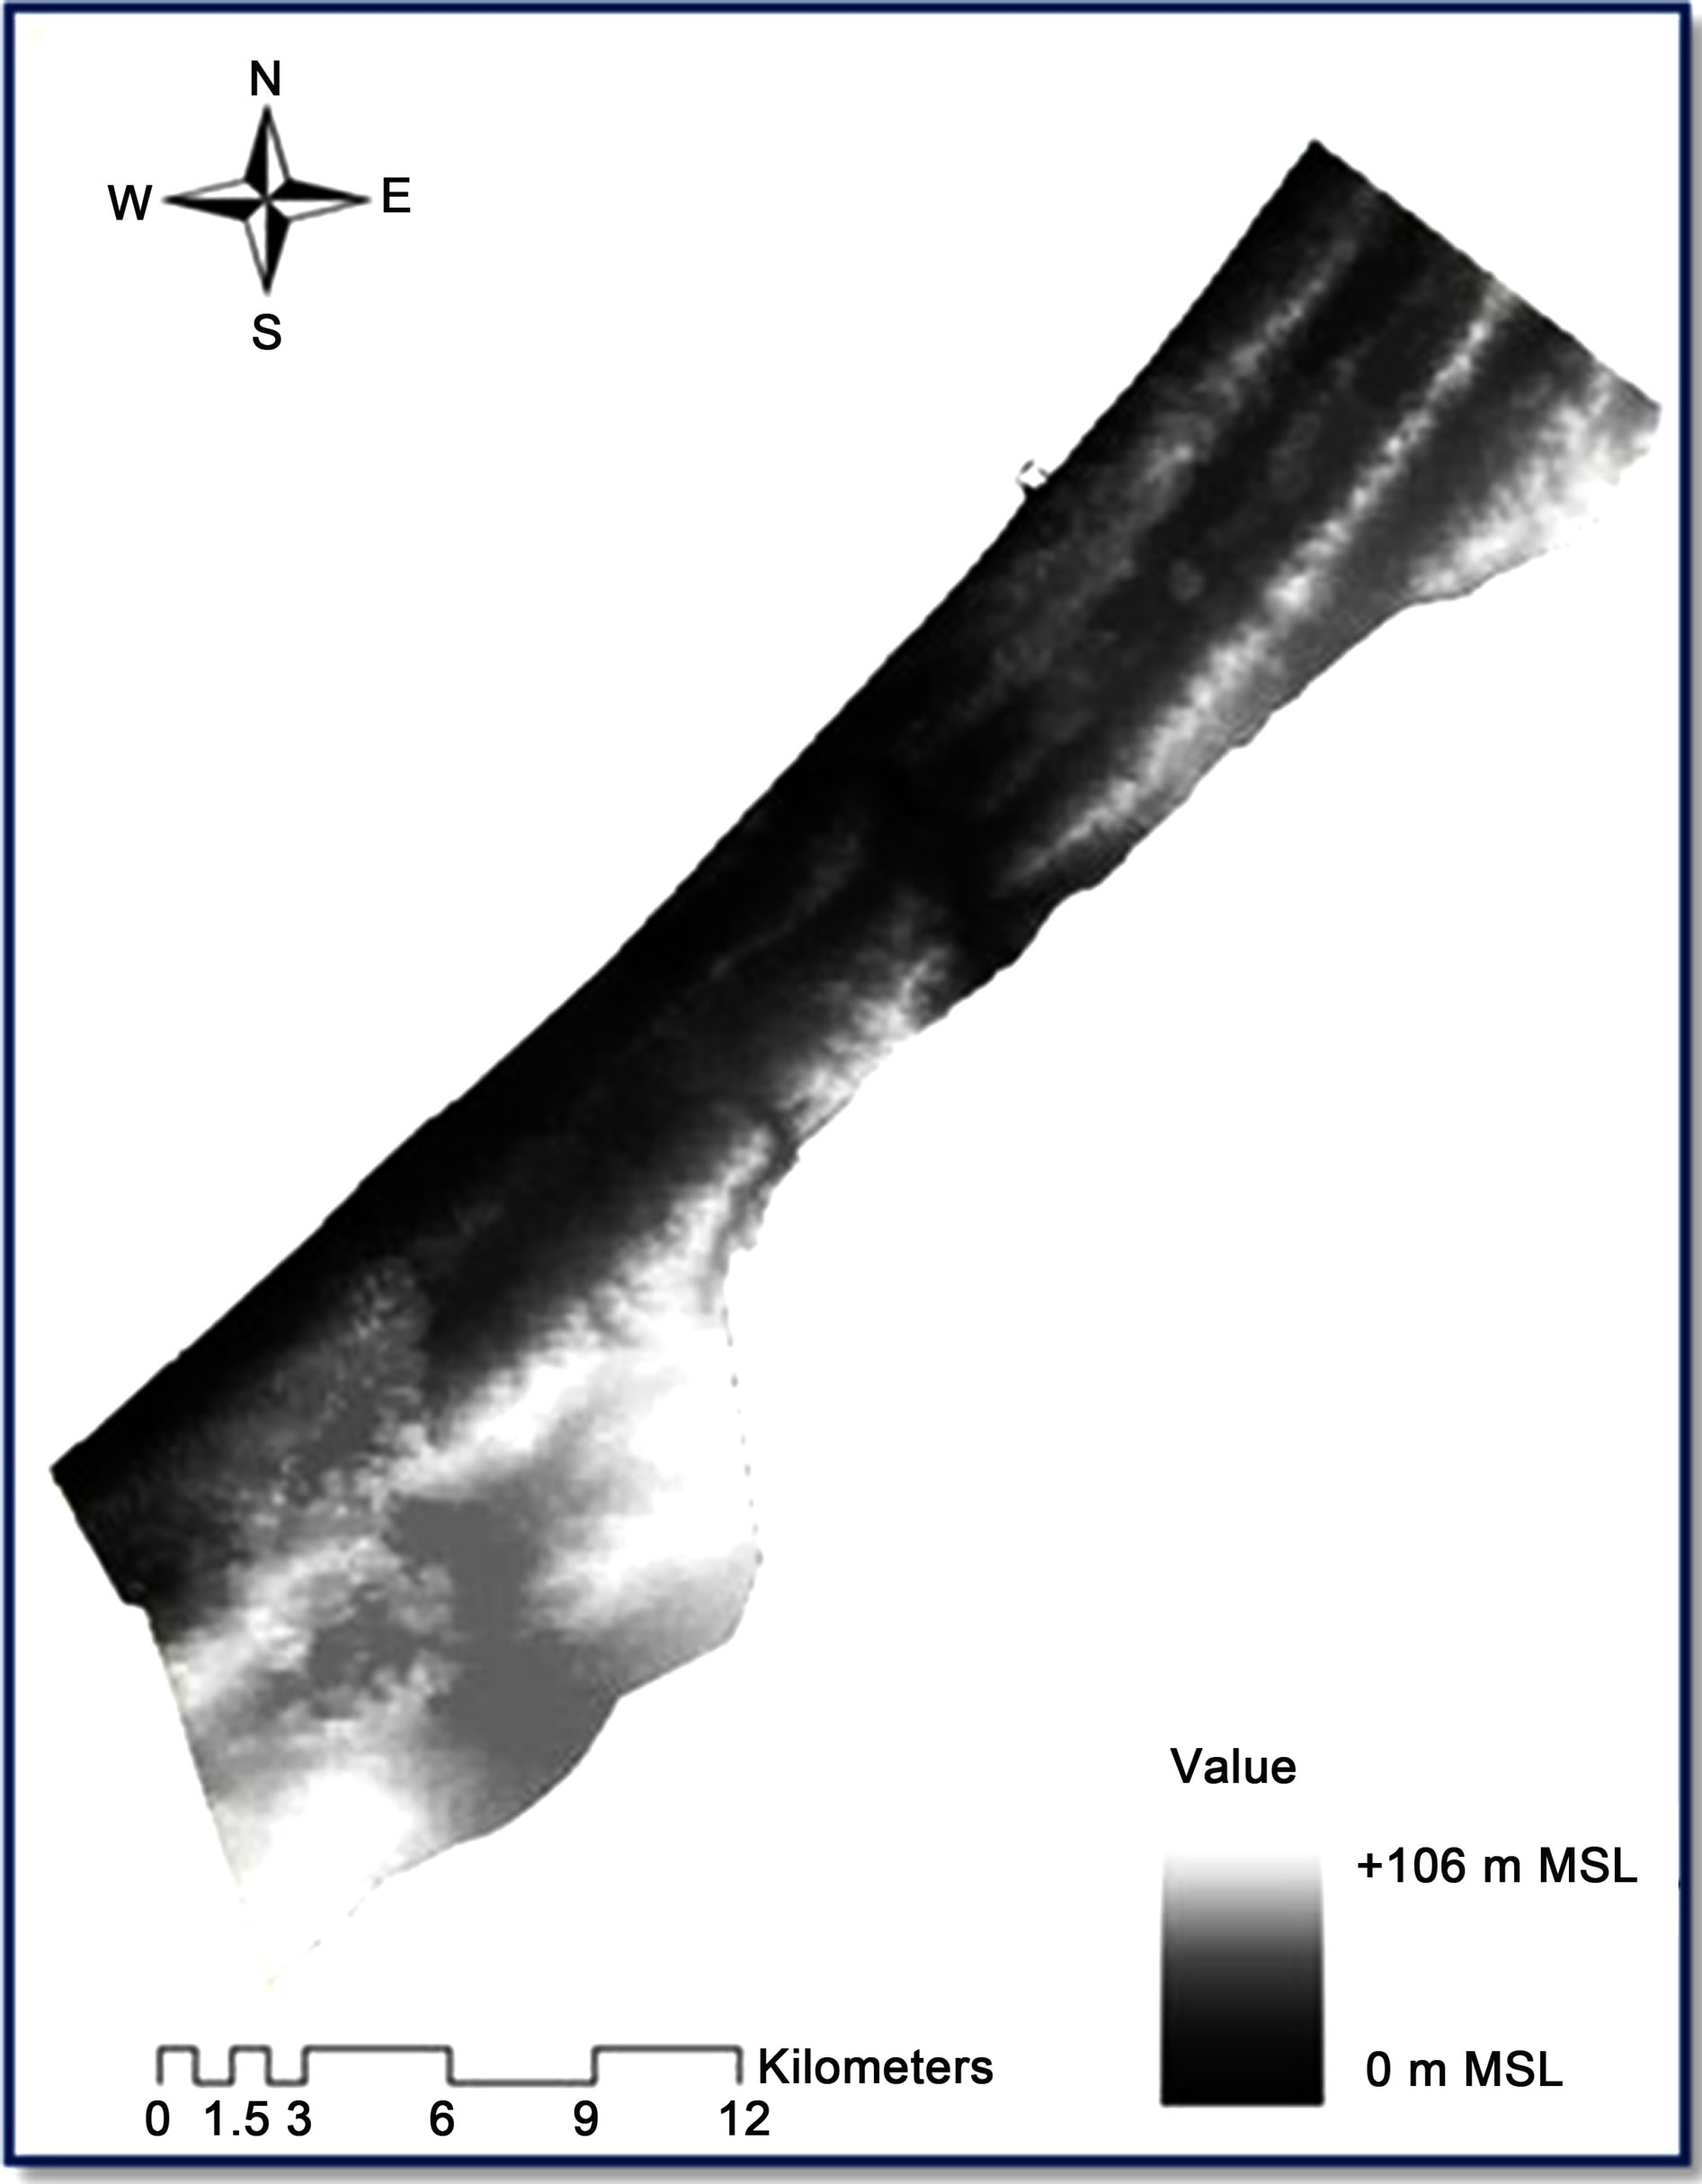
Figure 3. Digital elevation map (DEM) of the Gaza Strip [12].

Figure 4. Soil map of Gaza Strip [13].
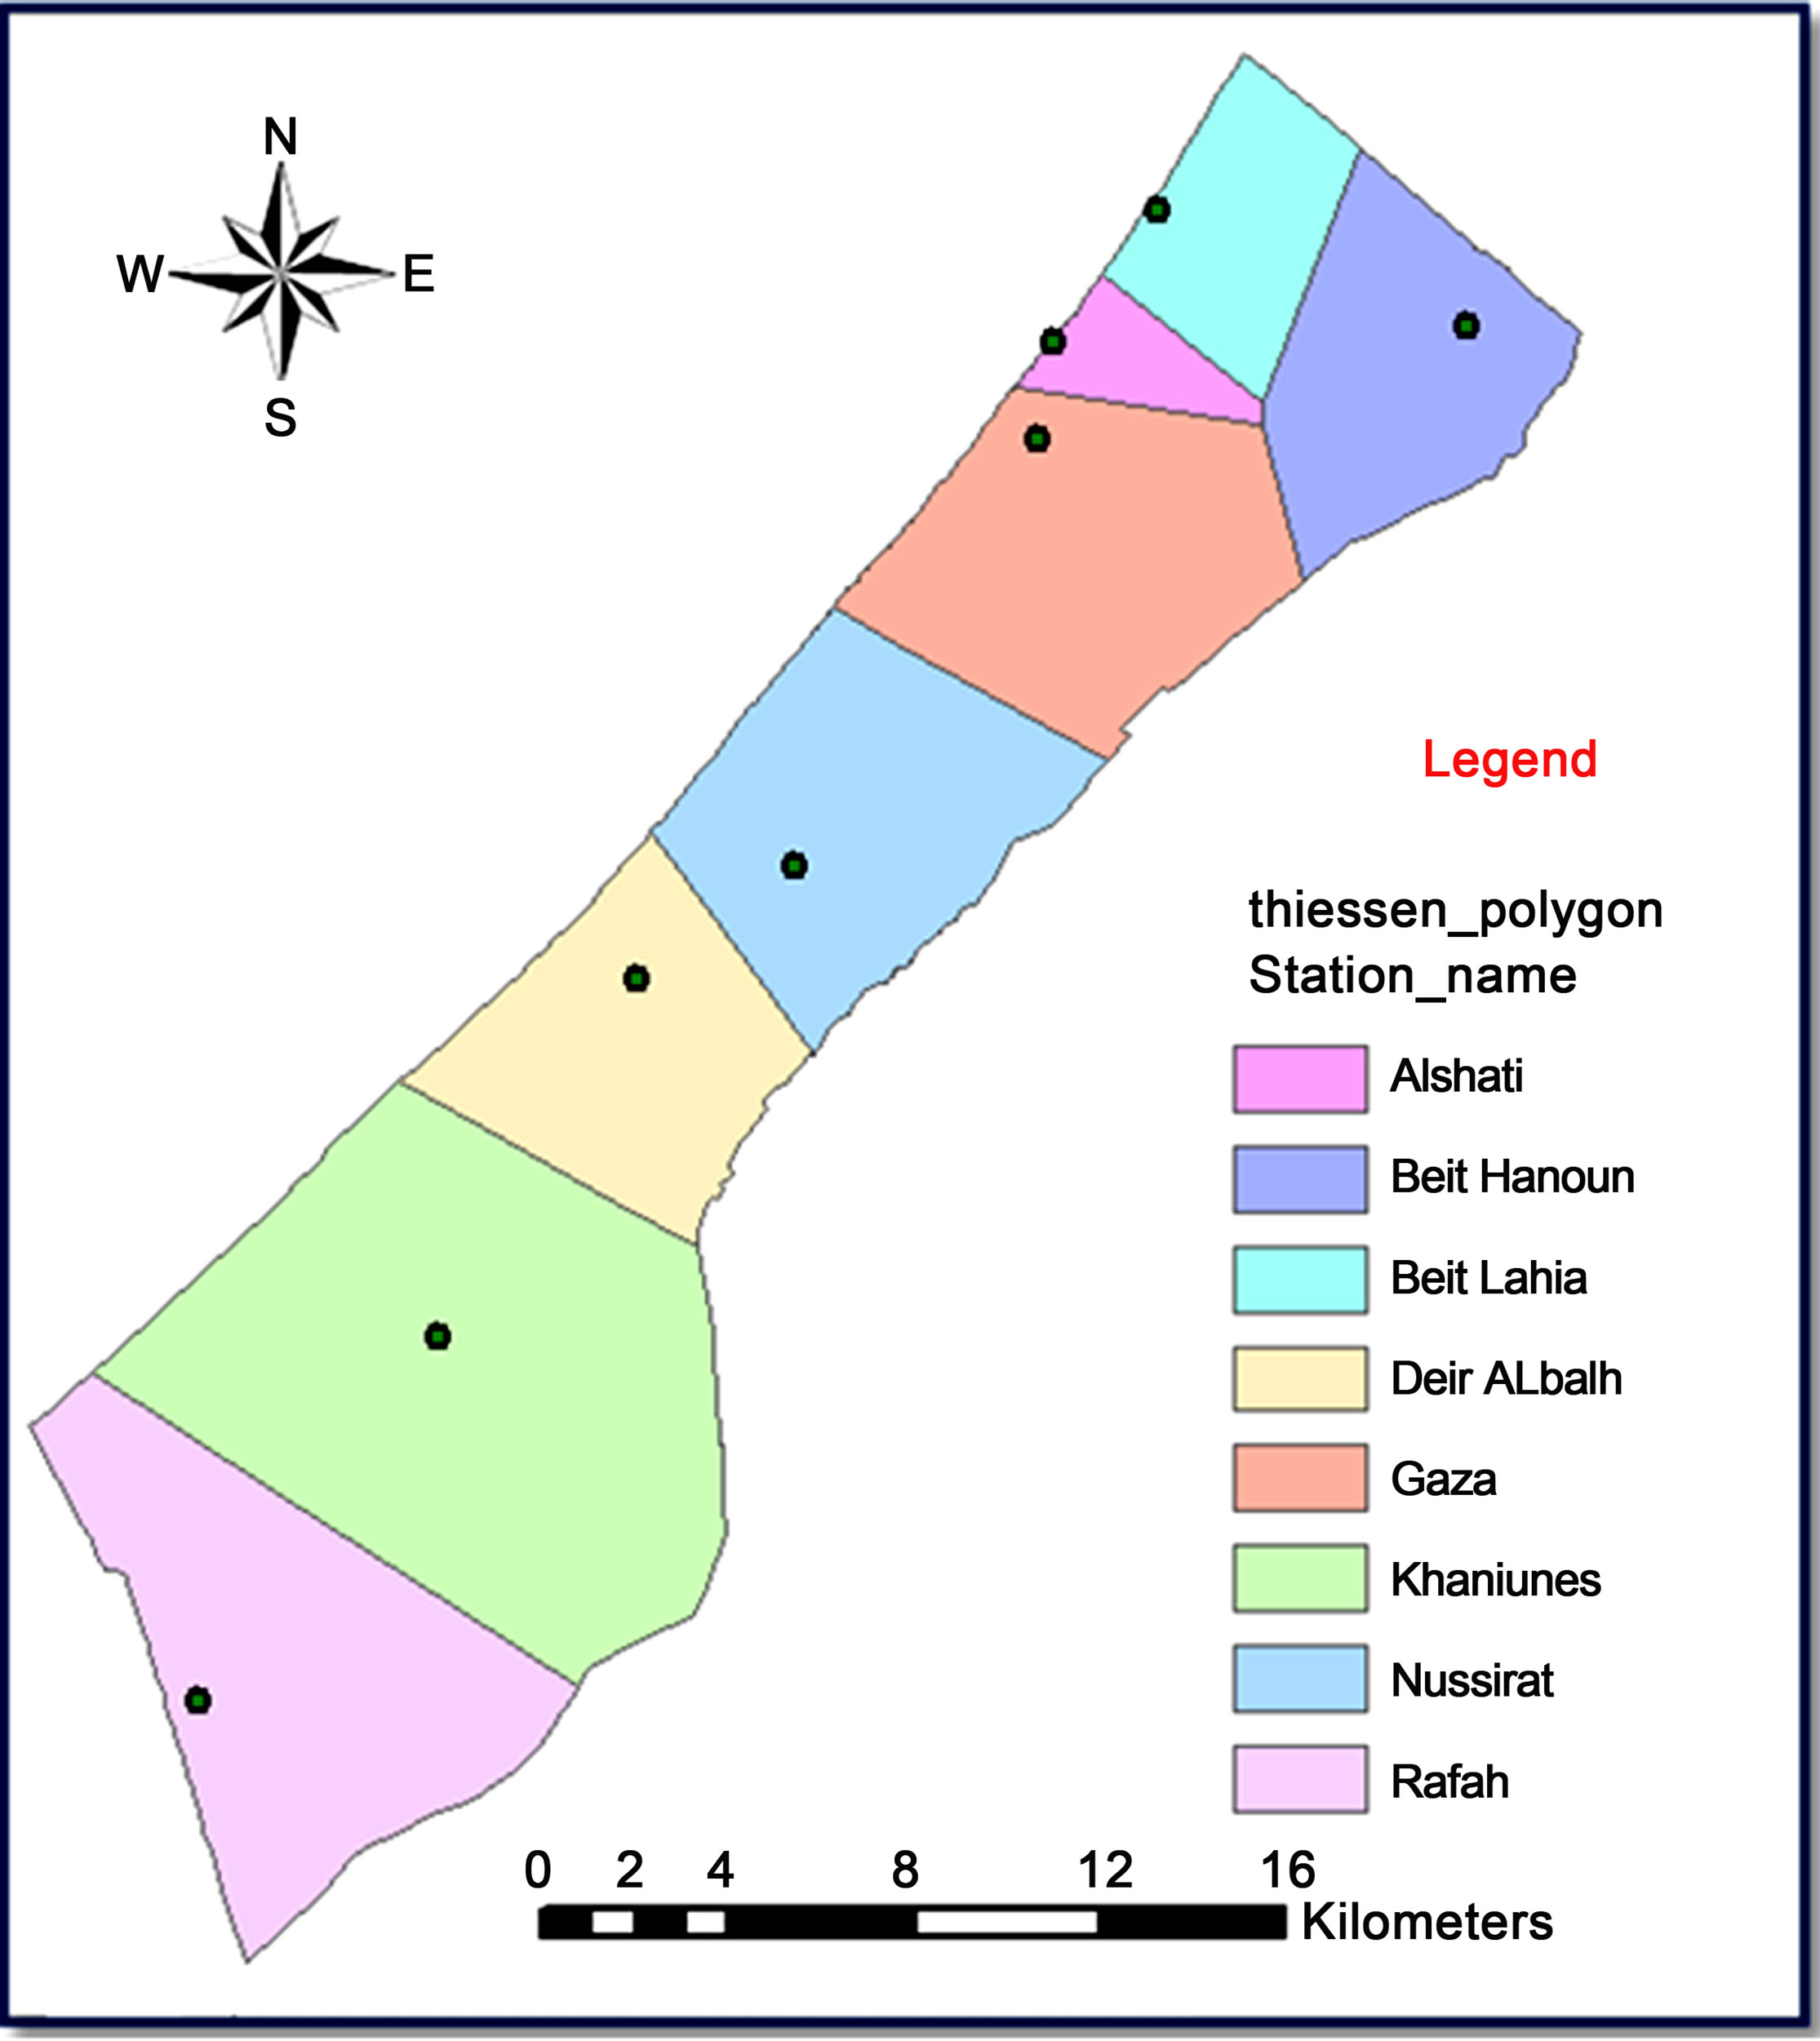
Figure 5. Rainfall stations of Gaza Strip [14].
NASA web site publishes the digital elevation model map for the Gaza Strip which represents the ground surface topography or terrain in a resolution of 90 × 90 m, in *.ght format. The resolution was converted from 90m resolution to 30 m resolution using spatial analyst to fit AGWA requirement. The land cover of 2007 and land cover of 2020 of Gaza Strip, which are published by Ministry of planning, were used in this study and each map was classified into nine classes: Cultivated crops, airport, beach, greenhouses, residential areas (high intensity), open water, port, developed road and , barren land.
The input parameters of the land-use to AGWA are the curve numbers and the cover as a percentage of the landuse area.
Table 2 shows the land-use parameters for the Gaza Strip classified according to the hydrological soil groups (A, B, C, and D).
The soil map of the Gaza Strip was classified into six soil texture according to the percentage of sand, silt, and clay. Saturated hydraulic conductivity (mm/hr) Ks, Available water capacity SAWC (mm H2O/mm soil), Moist bulk density (g/cm3) BD, Depth from soil surface to bottom of layer Soil-Z (mm) and Maximum rooting depth in soil SOLZMX (mm) for these six soil texture are listed in Table 3.
Meteorological input is based on the record for the period from 1980 to 2010 from 8 rainfall stations distributed throughout the Gaza Strip as shown in Figure 5. Historic averages of key climatic parameters presented in Table 1 were used in weather generator input (WGN) file to generate representative daily climate data for the sub basins.

Table 1. Climatic parameters [15].
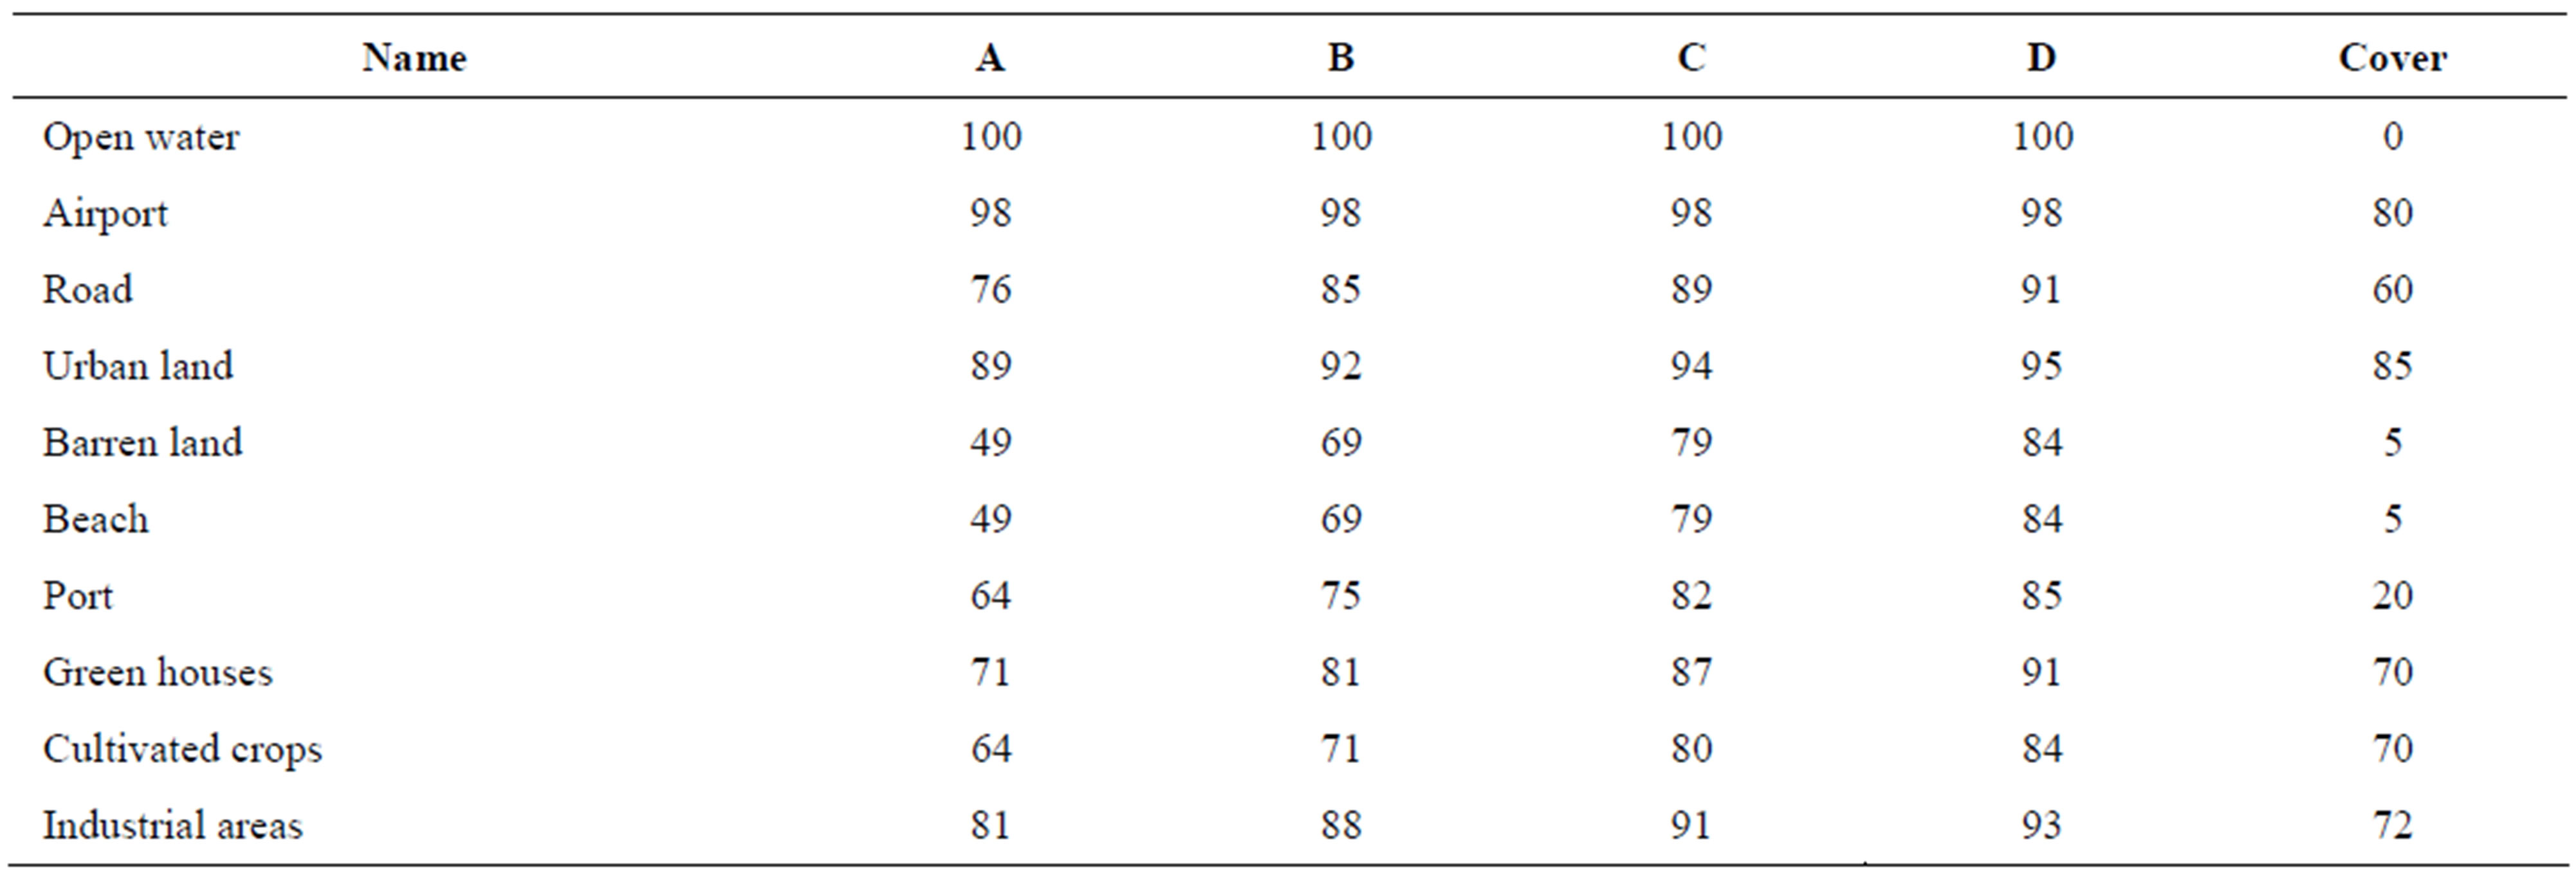
Table 2. Land use parameters for the Gaza Strip [16].
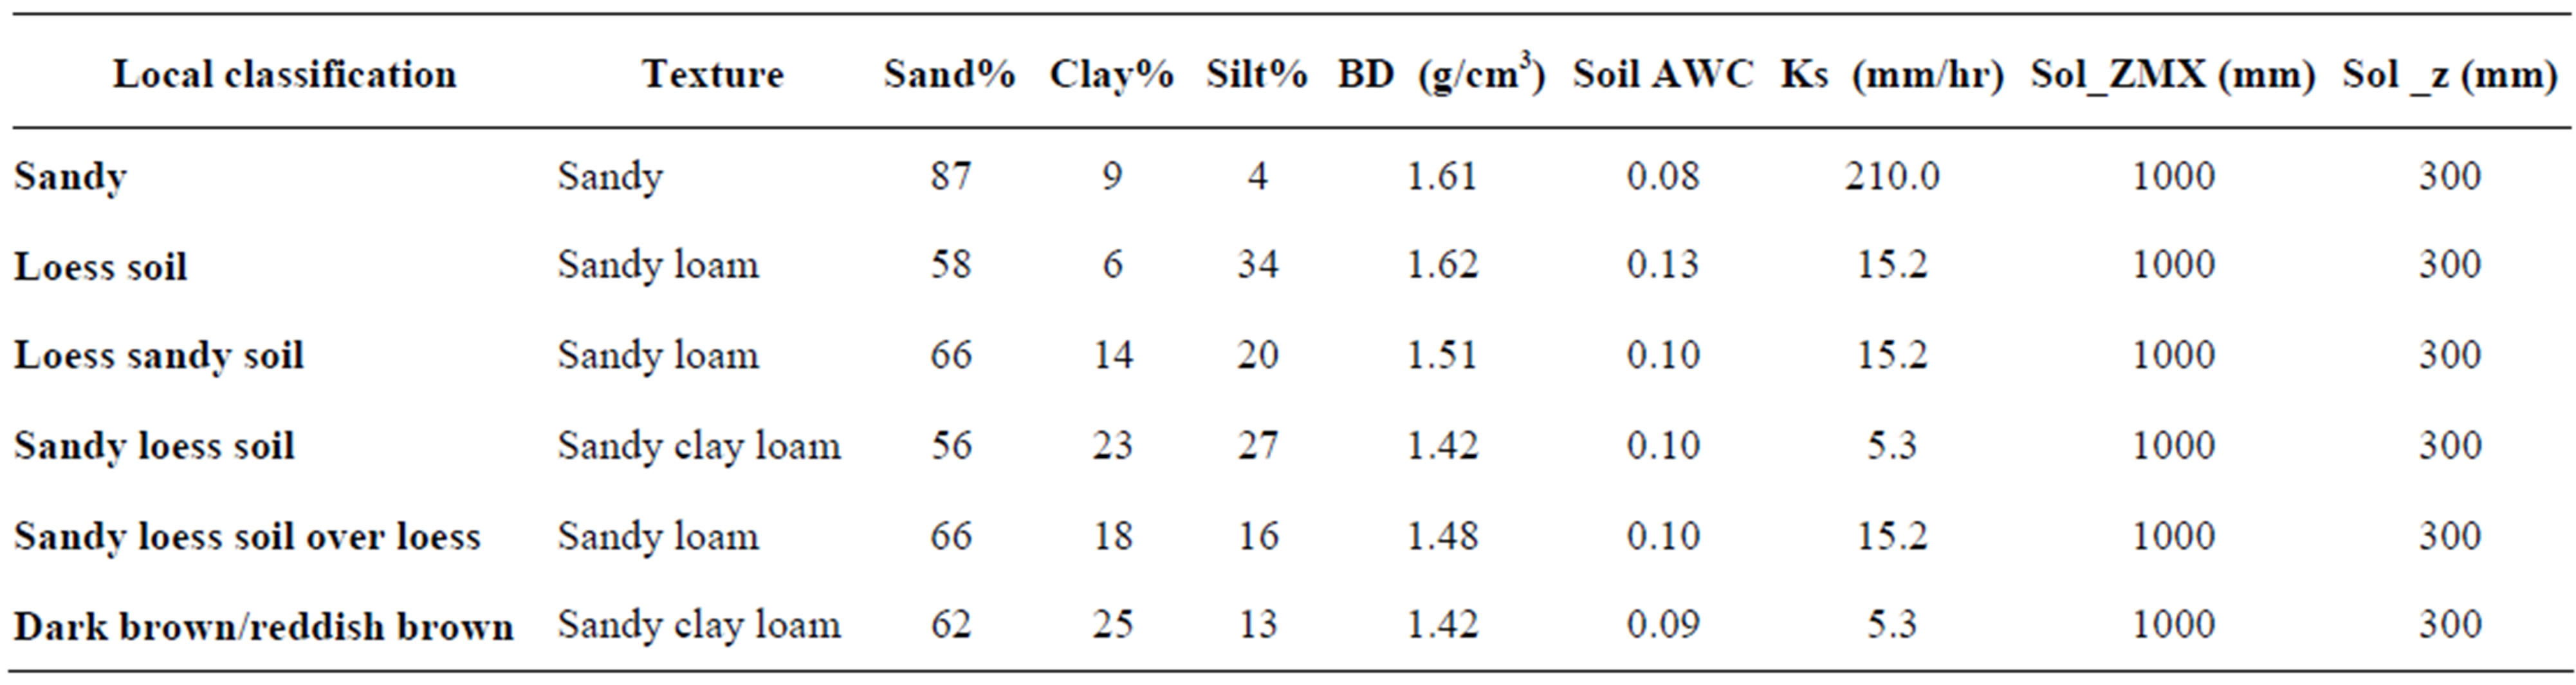
Table 3. Soil parameters for Gaza Strip [17].
3. Watersheds Modeling
The Automated Geospatial Watershed Assessment (AGWA) tool was used to build input parameter files for the Soil and Water Assessment Tool (SWAT). Three different land cover scenarios Land cover of 2007, land cover of 2020, and full urbanization land cover as shown in Figure 6, were used to parameterize the watershed independently, and runoff was generated for 31 years of continuous simulation for the watersheds group in the study area. The same soil and rainfall data were used as input to each of the three simulation runs, so all changes in the runoff can be traced solely to changes in land cover. [18].
AGWA delineated Gaza Strip region into small subbasins to get a higher accuracy in the model result which shown in Figure 7. AGWA made a digitizing stream depend on DEM map. There is no continuity of surface water between Gaza region and the region outside it due to the Israeli dams. In the light of this fact, The natural extension of these sub-basins through the region outside Gaza region was neglected.
In the delineation process, a database file was improved for sub-basins, contains information such as area, slope, elevation, and maximum flow length. Other database file was improved for streams, contains information such as stream length, slope, width, depth and cumulative area. AGWA prepared an input file to SWAT model based on Land use map and Soil data map.
The model was validated by comparing the estimated percolation by the AGWA in 2007/2008 with the corresponding value published by Palestinian Water Authority (PWA). The percolation value estimated by AGWA was 46MCM which was very close to the value credited by PWA (45 MCM).
4. Results
Surface runoff, channel discharge, percolation, and evapotranspiration were simulated using the SWAT model within AGWA for the three urbanization scenarios (2007, 2020, and full urbanization). Results from the simulation runs are given in Figures 8-12. The figures show the relative departure from the first scenario (land -use 2007) and illustrate the spatial variability of changes to the surface water hydrology. In general, the simulation results indicate that land-cover changes will significantly alter the hydrologic response of Gaza region. Figure 8 shows, in the baseline scenario (2007), the simulated percolation, evapotranspiration and surface runoff represent 41%, 47% and 12% respectively from the water budget components of the Gaza Strip. In year 2020, these values were expected by the simulation results to be 27%, 53%, and 20% respectively.
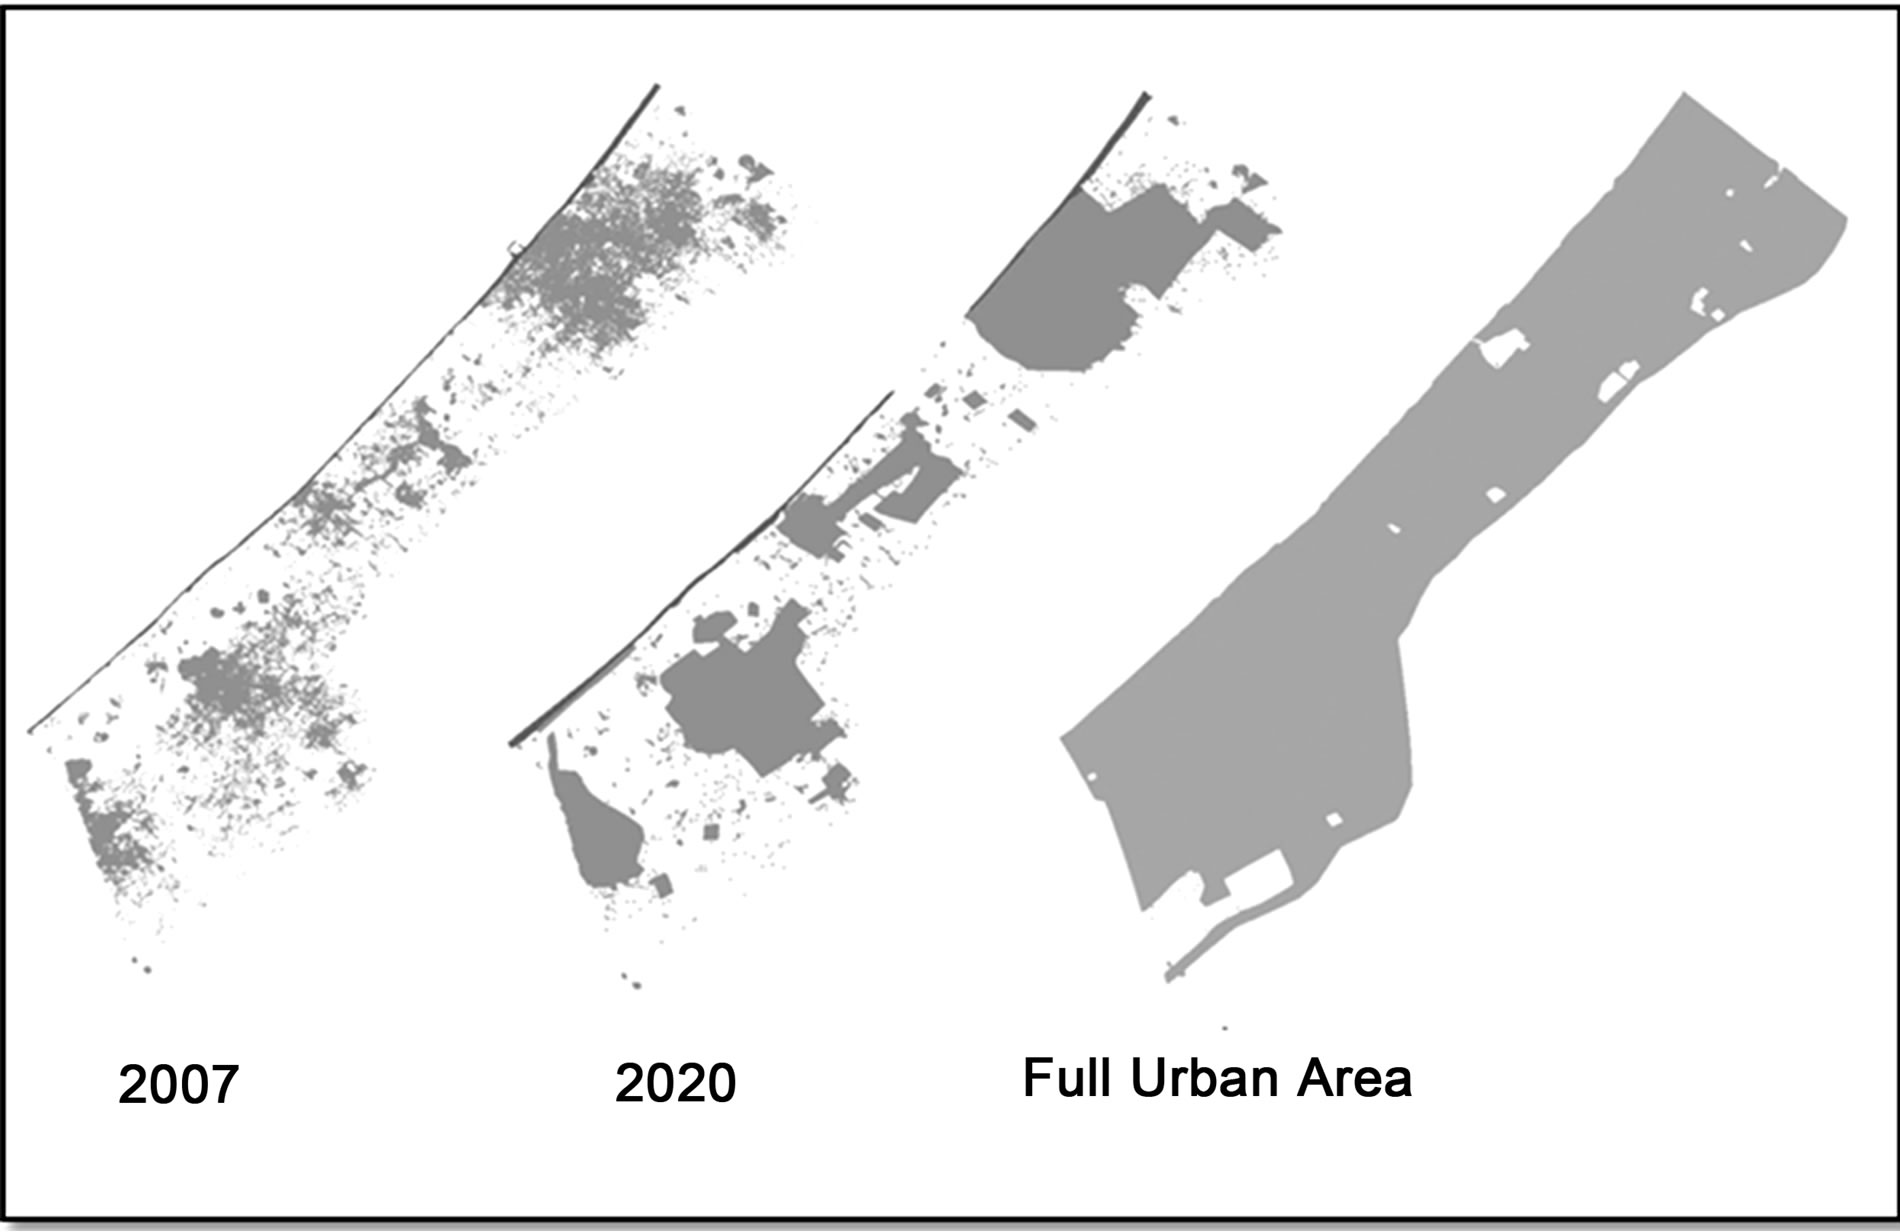
Figure 6. Urbanization scenarios [7].
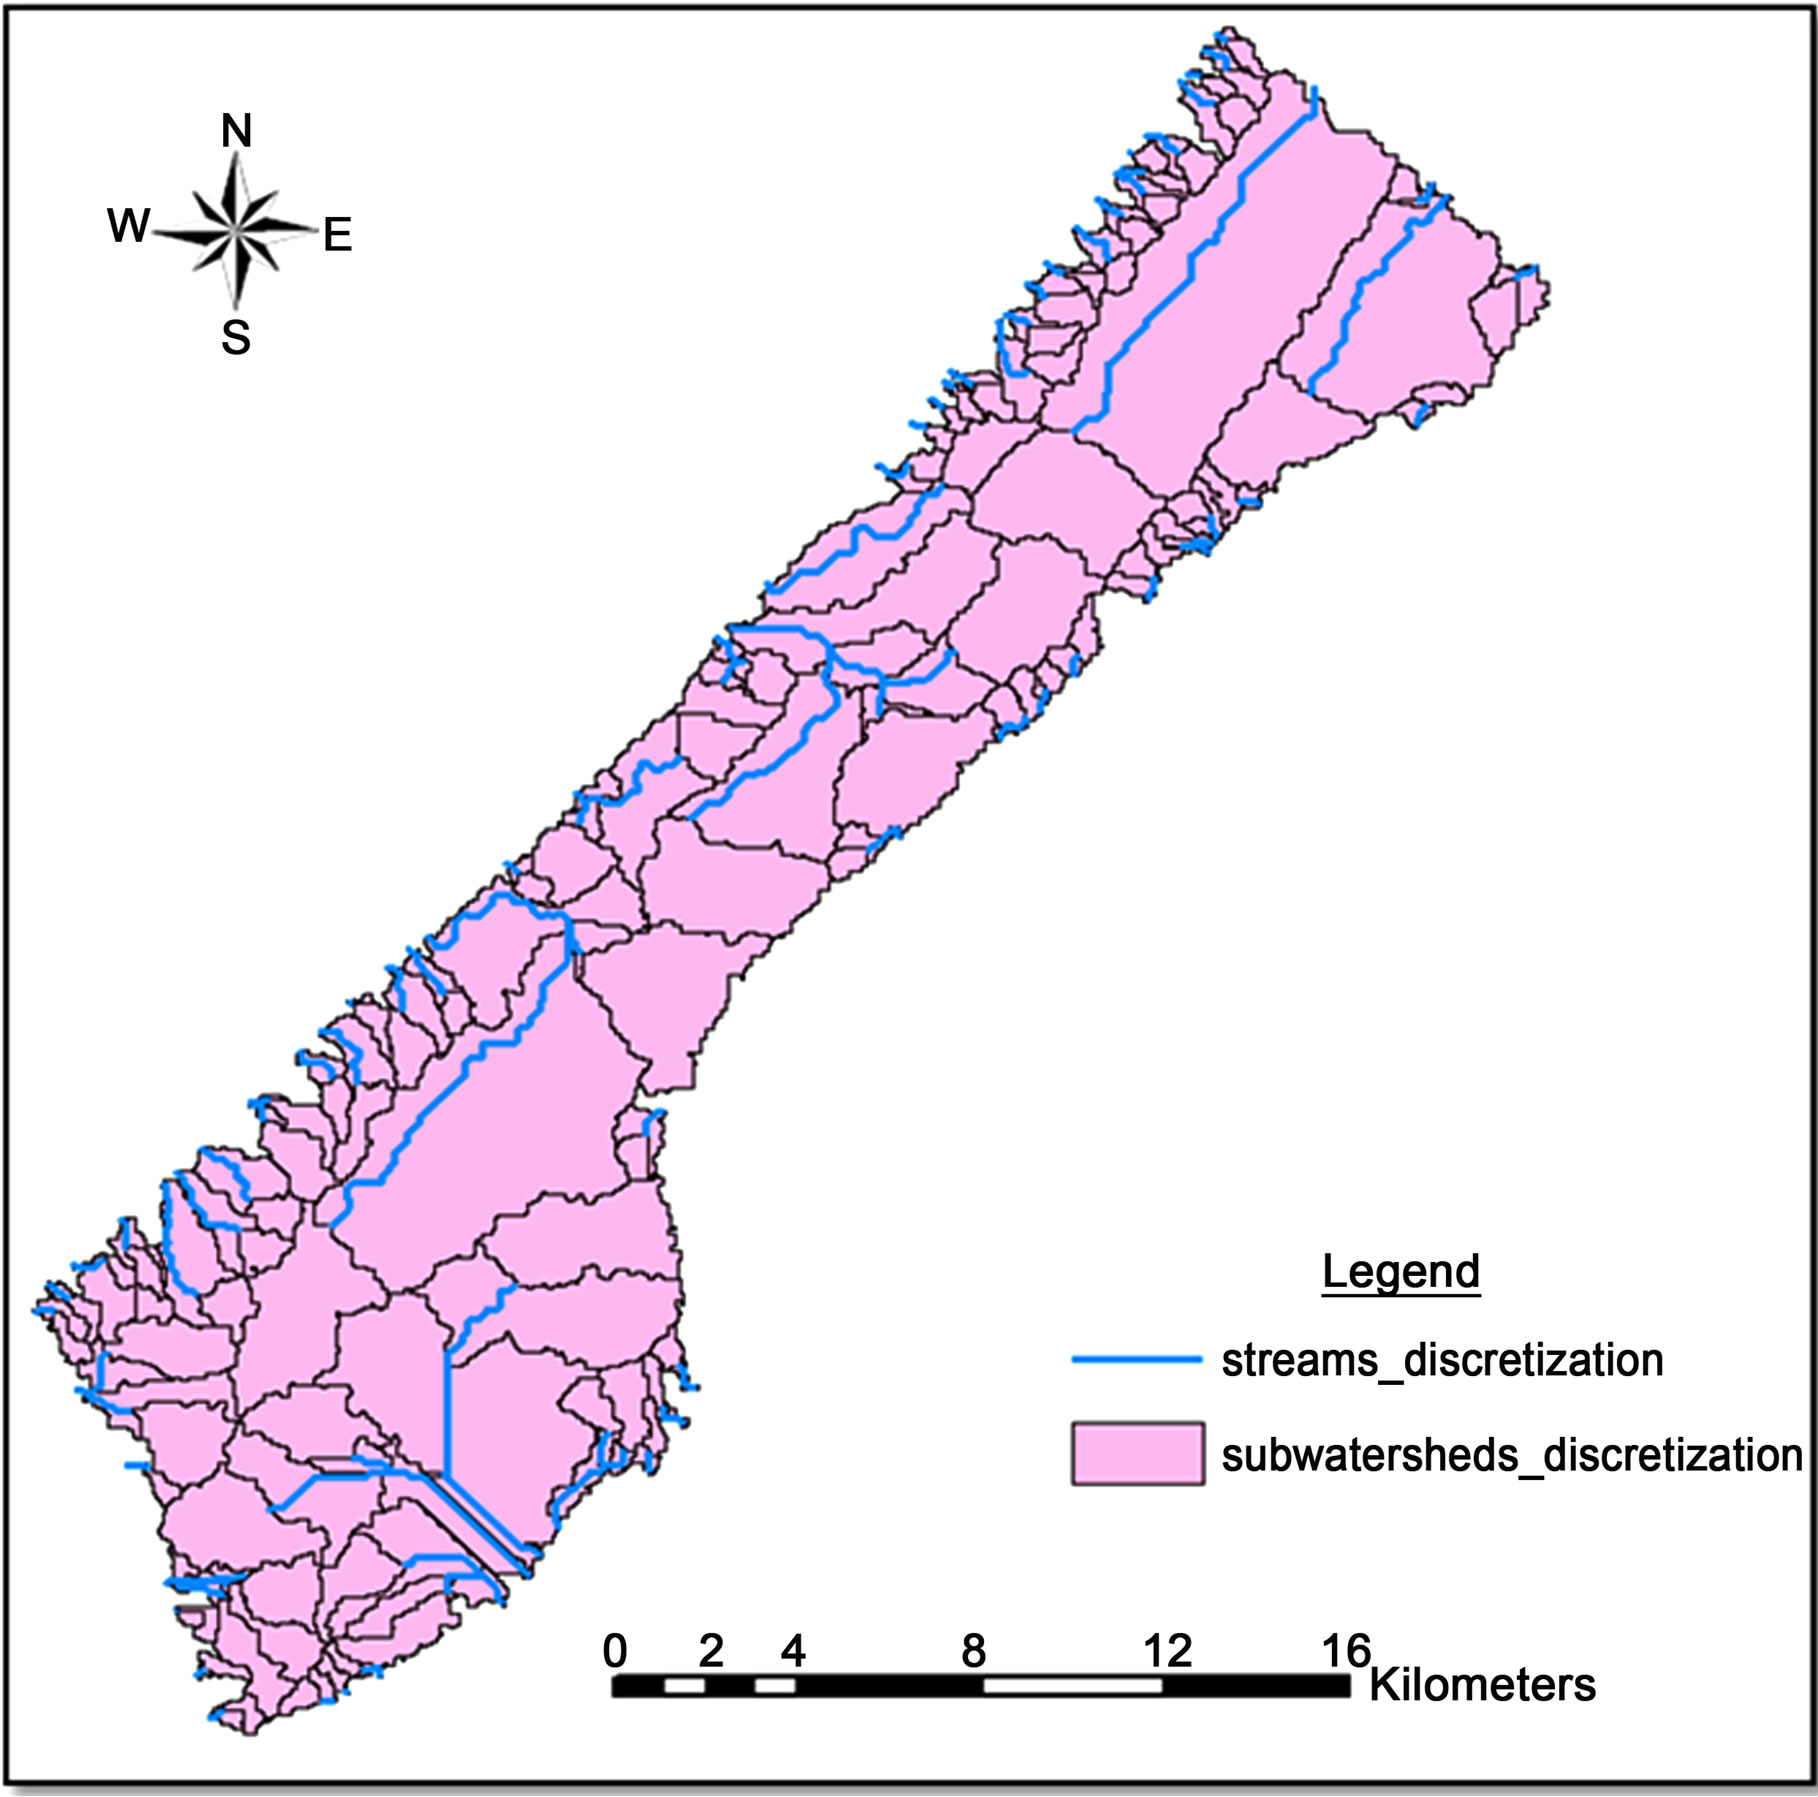
Figure 7. Sub-watershed delineation in Gaza region.

Figure 8. Scenarios and water budget components.
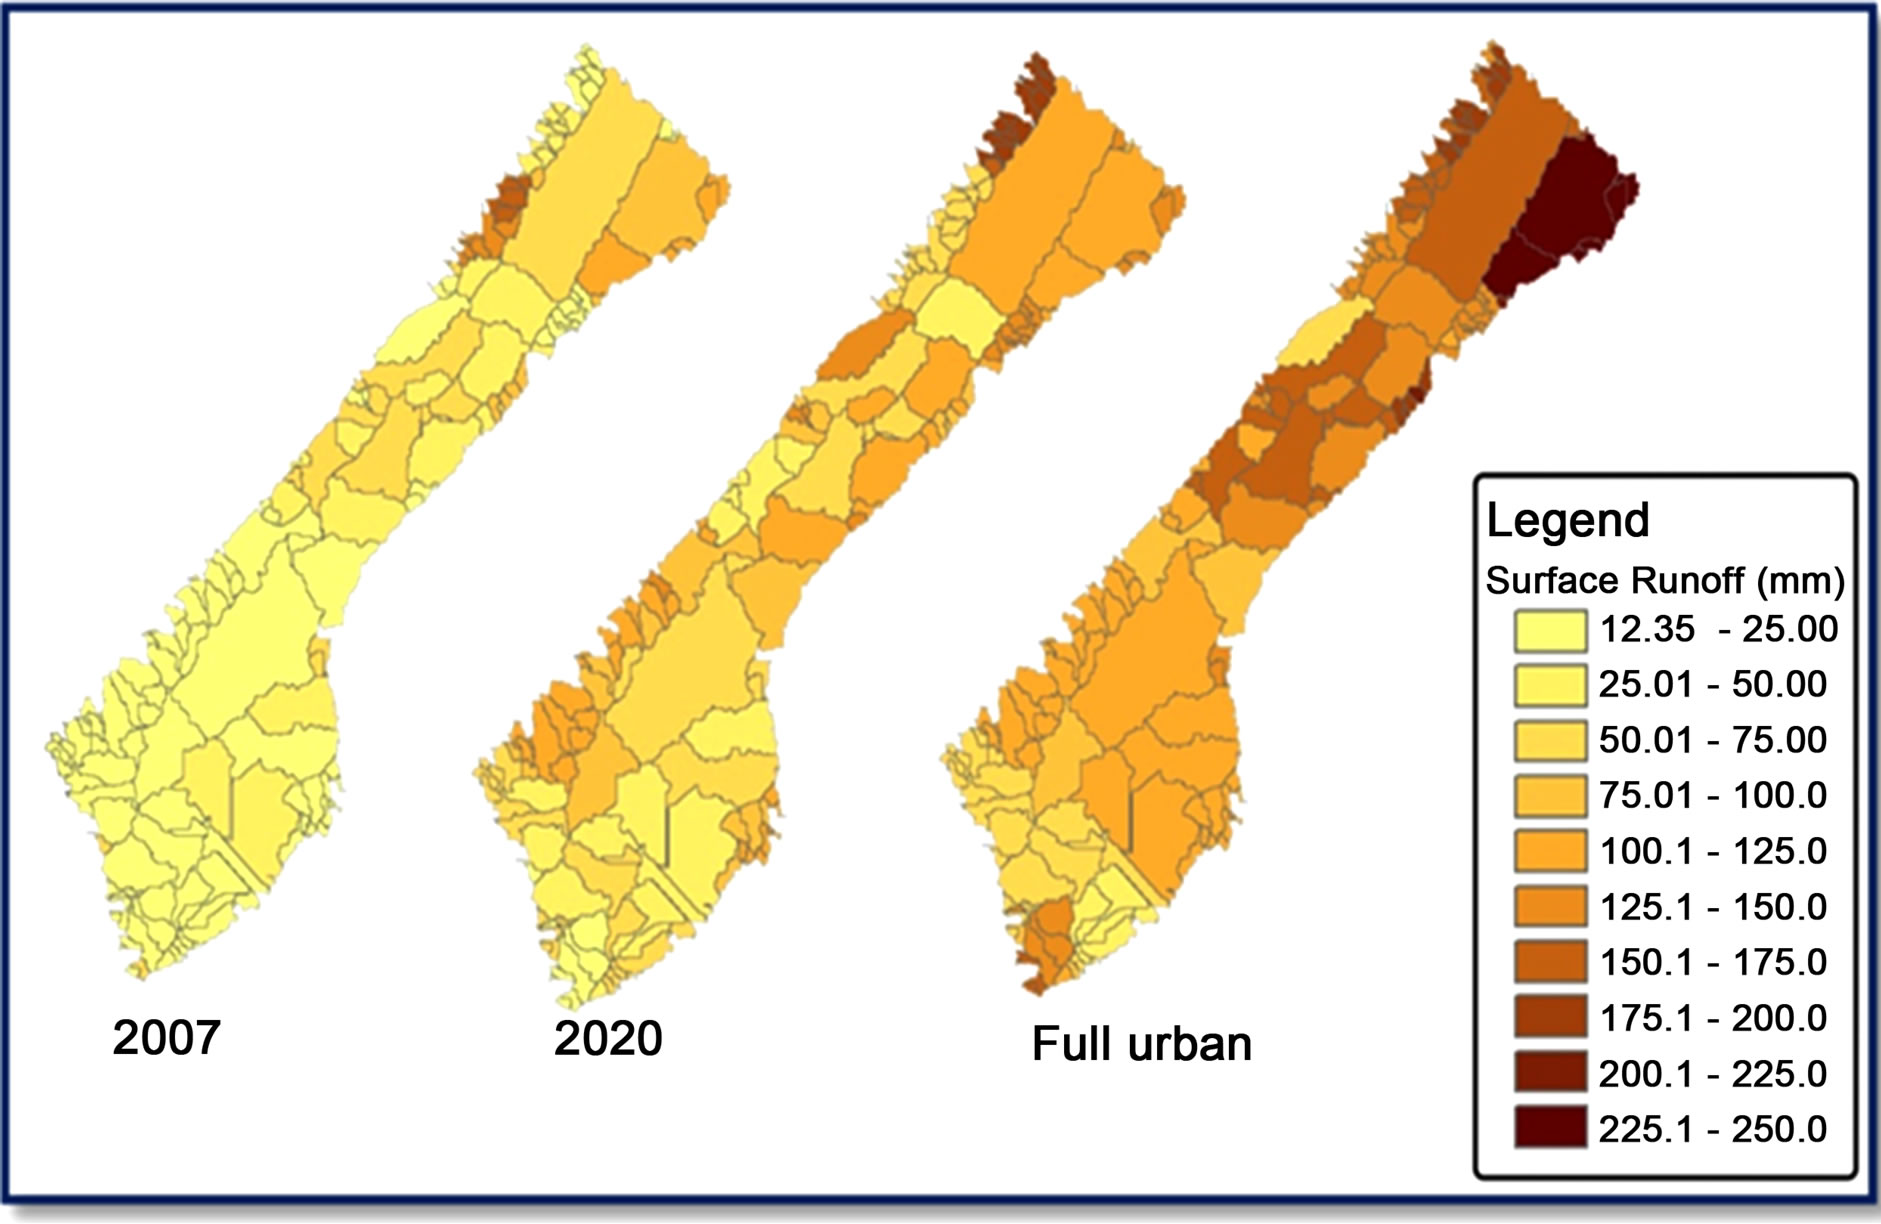
Figure 9. Surface runoff results of the different scenarios.

Figure 10. Channel discharge results of the different scenarios.
In the case of surface runoff as shown in Figure 9, the simulations show average increases from 37.1 mm in year 2007 to 63.2 mm in year 2020 whereas the full urbanization scenario shows 130mm as an average value of the surface runoff. The simulated channel discharge agrees closely with results for surface runoff. Figure 10 shows the simulated mean daily channel discharge for the three urbanization scenarios.
Percolation is a hydrologic measure of the water volume that is able to infiltrate into the soil past the root zone to recharge the shallow and/or deep water aquifers [18]. Figure 11 shows the simulated percolation for the three urbanization scenarios. Percolation is expected to decrease in all options as urban areas are expanded. The simulations record significant decreases in the average yearly percolation which are 126.5 mm, 82.4 mm, and 41.9 mm for the three scenarios (2007, 2020, and full urbanization) respectively.
Slight changes in the evapotranspiration quantities between the simulated scenarios are clear in Figure 12. The predicted average yearly evapotranspiration in the three scenarios (2007, 2020, and full urbanization) are 148.2 mm, 166.5 mm, and 141 mm respectively.
The increment of evapotranspiration from 148.2 mm in 2007 to 166.5 mm in 2020 is attributable to that the barren lands which were equal to 35.8 km2 in 2007 landcover as shown in Table 4 will be all turned to be agricultural areas in 2020 and these agricultural areas will increase the percent of interception and so the percent of evapotranspiration. While in the Full urbanized scenario and because all of the agricultural area will be converted to urban as shown in Table 4, the evapotranspiration will decrease to be 141 m.
According to Table 4, a unique linear relationship between the relative change in urban area and the corresponding relative change in surface water has been investigated in Figure 13. Therefore, it's expected that
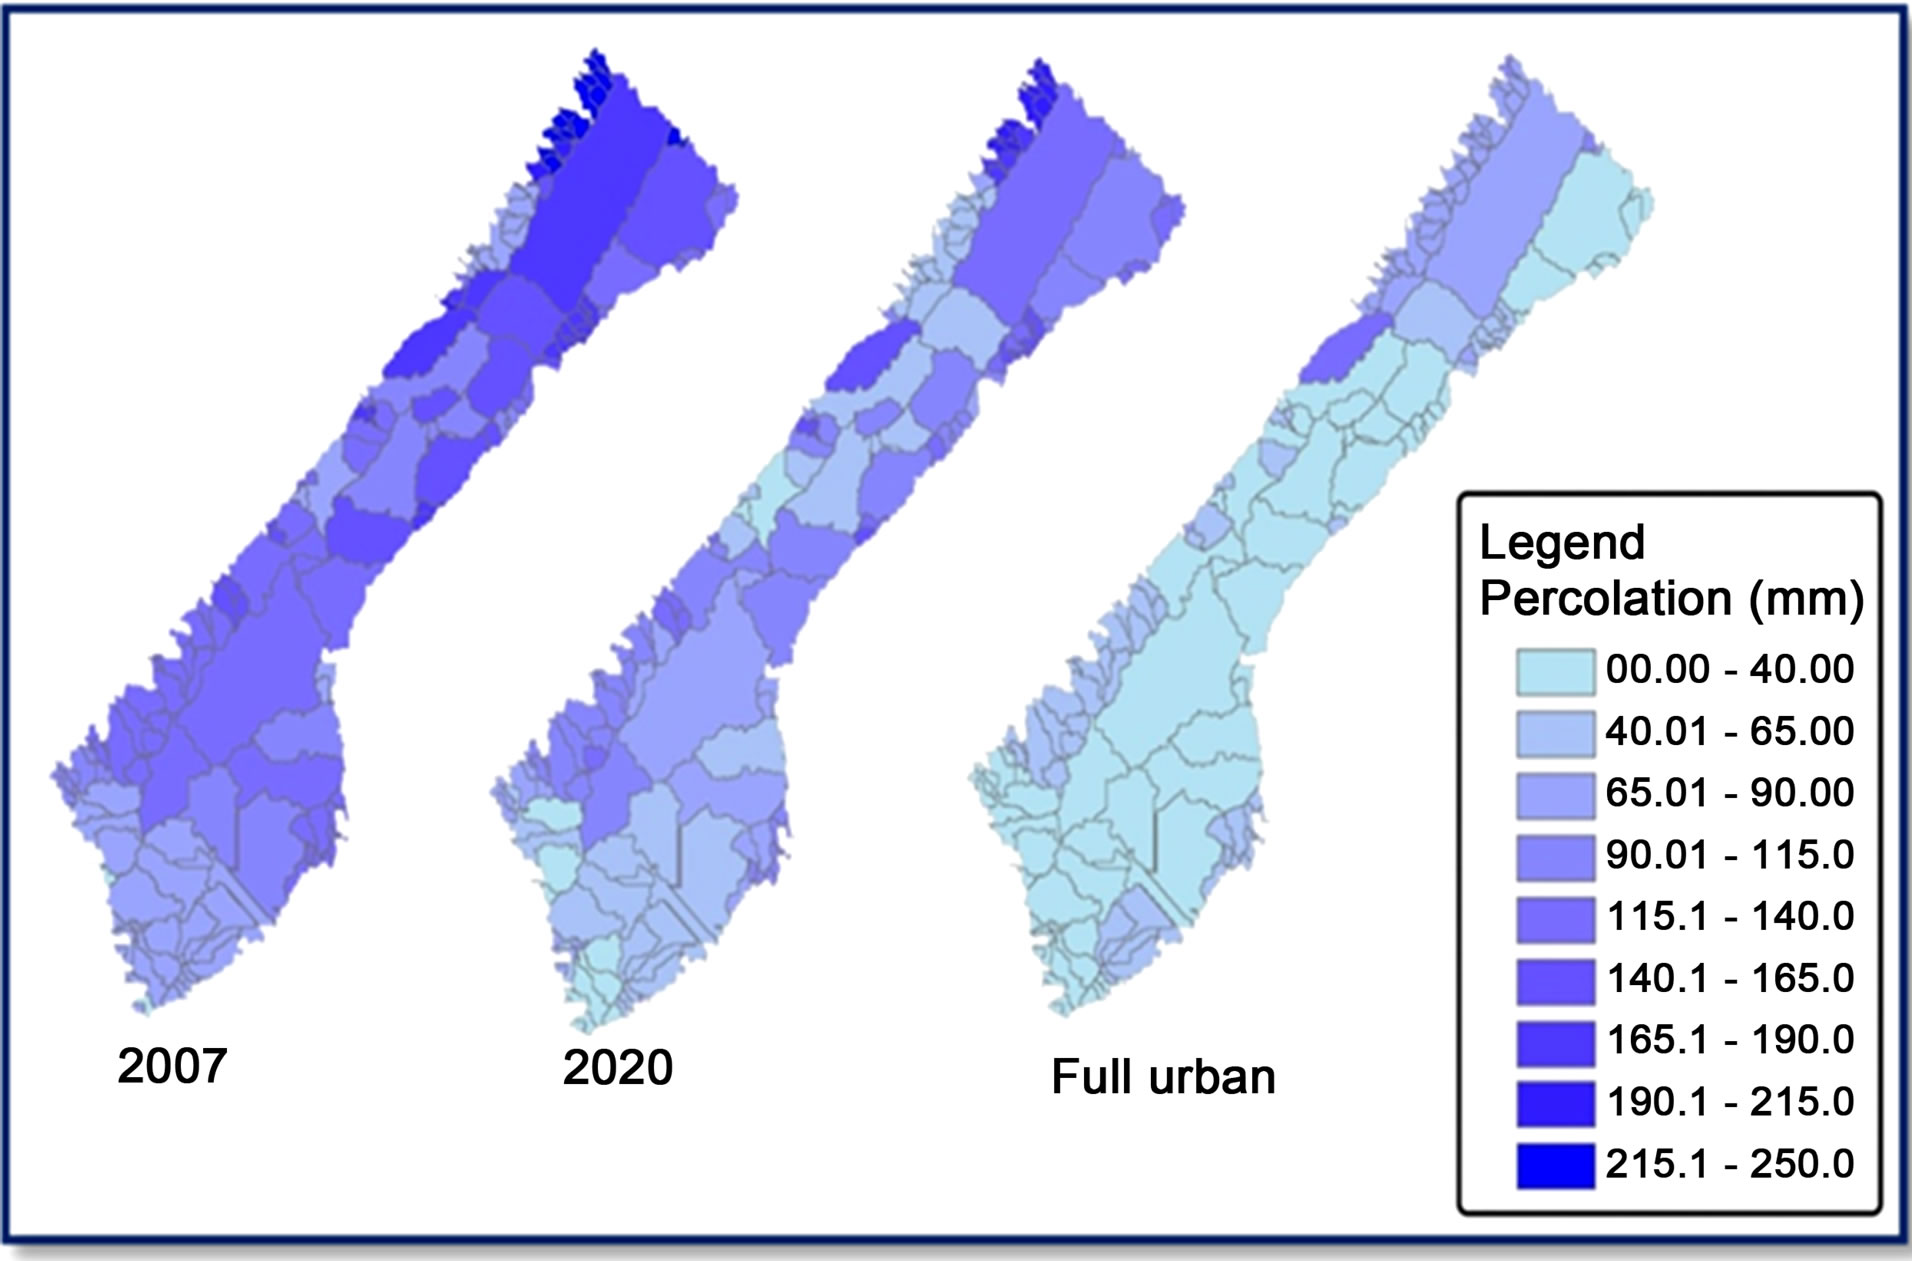
Figure 11. Percolation results of the different scenarios.
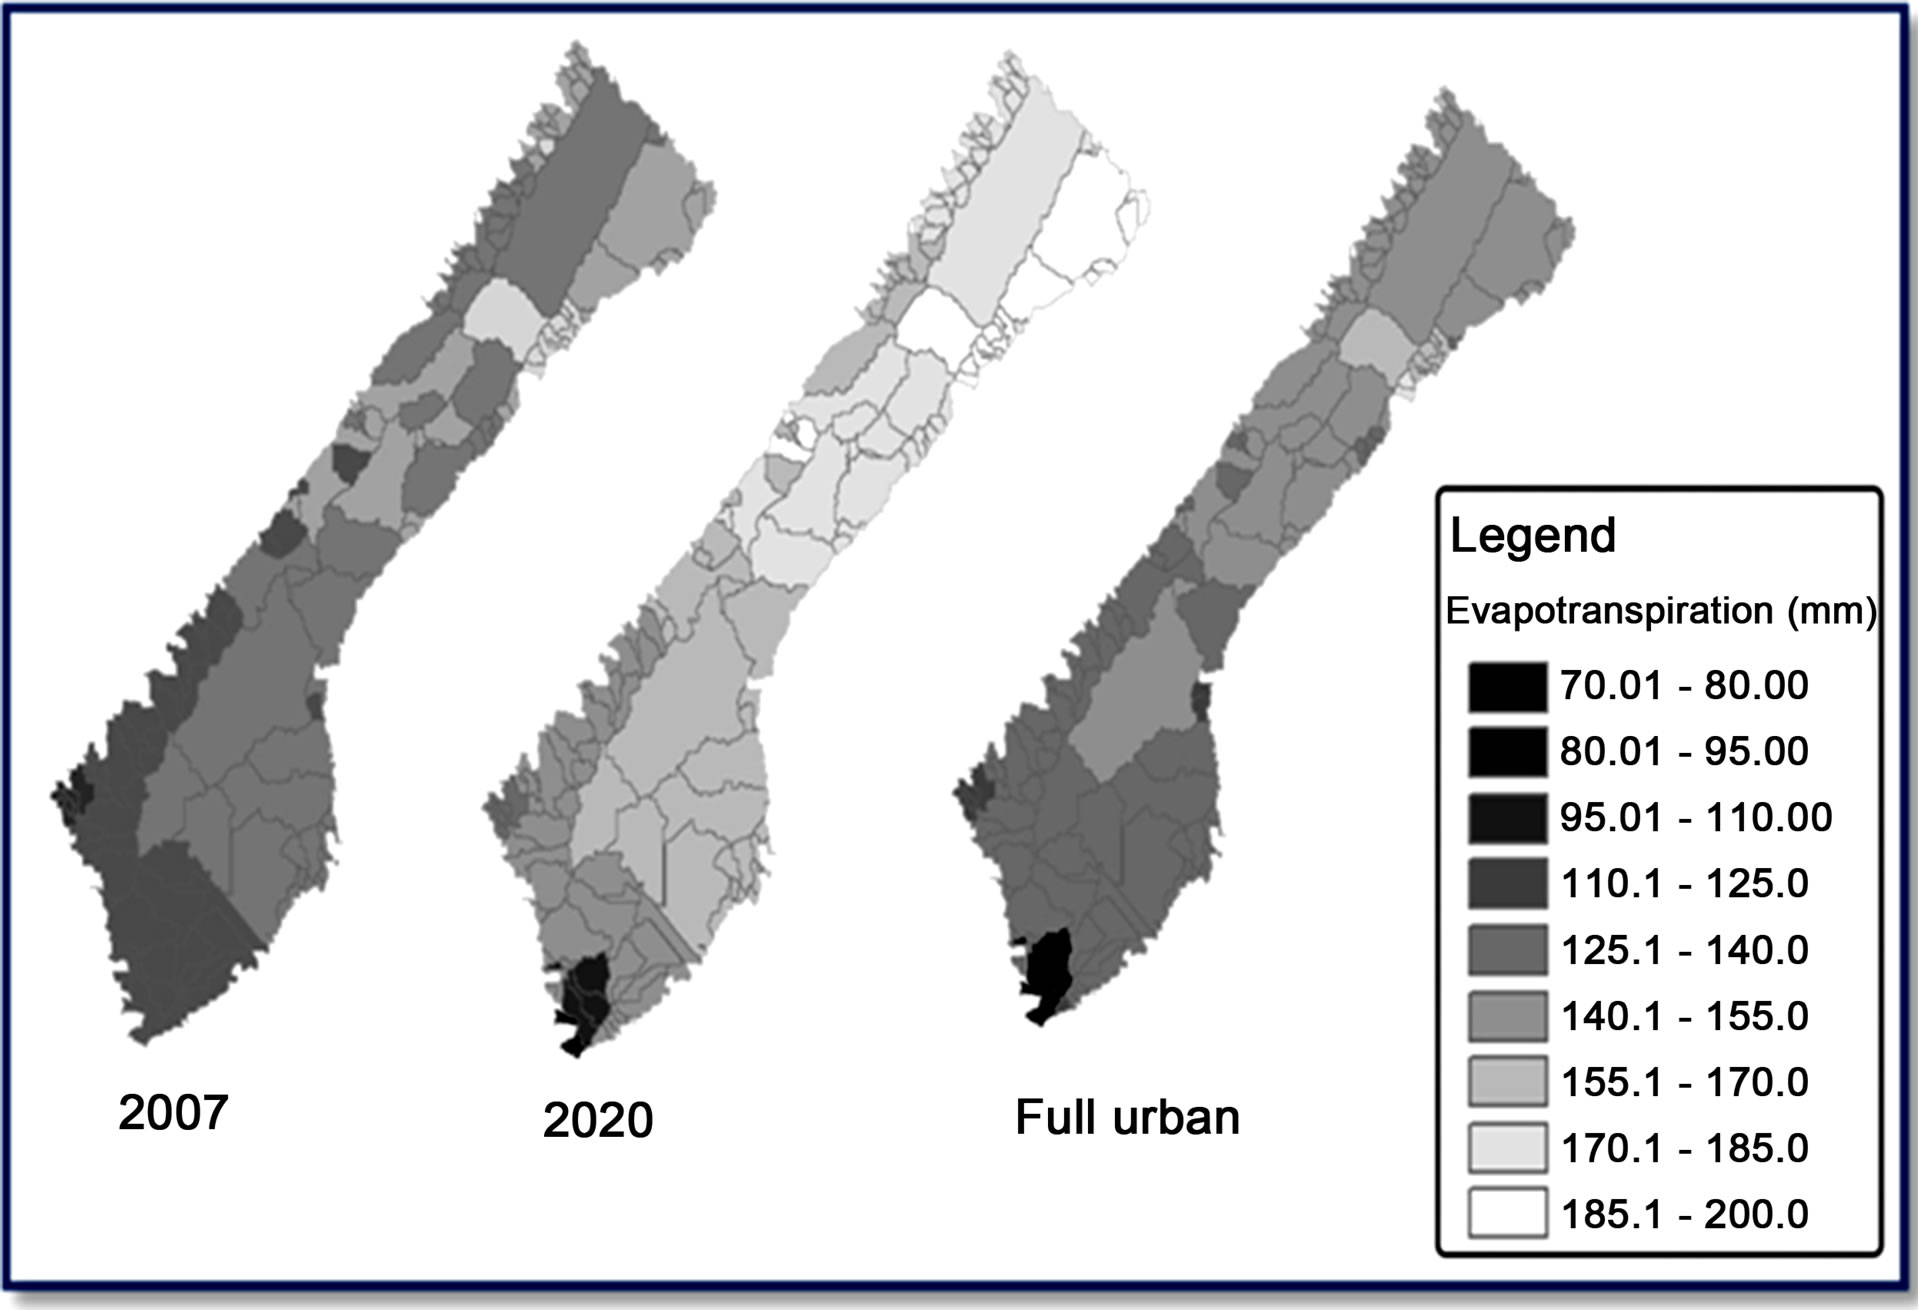
Figure 12. Evapotranspiration results of the different scenarios.
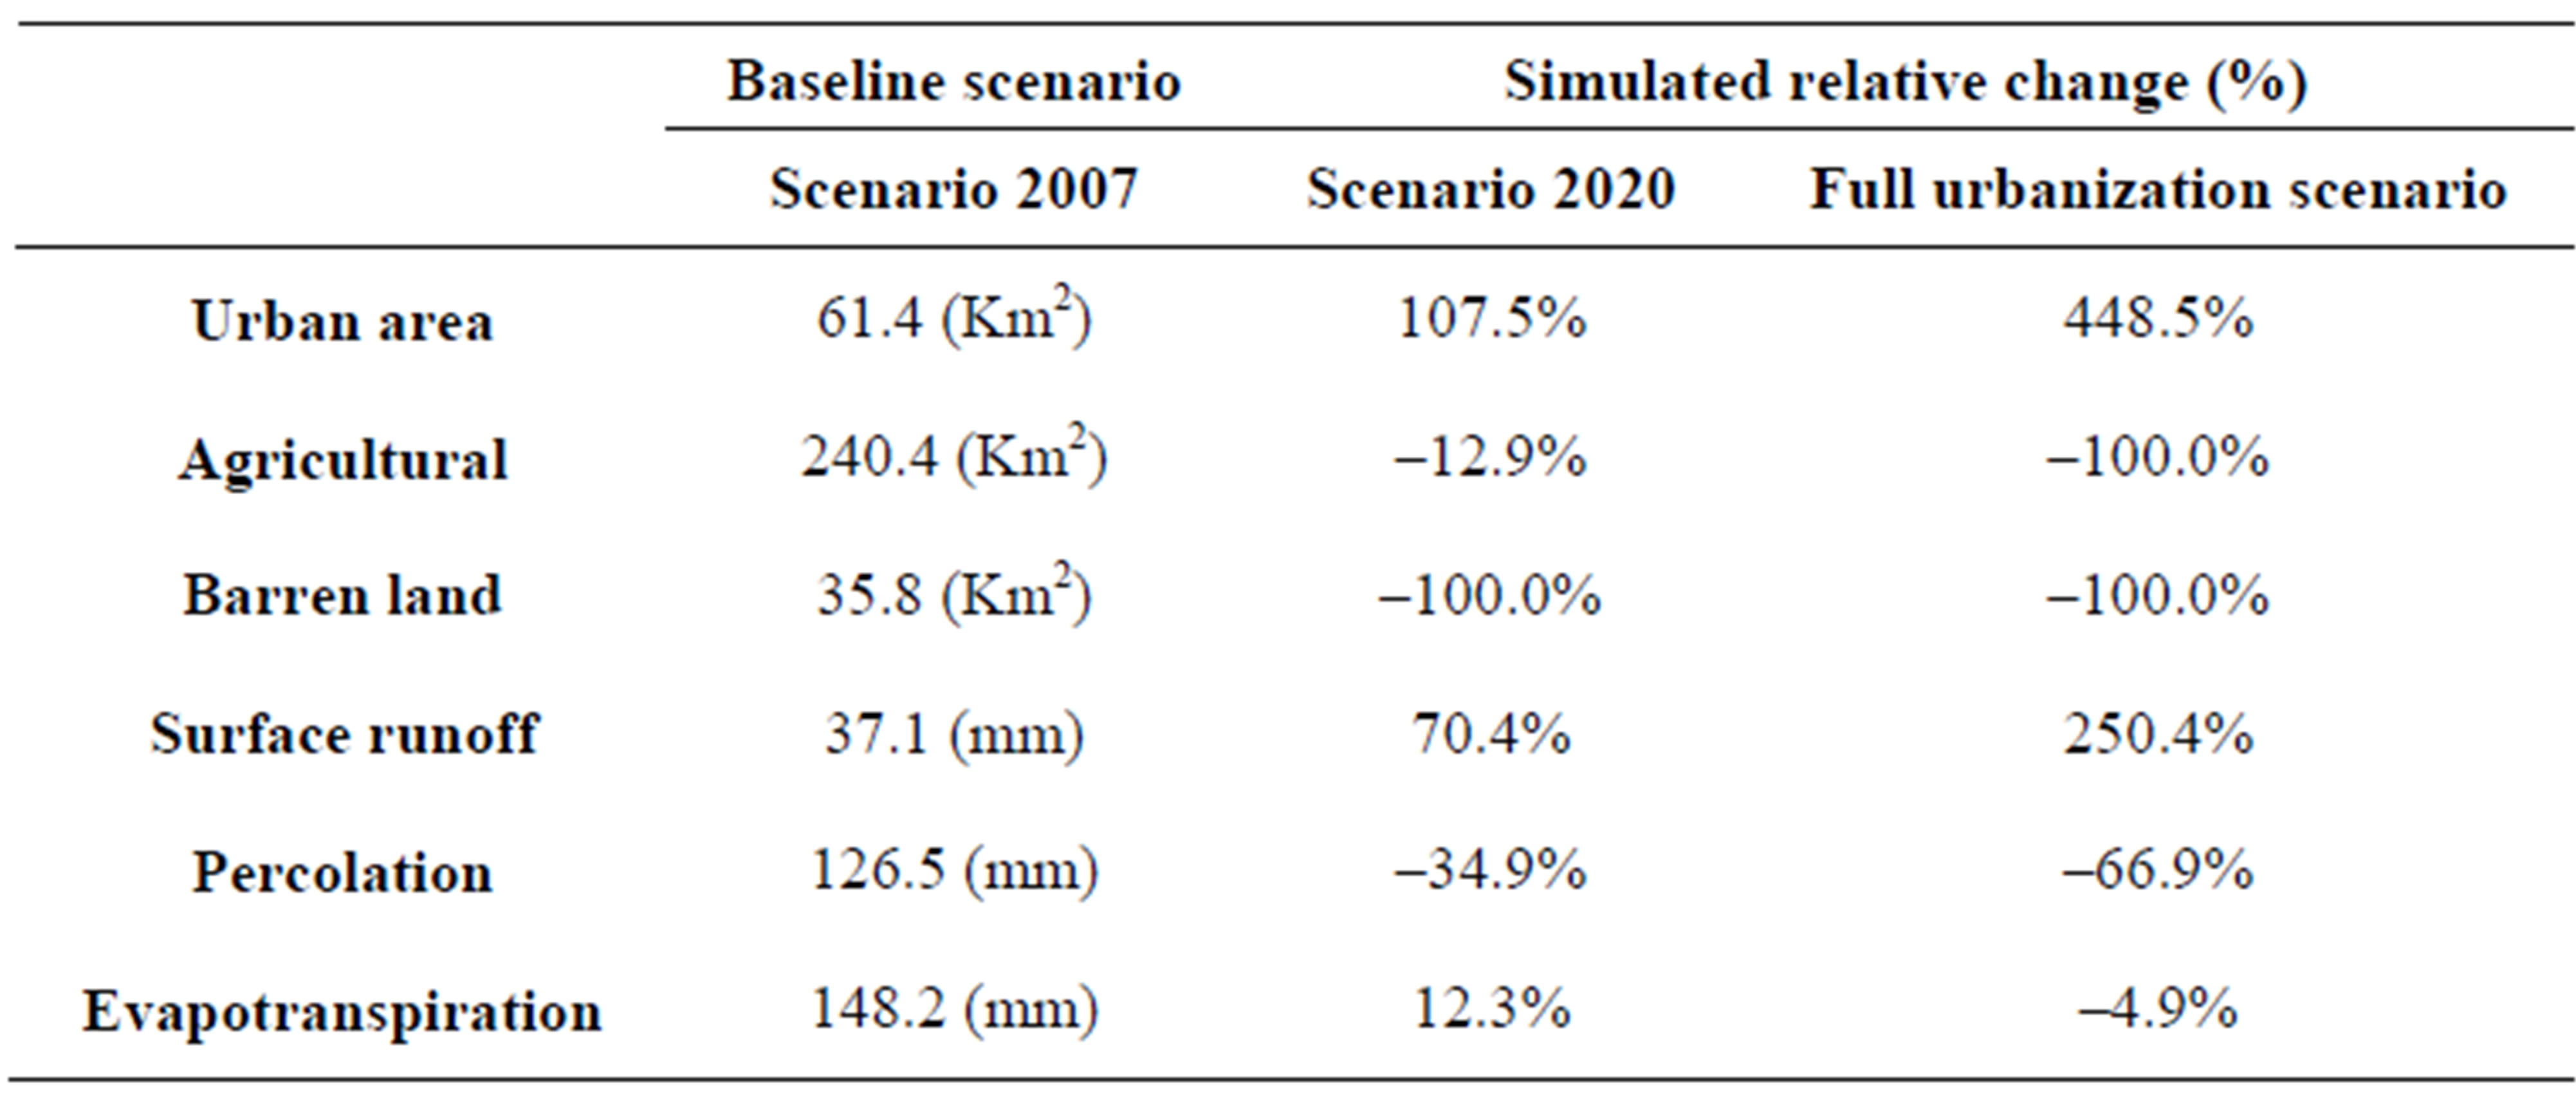
Table 4. The simulated relative change in the hydrologic regime.

Figure 13. Linear relationship between urban area and surface water.
10% increase in the urban area of the Gaza Strip will reflect 5.6% increase in the surface water. Unlike surface runoff, No linear relationship was inferred from the simulation results of percolation and evapotranspiration.
5. Conclusion
The simulation results indicate that land-cover changes will significantly alter the hydrologic response of Gaza region. Percolation is expected to decrease in all options as urban areas are expanded from 126.5 mm in year 2007 to 82.4 mm in year 2020 which will increase the aquifer crisis of the Gaza Strip. In contrast, average surface water runoff increases from 37.1 mm in year 2007 to 63.2 mm in year 2020. Urbanization is considered to be the major environmental stressor affecting water budget of Gaza Region. Water harvesting is a future alternative to overcome groundwater deficit problem. Despite of moderate accuracy of the simulation process due to lack of data, the authors believe that the analysis of the three urbanization scenarios can give decision makers better understand for the future situation and assist them to advance towards achieving sustainable development planning for water environment in the Gaza Strip.
REFERENCES
- Gaza Weather Website, “Overview of Gaza Weather,” 2010. http:/www.gazaweather.com
- Coastal Municipality Water Authority (CMWA), “Water Situation in the Gaza Strip,” Technical Report, 2008, pp. 1-2.
- Palestinian Water Authority (PWA), “PWA Background Information and Water Resource Management Strategy,” 2004.
- Palestinian Water Authority (PWA), “Data-Bases of Palestinian Water Authority on Groundwater,” 2008.
- A. Aish, O. Batelaan and F. De Smedt, “Distributed Recharge Estimation for Ground Water Modeling Using WetSpass Model,” The Arabian Journal for Science and Engineering, Vol. 35, No. 1, 2010, pp. 155-163.
- T. Alslaibi and Y. Mogheir, “Recent Estimation of Hydrological Cycle Components in Gaza Strip Catchment Area,” International Conference, Sustainable Development and Management of Water in Palestine, 2009.
- A. Khalaf, J. Hamed and H. Alnajar, “Assessment of Rainwater Losses Due to Urban Expansion of Gaza Strip,” Islamic University of Gaza, Gaza, 2005.
- F. Abdulla and T. Eshtawi, “Application of Automated Geospatial Watershed Assessment (AGWA) Tool to Evaluate the Sediment Yield in a Semi-arid Region: Case Study, Kufranja Basin-Jordan,” Jordan Journal of Civil Engineering, Vol. 1, No. 3, 2007, pp. 234-244.
- W. Kepner, D. Semimens, S. Bassett, D. Mouat and D. Goodrich, “Scenario Analysis for the San Pedro River, Analyzing Hydrological Consequences of Future Environment,” Environmental Monitoring and Assessment, Vol. 94, No. 1-3, 2004, pp. 115-127. doi:10.1023/B:EMAS.0000016883.10110.15
- S. Miller, D. Semmens, D. Goodrich, M. Hernandez, R. Miller, W. Kepner and D. Guertin, “The Automated Geospatial Watershed Assessment Tool,” Environmental Modeling & Software, Vol. 22, No. 3, pp. 365-377.
- M. Tripathi, R. Panda, N. Raghuwanshi and R. Singh, “Hydrological Modeling of a Small Watershed Using Generated Rainfall in the Soil and Water Assessment Tool Model,” Hydrological Processes, Vol. 18, No. 10, 2004, pp. 1811-1821. doi:10.1002/hyp.1448
- NASA Website, 2010. http://dds.cr.usgs.gov/srtm/version2_1/SRTM3/Africa
- Ministry of Agriculture, “Strategy of Sustainable Agricultural Development from 2010 to 2020,” Seventh Document, 2010.
- Ministry of Transportation & Communications, Archived Data, 2010.
- S. Ghabayen, Utah State University, 2010. http://hydrology.neng.usu.edu/giswr/archive00/termpapers/ghabayen.htm
- A. Mohammadin, et al., “Estimation of Runoff for East Bani Naim Watershed Using SCS Curve Number Method and GIS,” Graduation Project Palestine Polytechnic University, West Bank, 2003.
- K. Goris and M. Samian, “Sustainable Irrigation in the Gaza Strip,” M.Sc Thesis, Katholike University, Leuven, 2001.
- S. N. Miller, W. G. Kepner, M. H. Mehaffey, M. Hernandez, R. C. Miller, D. C. Goodrich, F. K. Devonald, D. T. Heggem and W. P. Miller, “Integrating Landscape Assessment and Hydrologic Modeling for Land Cover Change Analysis,” Journal of the American Water Resources Association, Vol. 38, No. 4, 2002, pp. 915-929. doi:10.1111/j.1752-1688.2002.tb05534.x