Journal of Water Resource and Protection
Vol. 3 No. 5 (2011) , Article ID: 4975 , 8 pages DOI:10.4236/jwarp.2011.35035
Geotechnical Parameters Impact on Artificial Ground Water Recharging Technique for Urban Centers
1Civil Engineering Department, Sarvajanik College of Engineering & Technology, Surat, India
2Applied Mechanics Department, Sardar Vallabhbhai National Institute of Technology, Surat, India
3Maliba Institute of Technology, Surat, India
E-mail: pratima13p@gmail.com
Received January 27, 2011; revised March 4, 2011; accepted April 7, 2011
Keywords: Unconfined Aquifer, Well Determinant – Recharge Rate & Hydraulic Conductivity, Geometrical Properties of Aquifer, Pre Cast Octagonal Recharge Well
ABSTRACT
Water scarcity is a serious problem throughout the world for both urban & rural community. Urban centers in India are facing an ironical situation of water scarcity today. This paper includes an Analytical solution, Numerical modeling, Empirical approaches, In-situ test results to predict recharge (rate) mound of the ground-water and capacity of recharge well which is essential for the proper management of suitable artificial ground-water recharge systems to maintain water balance and stop salt water intrusion. Authors have derived analytical equation for predicting growth as well as decline of the ground-water mound depending on the intensity of recharge rate qr with different value of permeability k, depth of pervious strata H and diameter of well d, also studying the effects of variation in the geotechnical parameters on water-table fluctuations. In this paper to study the impact of numerical modeling using quadratic equation for unconfined aquifer base on rainfall intensity P and a change in saturated thickness H with variation in piezometric level. Empirical approaches are for evaluation of correct value of k of an undercharged unconfined aquifer with drawdown s0, influence zone L, recharge rate qr. In-situ test results give actual correlation between value of recharging rate of well and permeability on field. Authors have verified recharging rate of installed well from all approaches. A result obtained from the various field case studies gives the validation of the derived equation. Scientific quality measures of aquifer water are also recorded.
1. Introduction
Scarcity of water resources, pollution and climate change will be the major emerging issues in the next century. Due to depletion of water table, scanty and uneven pattern of rainfall, water scarcity is faced by arid and semi-arid district of Gujarat State. The runoff for roof top is computed based on average rainfall intensity. In addition to irregularity of rainfall, the change in life style, population explosion, rapid industrialization, rapid urbanization, irrigated agriculture and inefficient water management plan are the main factor which has lead to present water shortage problem. Recharge is a critical parameter for understanding, modeling and protecting groundwater systems from overexploitation and contamination. Adopting the concept of sustainability and conservation of water resources using artificial recharge technique can help to cope with the global water shortage.
Adequate space for surface storage is not available in urban areas, water levels are deep enough to accommodate additional rainwater to recharge the aquifers, rooftop and runoff rainwater harvesting (storm water reuse) is ideal solution to solve the water supply problems for better tomorrow. In this article simple methodology of recharging is highlighted. The collection of roof terrace water into detention tank and then recharges the unconfined aquifer through designed recharge well. Authors have derived general analytical equations for evaluation of recharging capacity of well with predominant geotechnical parameters like permeability of aquifer soil, depth of water table, depth of pervious strata, porosity and particle size of soil, etc. along this diameter of well, depth of well ,size of opening in casing pipe are also included. This derived analytical equation is verified by field test installing artificial recharge system at project site. Results obtained from all this approaches are confirmatory. Analysis of water quality and rise in water level in well done after one year which gives satisfactory working of the system.
2. Water Conserve or Fight War by 2050
Water is one of the renewable resources. About one-fifth of the world’s population lacks access to safe drinking water and with the present consumption patterns; two out of every three persons on the earth would live in water-stressed conditions by 2025. Around one-third of the world population now lives in countries with moderate to high water stress. India with an average rainfall of 1150mm is the second wettest country in the world with good water resources. But the water resources are not evenly distributed over the country due to varied hydro geological conditions and high variations in precipitation both in time and space. As a result, most parts of India experience lack of water even for domestic uses.
In Surat city (Gujarat State, India) source of River will give maximum 700 MLD. Then shortage of 150 - 200 MLD will be standing demand in 2050 as shown in Table 1.
3. Hypothesis of Water Available
Table 2 shows scenario of the costing of water available at present & in future. With the growing demand of water, ground water level dropped drastically, therefore artificial ground water recharging of aquifer by storm water reuse or surface water is the only answer for this water crisis. Thus, there is immediate need to conserve every source of usable water for the future generation. Planning and management of 10 years could post pone water crisis by few more years [1].
4. Population, Water Needs and Water Availability
The scarcity of water is a well-known fact. As per Census of India 1991, the population of India is estimated to reach a figure between 1.5 billion and 1.8 billion by the year 2050.The UN agencies have put the Figure 1. 64 billion. It is now generally accepted that the countries
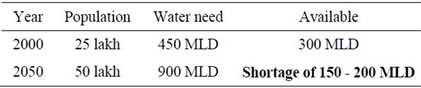
Table 1. Statistics of water for Surat city in 2050.
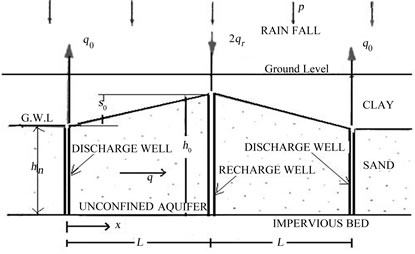
Figure 1. Artificial recharge well in unconfined aquifer above an impervious bed.
with annual per-capita water availability of less than 1 700 m3 are water stressed and less than 1 000 m3 as water scarce. India would therefore need 2 788 b.c.m. of water annually by 2050 to be above water stress zone and 1 650 b.c.m. to avoid being water scarce country.
In India per capita surface water availability in the years 1991 and 2001 were 2309 m3 and 1902 m3 and these are projected to reduce to 1401 m3 and 1191 m3 by the years 2025 and 2050 respectively. Hence, there is a need for proper planning strategy, development and management of the greatest assets of the country, viz. water and land resources for raising the standards of living of the millions of people; particularly in the rural areas.
The average annual surface water flows in India has been estimated as 1869 b.c.m. of which 690 b.c.m. only can be utilized. If appropriate recharging storage techniques can be created than maximum water can be store. The demand of water is increasing day-by-day resulting in extraction of more and more groundwater and such extraction is in far excess of net average recharge from natural sources and hence it necessitates artificially recharging the aquifers to balance the output.
• Due to increasing gap between availability and utilizable surface requirement as per Table 3, the water scare regions are facing problems. Looking to this the artificial ground water recharging is sustainable viable solution for meeting water crises for tomorrow.
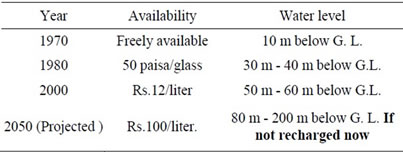
Table 2. Water availability & location of ground water level.
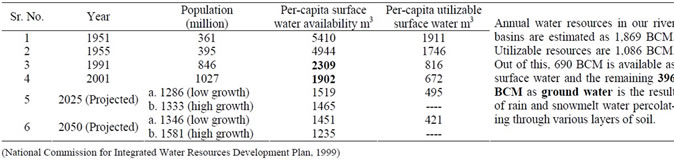
Table 3. Per capita per year availability, utilizable surface water and ground water in India.
5. Numerical Modeling
Numerical modeling of ground water flow related to unconfined aquifer using quadratic equation. [2,3]
 (1)
(1)
The flow of phreatic water in an unconfined aquifer above an impervious base is complicated by two factors: a change in the saturated thickness accompanying the variation in Piezometric level and the presence of recharge by rainfall.
5.1. Variable Parameter: Permeability (k)
Permeability of soil directly effects on recharging rate of well and also on nature of recharge mound pattern below the ground water table shown in Figure 2. [4]. Varying the different value of permeability of soil in Equation (1), other parameters like rainfall P = 0, original water table hn = 10 m, discharge q0 = 5×10⁻⁵ m3/m/sec are constant.
From Figure 2, the value of permeability directly reflects the shape of recharge mound maximum at center, reduces at end and finally merge with water table. Curve of coarse sand gives maximum rate of infiltration means fast rate of recharge.
5.2. Variable Parameter: Rainfall (P)
For study the behavior of water mound below recharge area, varying all the variables like rainfall P, permeability k, distance of discharge well from recharge well L in Equation (1), others parameters like discharge from well A and C q0 = 5 × 10⁻⁵ m3/m/sec, k = 2 × 10⁻³ m/sec, L = 70 m, original water level hn = 10 m are constant.
• Figure 3 shows that initially rainfall increases, height of water mound decreases, drawdown also decreases. It means water percolates through aquifer and merges with ground water and increase ground water level. ABCD zone indicates for SURAT city (GUJARAT) maximum to minimum rainfall of 10 mm/hr to 5 mm/hr respectively. The storage of water during recharges and water detent in aquifer is about 42 to 48 days.
6. Analytical Approach
Recharging capacity of well can be estimated from modification of Darcy’s seepage flow equation.
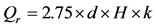
Recharging flow Qr by constant head recharge in bore well can be calculated [5] by using
 (2)
(2)
where, d = diameter of recharge well (m), H = depth of pervious sand strata depth maximum 20 m or below the G.W.L. (m), k = co-efficient of permeability (m/sec).
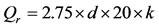
 (3)
(3)
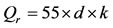
This analytical Equation (3) is the derived as a generalized equation for determination of recharging capacity of well for any required value of diameter of the well and permeability of soil highlighted in Table 4.
• Figure 4 shows recharging capacity of well reduces with decrease in permeability of soil. Medium to coarse sand is suitable for recharging of aquifer. If one is interested for having required more recharge rate then larger diameter bore can provide instead of providing (installing) two smaller diameter of bore.
7. Empirical Approach
Basic concept of empirical approach is used to estimate recharging capacity recharge well in unconfined aquifer. Figure 5 show water flows from the well perforations and forms a recharge mound above water table and increases the water level. [6]
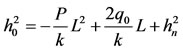
Recharge rate of well can be estimated from empirical formula as:
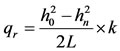
where, h0 = Height of phreatic water table above aquifer base in well (m); k = Co-efficient of permeability (m/sec); L = Influence zone or Radius of spread (m); rw = Radius of well (m); s0 = Drawdown of water level (m) = (h0 – hn); qr = Recharge rate (m3/sec) or (m3/m/sec) (P × L); hn = Height of Ground Water Table.
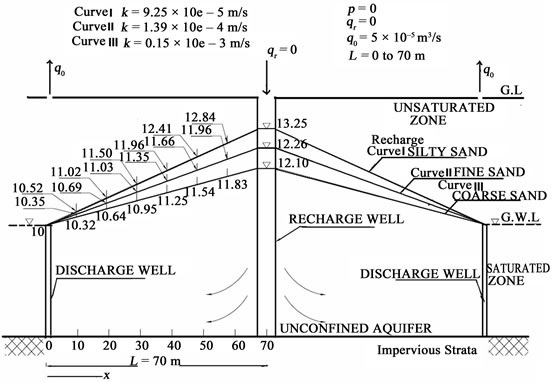
Figure 2. Ground water recharge mound under different soils.
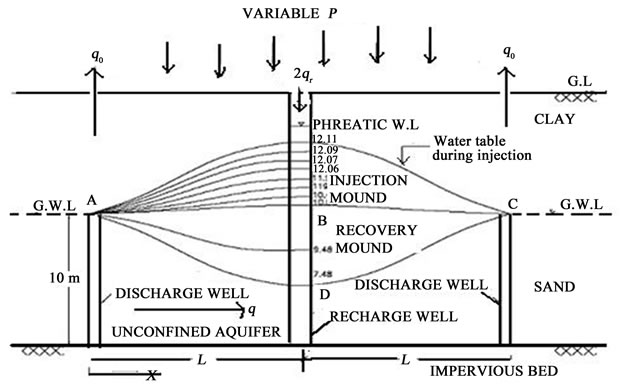
Figure 3. Schematic cross section displaying dynamic water table for recharge (Injection) and discharge (Recovery).
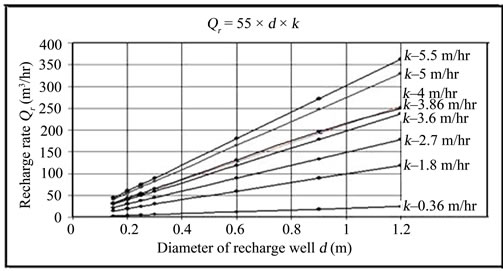
Figure 4. Recharge capacity of bore well Qr verses diameter of recharge well (d) with variable permeability of aquifer (k).
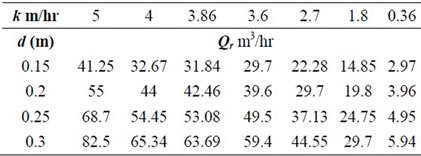
Table 4. Qr = 55 × d × values of recharge rate for any diameter of well d and permeability of soil k.
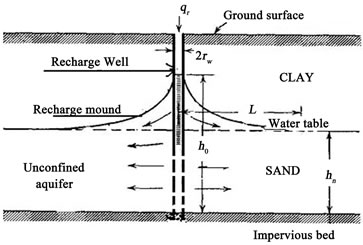
Figure 5. Radial flows from recharge well penetrating in
unconfined aquifer.
8. In-situ Pumping in Recharge Trial Test Result
Recharging capacity of recharge well with octagonal precast recharge system [7] installed at site is evaluated as below:
8000 liter water from the tanker takes 15 minutes to percolates in the soil strata through 0.15 m diameter & 15 m deep recharge well with bottom plug casing up to 12 m & initial groundwater level is recorded at 11.4 m.
The overall recharging capacity of installed recharge well at project site is 32 m3/hr. It shows that in one hour 32 000 liter water store in recharge well without spill off.
Justification through actual rainfall data:
As per CBRI/Climate handbook of year 2008-09, maximum intensity of rainfall in Surat is 100 mm/hr (0.1 m/hr).
Terrace Roof top area of project site is = 300 m2.
Rain water from Roof top (recharge rate) = 300 × rainfall = 300 m2 × 0.1 m/hr = 30 m3/hr.
Recharging capacity of designed well system at project site is estimate 32 m3/hr by field trial test, which is confirmed with actual rainfall data of the city i.e. 30 m3/hr.
Figures 6 and 7 shows recharging system is installed at NIT, project site Surat with details of connected pipes with terrace roof of 300 m2 area, detention chamber, water meter chamber, pre cast recharge system, recharge well etc.
Ø Authors have installed & designed artificial recharging techniques at various place and confirmed analytical equation results with field test results. Few field case studies are highlighted here.
Ø After installing recharge well system at both site (Figures 8 and 9 ) water level rise satisfactory, improve quality of water and as per soil investigation report permeability of available soil strata (k) is confirmed (coarse sand k = 4 m/hr) with design calculations of the well system.
9. Results and Discussions
9.1. Evaluation of Recharge Rate of Well at SVNIT Project Site from Different
Approaches
Recharging capacity of installed well is verified by different approaches as shown in Table 5.
9.2. Verification of Recharge Capacity Qr of well with d and k
Field data of various field case studies are collected and confirmed with derived analytical equation.
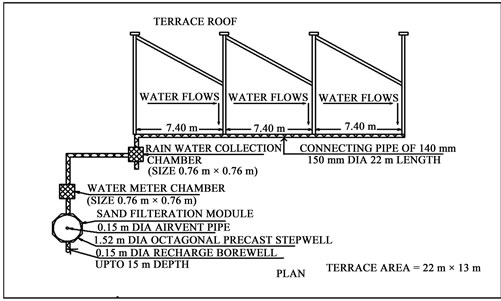
Figure 6. Installed recharging system at project site.
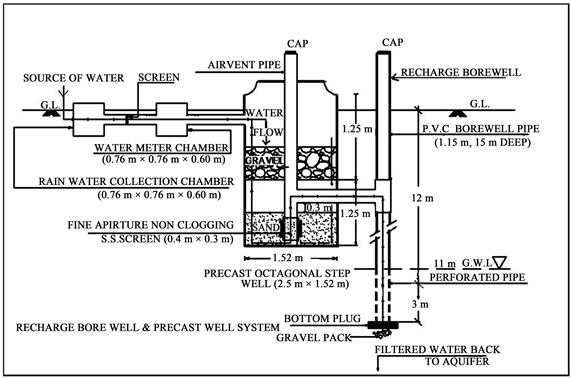
Figure 7. Components of recharge system.
CASE STUDY 1: SOUTH - WEST ZONE AREA (PANAS KRUSHI FARM, SURAT) [8]; Recharge Scheme Installed: recharge bore well up to 22 m depth with open bottom.
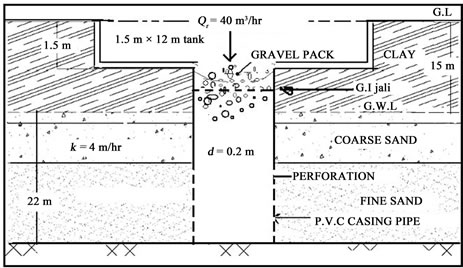
Figure 8. Installed recharge well of 0.20 m dia. with 40 m3/hr recharging capacity.
CASE STUDY 2: EAST ZONE AREA (RADHE KRISHNA MARKET, SURAT) [9,10]; Recharge Scheme Installed: Recharge bore well up to 33 m depth with open bottom.
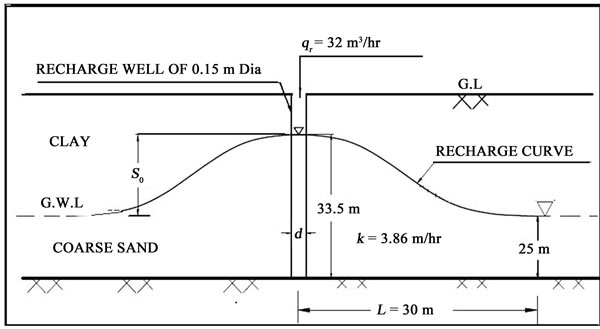
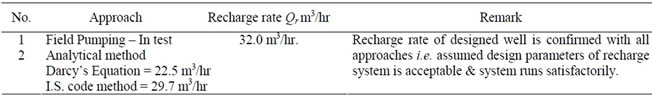
Table 5. Comparison of SVNIT site results by different approaches.
Table 6 shows the verification of recharging capacity of well of different site locations [1].
9.3. Results of Water Level & Quality Analysis of Recharge Well at SVNIT Project Site
Recharge well of 150 mm f up to 22 m depth with strainer openings & bottom plug for avoiding silting below the well.
• Results of Water Level & Quality as Per I.S 10500— 1991 mentioned in Table 7 there is a considerable reduction in chlorides and hardness of water. The groundwater level also found increased. There is an improvement in the pH value of the groundwater, also an improvement in the quality of groundwater in the wells situated to nearby vicinity of the recharge. Rise of water level in well and improvement in water quality after recharging shows installed system runs satisfactorily.
10. Conclusions
1) From the all approaches, it implies that geotechnical parameters directly impact on all the approaches and methodology are narrated for determination of recharging rate of installed system at site.
2) A case study from this paper gives the exact methodology of artificial recharge scheme implemented at site. If proper planning and effective geotechnical parameters are correctly used then one can get maximum advantage of recharge system and solve water crisis for tomorrow.
3) The available field test data, derived analytical Equation (3) and results obtained from the Table 4 in this article is sufficient to provide immediate requirement of design of recharge bores planed by government in 2010-11. Prime Minister also emphasized in his speech on “2007 Water Resource Day” and challenged Engineers to provide technology for Public Awareness & Participation Programme for recharging of ground water for Urban & Industrial area. The technology could supplement to IS Code: 15792 (2008) to make it user friendly.
4) Derived analytical Equation (3) and calculated data in Table 4 is justifies that for any recharge bore well system permeability of soil (k), diameter of well (d), depth of pervious strata (H) and depth of ground water
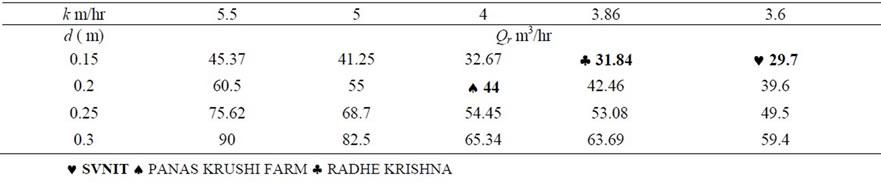
Table 6. Derived analytical equation Qr = 55 × d × k.
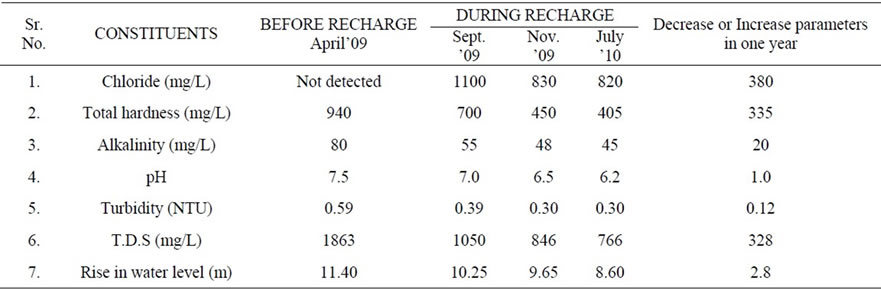
Table 7. Quality measures of water.
table (h) are design governing parameters.
REFERENCES
- P. Pratima and M. D. Desai, “Clean Water Will be Scarce; Artificial Recharge of Aquifers: An Economical & Sustainable Solution for Future Demand,” International Perspective on Water Resources & the Environment, Singapore, 4-6 January 2011, p. 1055.
- L. Huisman and T. N. Olsthoorn, “Artificial Groundwater Recharge,” Pitman Advanced Publishing Program, London, 1983.
- J. W. Warner and D. Molden, “Mathematical Analysis of Artificial Recharge from Basins,” JAWRA Journal of the American Water Resources Association, Vol. 25, No. 2, 1989, pp. 401-411. doi:10.1111/j.1752-1688.1989.tb03077.x
- P. Patel and M. D. Desai, “Numerical Modeling and Mathematics of Ground Water Recharging - Unconfined Aquifer,” International Conference on Advances in Concrete, Structural and Geotechnical Engineering, Pilani, 25-27 October 2009, pp. 96-104.
- I. S. 5529 Part 1, “Indian Standard Code of Practice for In-Situ Permeability Tests,” 1985, pp. 6-12.
- O. J. Helweg and G. Smith, “Appropriate Technology for Artificial Aquifers, Ground Water,” Ground Water, Vol. 16, No. 3, 1978, pp. 144-148. doi:10.1111/j.1745-6584.1978.tb03215.x
- P. Patel and M. D. Desai, “Artificial Recharge of Ground Water by Storm Water Reuse is Viable and Sustainable Solution for Better Tomorrow,” 17th Congress IAHR- -APD International Conference, Green Device Paper no. 5, Auckland, 21-24 February 2010.
- M. R. Hausmann, “Engineering Principles of Ground Modification,” McGraw Hill, New York, 1990.
- J. Bear, “Hydraulics of Ground Water,” McGraw-Hill, New York, 1979.
- USBR EARTH MANUAL PART 1 & 2, “Procedure for Field Permeability Testing by the Well Permeameter Method,” 3rd Edition, Department of the Interior, Bureau of Reclamation, Denver, 1998, pp. 541-546.