Journal of Water Resource and Protection
Vol. 3 No. 10 (2011) , Article ID: 8130 , 16 pages DOI:10.4236/jwarp.2011.310080
Analysis of the Suitability of Surface Water for Irrigation Purposes: The Southwestern and Coastal River Systems in Ghana
1Department of Earth Science, University of Ghana, Legon, Ghana
2Department of Earth Science, University of California, Oakland, USA
E-mail: *smyidana@ug.edu.gh
Received April 3, 2011; revised July 11, 2011; accepted August 24, 2011
Keywords: Coastal Basins, Southwestern Basins, Multivariate Analysis, Sodium Adsorption Ratio, Electrical Conductivity
ABSTRACT
Surface water basins all over the world are very crucial in irrigation industries. Irrigation schemes are particularly crucial in the agricultural economies due largely to the fact that global climate change has led to drastic changes in rainfall patterns. As a result, rain-fed agriculture alone is no more sustainable and irrigation schemes are being encouraged as poverty reduction/eradication strategies in the developing countries. This study was conducted to assess the overall controls on surface water resources in the coastal and south-western river basins in Ghana, and determine the suitability of these surface waters for irrigation activities. Multivariate statistical methods were applied to data on the physico-chemical parameters from the coastal and southwestern river basins. This study finds that the quality of surface water from these basins is controlled principally by leachate of chemicals from solid and mine wastes, the chemistry of rainfall, weathering of underlying silicate mineral-rich rocks and sediments, agricultural and domestic wastes. All the parameters are within the acceptable national concentration ranges for most domestic and industrial purposes. Sodium adsorption ratio (SAR) was used to assess the quality of water from the two basins for irrigation activities. The SAR values for all the months and years sampled are lower than 4 and the electrical conductivity values are equally low due to generally low ionic concentrations. When plotted on the Wilcox diagram, the data for all the months for the two years of the study, plot within the “excellent to good” category, suggesting that water from the area is of acceptable quality for irrigation activities.
1. Introduction
The role of irrigation programs in global food security can not be overemphasized. In the developing world where agriculture constitutes a significant stake in the national economies, irrigation schemes play pivotal roles in the delivery of both commercial and staple crops. In the so-called third world developing countries such as Ghana, the development of irrigation schemes has been identified as a strategy to reduce poverty and unemployment. Moreover, the recent erratic patterns in rainfall in Ghana and other countries, and the attendant crop failures have had telling effects on the annual grain and foreign exchange returns from commercial crops. In addition, the canker of rural-urban migration is on the ascendancy as the teaming populations of the youth who hitherto made a living out of rain-fed agriculture now find solace in menial jobs in urban centers where they are engaged as porters with no proper accommodation or shelter.
Whilst acknowledging the role of irrigation schemes in global food security, it is imperative to assess the possible environmental effects of using poor quality irrigation waters for the sake of increasing crop productivity. Irrigation soils have been unduly affected by the use of high salinity, high sodicity soils for irrigation in some parts of the world including parts of China and India where irrigation is extensively carried out [1]. When this happens, the ability of the soil to hold and sustain productive irrigation is unduly affected, leading to massive crop failures. It is for this reason that the quality of irrigation waters need to be assessed prior to their use for irrigation schemes. Ideally, this assessment should be done against the specific soils that will be used for the planned irrigation schemes. In addition, since different crops have different tolerable limits for specific ions and the general salinity, it is imperative that the quality of irrigation waters be assessed against the type of crop that will be irrigated.
In addition to specific ion toxicities, it has been globally accepted that the proportion of the sodium ion against the major alkaline earth metals (calcium and magnesium) in irrigation waters play key roles in determining its quality for use on irrigation schemes. The sodium adsorption ratio, SAR, is an index which measures the relative proportions of the sodium ion on one hand and the sum of calcium and magnesium ions on the other. This index is used together with the electrical conductivity (EC) (which provides a quantitative measure of the salinity of irrigation waters), to comprehensively classify irrigation waters. One of the popular schemes used is that of the United States Salinity Laboratory’s categorization scheme developed in 1954. This scheme plots the EC on a logarithmic axis against SAR on a linear axis, and divides the area of the graph into sections with ascribed irrigation quality. Another scheme is the Wilcox [2] diagram which is a plot of the percentage sodium against the EC. The Doneen’s diagram plots the permeability index, calculated from the relative proportions of sodium and bicarbonate ions on one hand, and the sum of the major cations on the other hand, against the total ion content of the water in milliequivalents per liter. These categorization schemes have been used generally and widely to assess irrigation water quality prior to various irrigation schemes in the world [3].
A thorough assessment of the irrigation quality of waters is based on the total ion content of the water as reflected in the EC, the SAR, the temporal variations in these parameters, as well as the specific toxic effects of individual ions such as boron. It has also been noted that the effects of high SAR values are slightly higher when the ratio of calcium to magnesium in irrigation waters is lower than 1 [4]. The soil is more likely to contain high sodicity values when the calcium content of the irrigation water is higher than the magnesium content.
In this study, the quality of surface water from two major river basins in southern Ghana is being assessed to determine their suitability for irrigation in a tropical setting. An attempt is being made to investigate the variations of the assessment parameters to seasonal changes and the spatial variations of these parameters. The coastal and southwestern river basins have been sampled to be used as a case study. In the literature, little is known about the irrigation quality of surface water bodies in Ghana. Yidana et al. [5] used water quality data from some portions (three locations) of the Ankobra River Basin in southern Ghana to determine the variations of SAR and EC with time, and the concomitant effects on the irrigation quality of water from these locations. Later, Yidana [6] carried out an assessment of the major parameters controlling surface water hydrochemistry in southern Ghana. He determined that the quality of rainfall as well as the weathering of the underlying rock is the major factor influencing the hydrochemistry at the basin scale. His study, however, did not comprehensively assess the variations of irrigation quality control parameters with season and location. Other studies have been conducted on groundwater quality for irrigation in Ghana [7,8]. The uniqueness of the current study lies in the incorporation of seasonal effects on the irrigation quality of surface water bodies in a typical tropical environment such as Ghana. Such an assessment is relevant because the irrigation quality of water is influenced by a gamut of factors which likely vary with season. Since such basins will be accessed for all year through irrigation schemes, it is crucial that an assessment of the quality of water they deliver for irrigation takes into account the effects of seasonal variations.
2. The Study Area
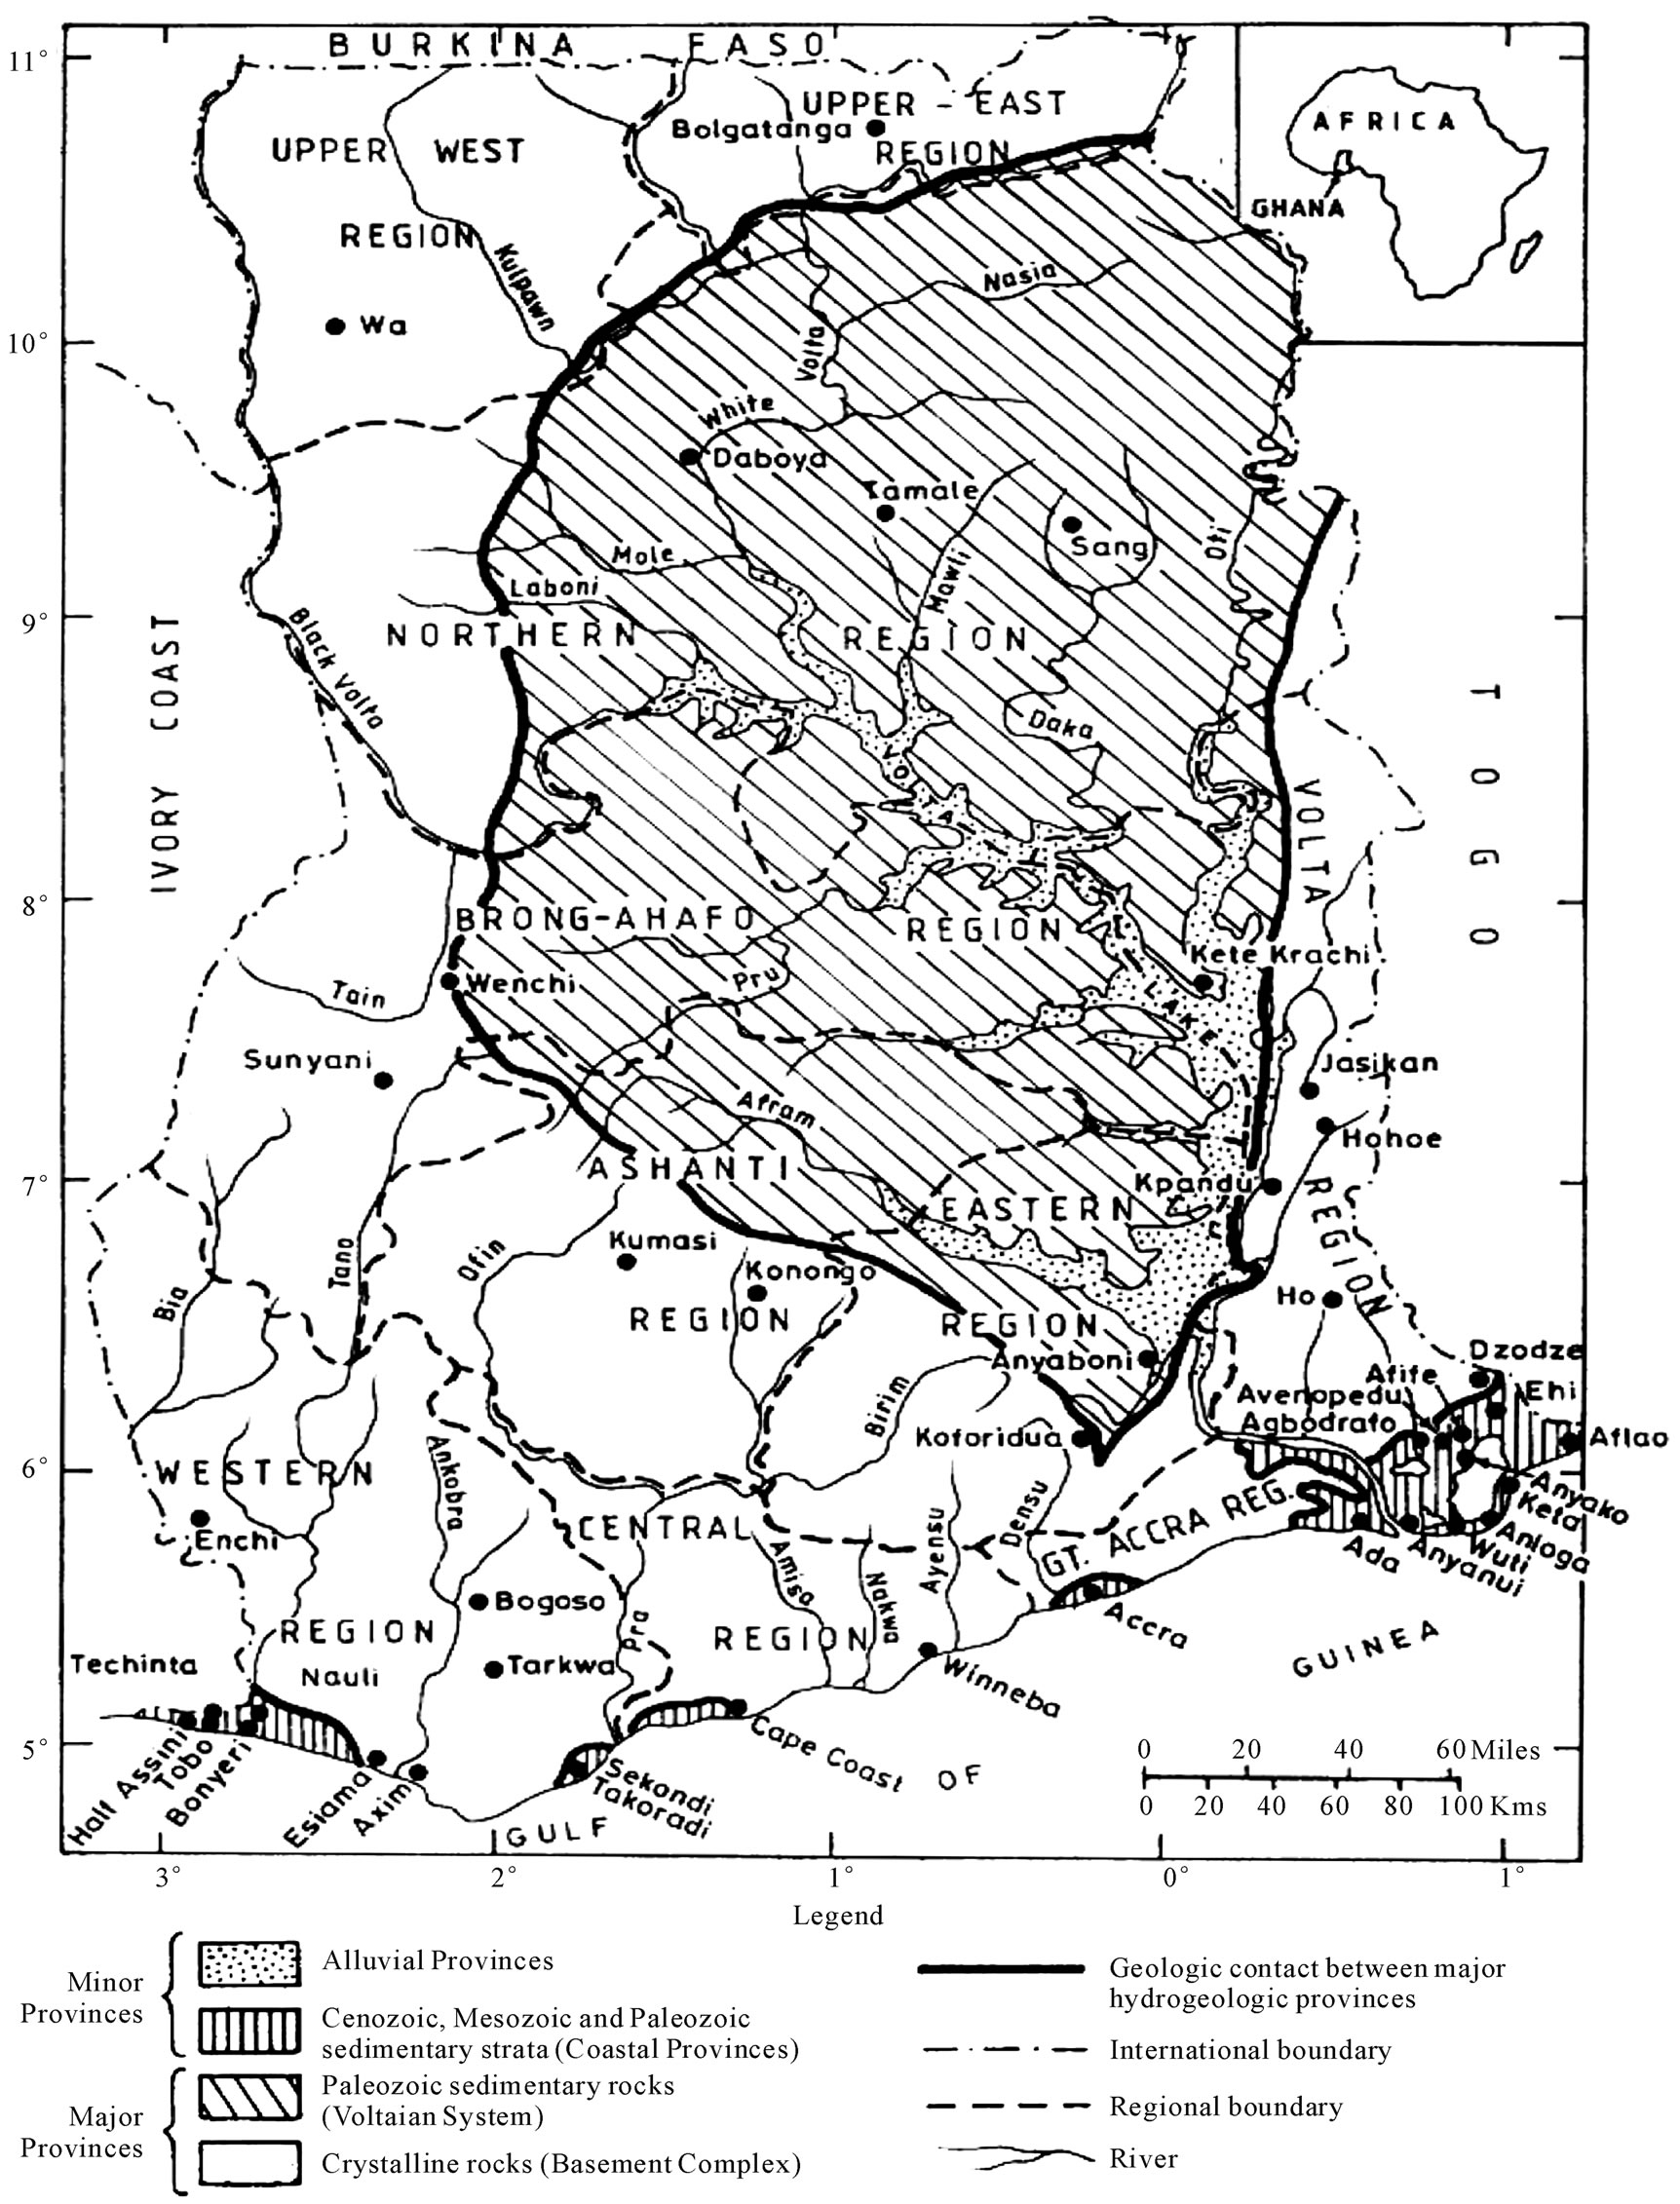
The drainage system in Ghana is divided into three main components: The Volta river system, the southwestern river system, and the coastal river system. The study area comprises the coastal basins and the southwestern river systems of Ghana (Figure 1). The southwestern river system covers about 22% of the drainage network in Ghana and consists of the Bia, Tano, Pra, and Ankobra Basins. It is located between latitudes 5˚N and 7.7˚N and longitudes 0.3˚W and 3.2˚W. The mean slope of the river basin ranges between 0.2% and 0.4% [9]. The southwestern river system receives recharge from numerous streams. The relief is relatively low, with the lowest elevation being about sea level [9], and very few high elevations. For instance in the basin, average elevations range between 150 - 300 m above sea level, although there are a few locations of elevations exceeding 600 m. In the Tano basin on the other hand, average elevation is about 225 m, and the highest elevation is about 580 m above mean sea level. The Ankobra basin has the lowest average elevation of 75 m, but most areas range from 0 m and 15 m above sea level in elevation. The mean annual rainfall in the southwestern river system ranges from 1136.7 mm to 2156.0 mm. There are two main rainy seasons peaking respectively in May/June and September/October of every year. Temperature ranges
 (a)
(a)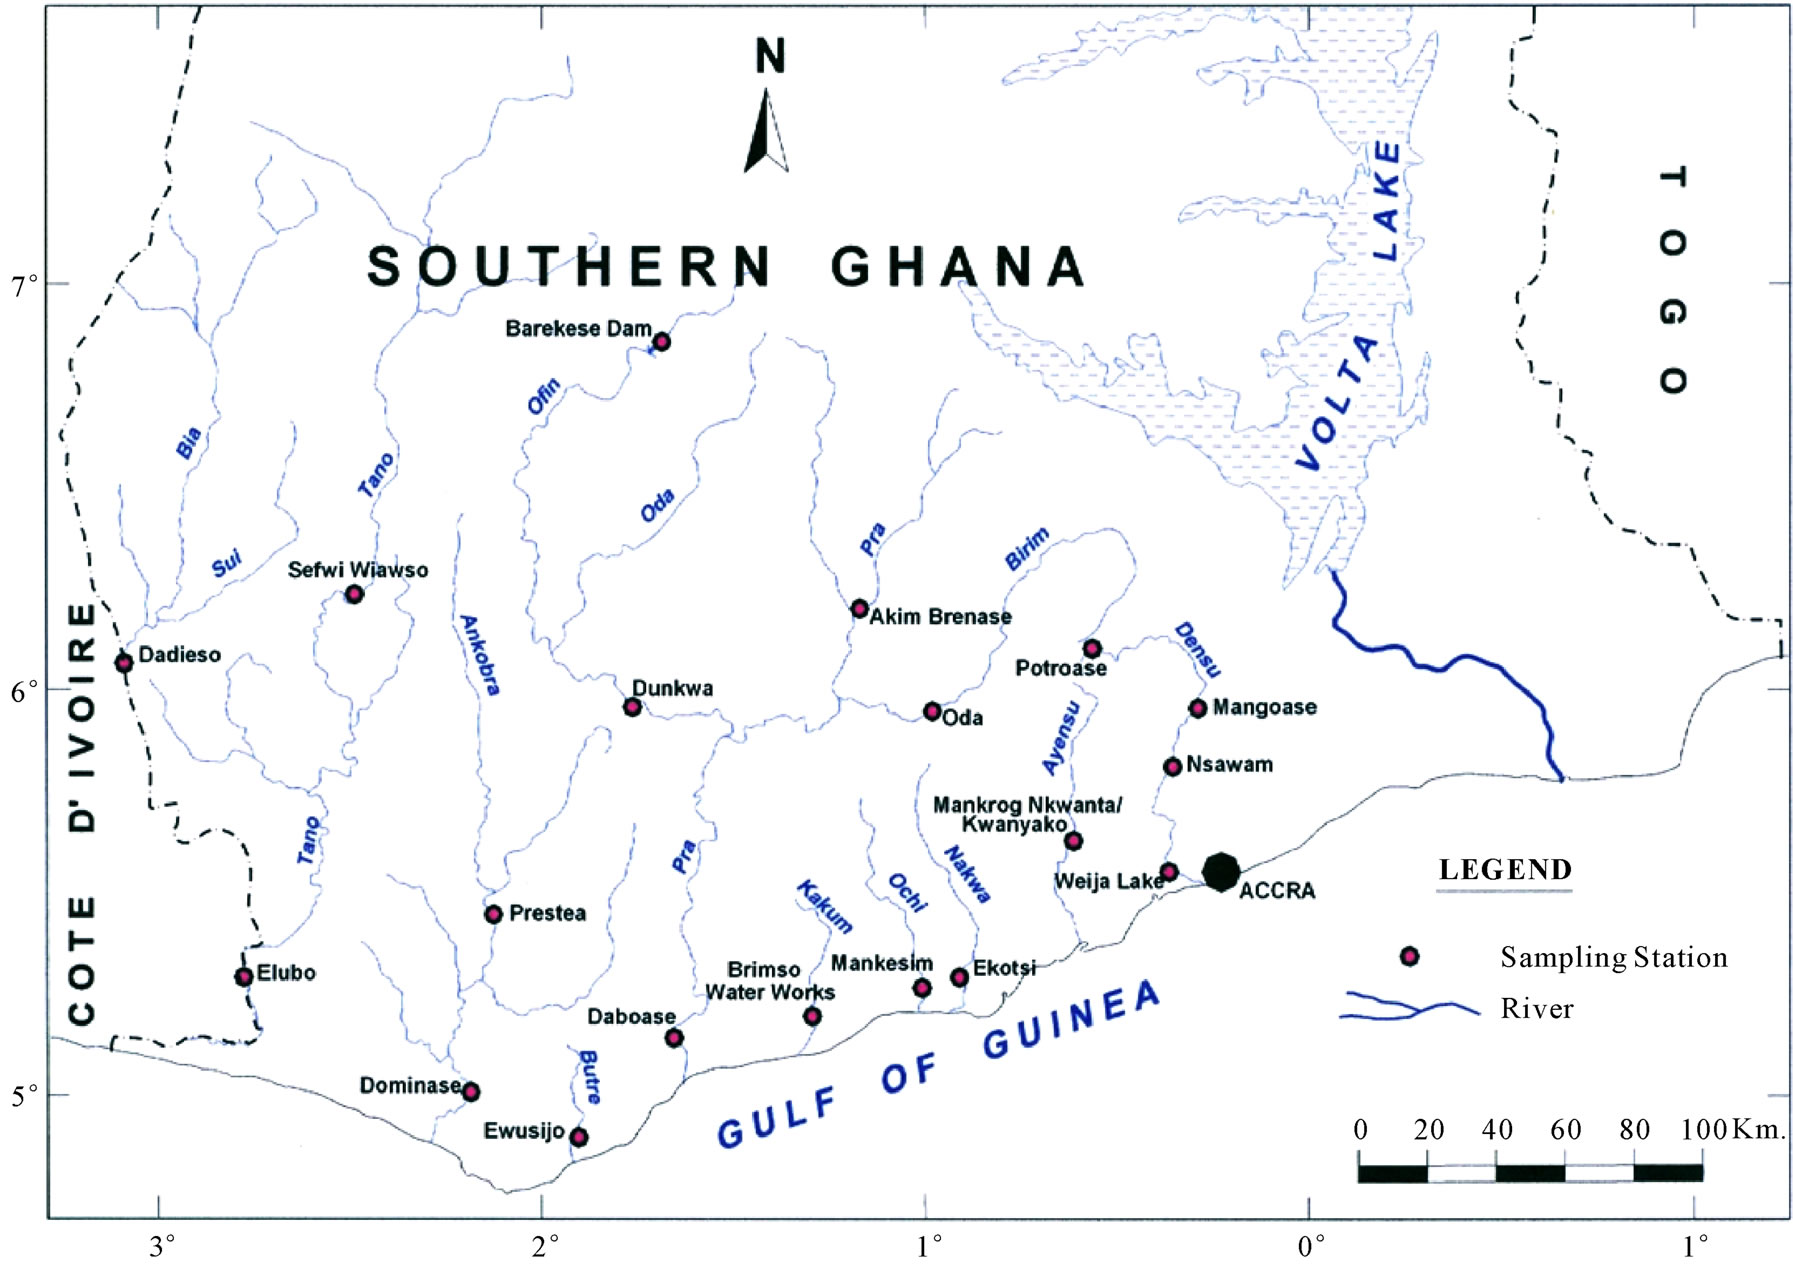 (b)
(b)
Figure 1. (a) A hydrogeological map of Ghana showing the underlying geology of the Coastal and Southwestern River Basins; (b) Drainage map of southern Ghana showing the Southwestern and Coastal River Basins.
between 25˚C and 27˚C. The annual relative humidity ranges between 58% and 96%.
The coastal river system is made of the Densu, OchiAmisa, Ochi-Nakwa, and Kakum River Basins and covers an estimated area of 8010 km2 (Dickson and Benneh, 1995). The river system feeds several important water supply systems such as the Weija, Winneba, Kwanyaku, and Baafikrom. The lowest elevations in the area are about sea level, whilst elevations as high as 500 m above sea level are common. The coastal river basins are underlain by the Precambrian granites and granodiorites and associated gneisses. The Lower and Upper Birimian and Dahomeyan rocks, as well as some Tertiary sediments, also underlie some areas within the coastal river basins. Due to the vast size of the coastal river basins, the climate is greatly varied, and is characterized by highly variable high temperatures and annual rainfall. The average annual temperature is about 28.5˚C. The hottest months in the basin are February to April when the mean monthly temperature is about 32˚C. There are two distinct climatic zones in the area: the dry equatorial climate and the wet equatorial climate zones [10]. There are two rainfall regimes with different intensities. Annual rainfall ranges between 900 mm and 1600 mm in the dry and wet equatorial zones respectively.
3. Methodology
Samples were taken from nineteen locations representative of the coastal and southwestern river basins in Ghana in the months of February, May, July, September, and November of 2006, and 2008. All sampling protocols were observed in the field and the samples were analyzed in the laboratories of the Council for Scientific and Industrial Research in Accra, for the concentrations of the major cations and anions, as well as silica. Other parameters determined include the total suspended solids (TSS), the biochemical oxygen demand (BOD), chemical oxygen demand (COD), NO3-N, NO2-N, NH3-N, turbidity and dissolved oxygen content (DO). pH and electrical conductivity (EC) were measured in the field using standard meters properly calibrated for such uses. The sampling and analyses were conducted by the staff of the Water Research Institute of the Center for Scientific and Industrial Research (CSIR) in Accra, contracted by the Ghana Water Resources Commission.
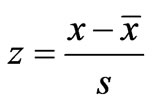
The resulting data for each parameter for the five months in each of the two years are summarized in Table 1. The data were standardized to their corresponding z-scores according to Equation (1), in order to meet the criteria for optimal multivariate analyses. The combined data for the five months of the two years were subjected to R-mode factor analysis and hierarchical cluster analysis (HCA). Data for the parameters for November 2008 were subjected to Q-mode HCA in order to produce spatial surface water associations in the study area. In both the R and Q-mode HCA, squared Euclidean distance was selected as the measure of similarity/dissimilarity, whilst the Ward’s linkage method was used to link initial clusters. Several similarity/dissimilarity measures are available in the literature and statistical codes for HCA. However, in both modes of HCA, the combination of Euclidean distances and Ward’s linkage method has been found to produce optimal results [5,11,12], and has been copiously used in multivariate classification schemes [3,5, 13].
 (1)
(1)
where z, x,  , s are respectively the standardized values, the concentrations, mean and standard deviation of the parameters.
In the R-mode factor analysis, principal components analysis was selected as an extraction method whilst varimax rotation was selected as the rotation algorithm. Factor rotation is the application of an orthogonal matrix to the results of the factor analysis, and different matrices are applied based on the rotation type chosen. In this study, the varimax rotation was chosen to increase the variance among the resulting factors, thereby maximizing the ease of interpretation of the results. Naturally, it is possible to produce as many factors as there are variables in the dataset. However, this is usually avoided as much as possible since some of the factors produced in this fashion would not represent unique sources of variation in the dataset. For this reason, the Kaiser criterion is applied to ward off unnecessary factors in the final model. Kaiser criterion [14] requires that a unique factor worthy of inclusion in the final factor model must have an eigenvalue of not less than 1.
The irrigation quality of the water was assessed using the SAR (Equation (2)), the EC, and the sodium percent (Equation (3)). The Wilcox [2] and USSL [15] diagrams were therefore generated to characterize the irrigation quality of surface water from the study area.
 (2)
(2)
where the ionic concentrations are in mmol/L.
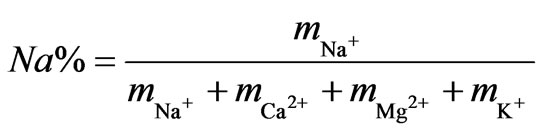 (3)
(3)
where the concentrations are in meq/L.
4. Results and Discussions
4.1. General Hydrochemistry and the Controls on Water Quality
Statistical summaries of the parameters analyzed for this study are presented in Table 1. The measures of the major parameters are generally low and show little variations from one season to the other. All parameters are within acceptable limits for most domestic uses, and could be attributed to natural causes. Since the river systems are generally flowing, there does not appear to be the cumulative enrichment of specific parameters from one season to the next.
Multivariate statistical methods have been copiously applied to a variety of geo-environmental studies throughout the globe. They have been used to delineate hydrochemical zones with definitive causative agents [8,13]. The method has also facilitated the delineation of groundwater recharge and discharge areas, and to characterize the general hydrochemistry of basins [5]. Usually factor analysis is applied together with cluster analysis, and the two are very useful in characterizing basins, thus providing clues of trends of environmental contamination. Factor analysis for instance is a data reduction multivariate statistical tool which reduces a large set of data of variables into a smaller number of uncorrelated, easily interpretable factors. Factor analysis is used in a similar fashion as piper trilinear diagrams, with the added advantage that it includes other parameters which are not usually used in piper trilinear diagrams. The result is a more robust hydrochemical classification model for basins.
R-mode factor analysis with varimax rotation resulted in five factors accounting for over 73% of the total variance in the hydrochemistry. Table 2 presents the results of the factor analysis. Factor 1 loads highly and positively with all the major cations (except Na+), and BOD, and loads negatively against COD, accounting for about 22% of the total variance among the five factors. The biochemical oxygen demand provides an impression about the content of organic matter present in the system, and thus provides an indication of the degree of organic
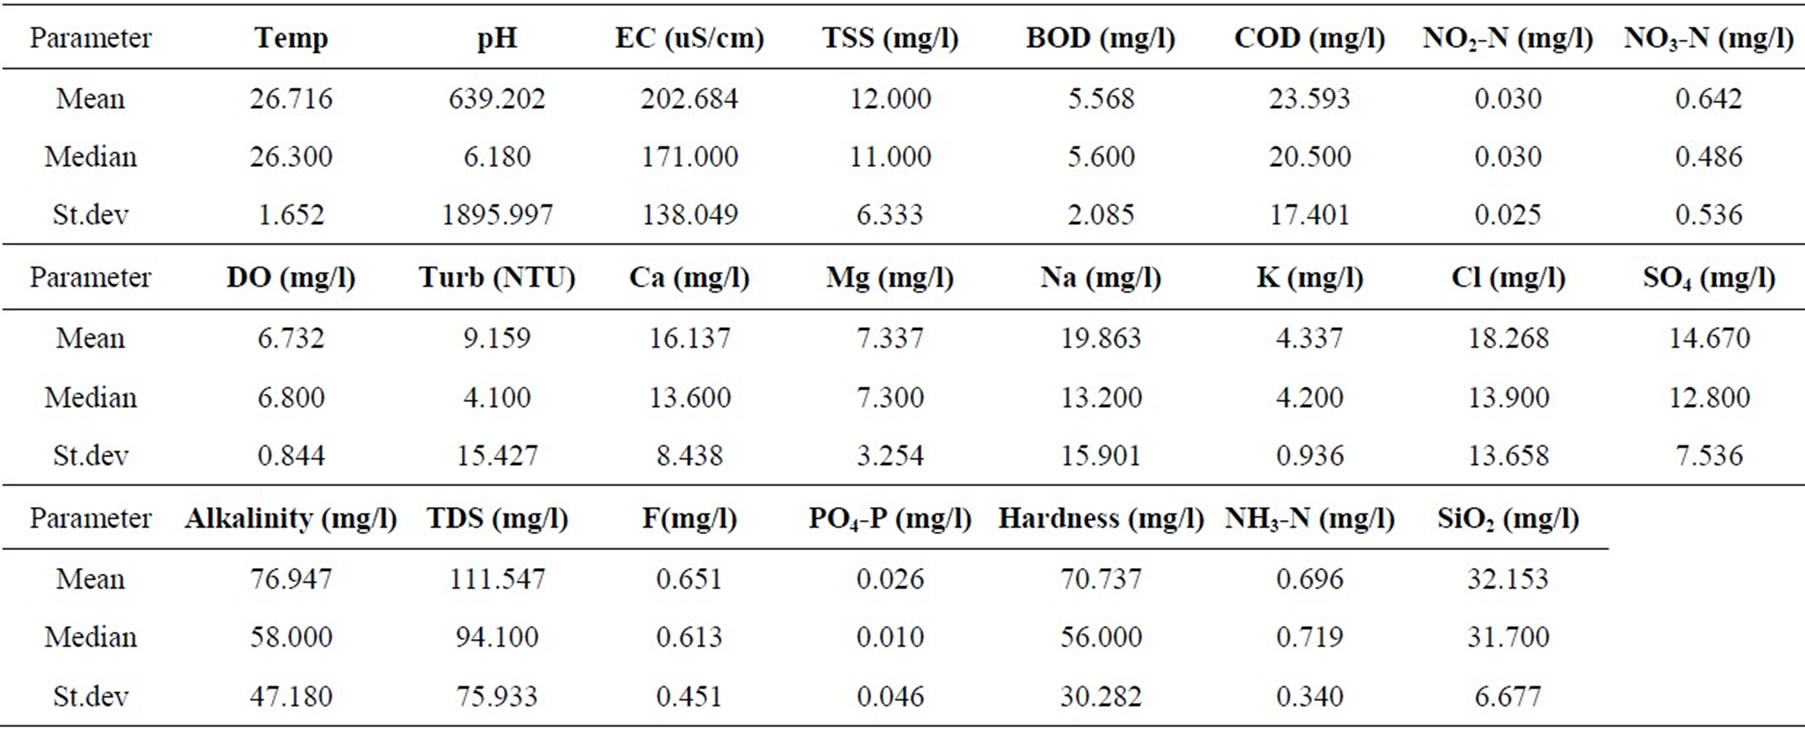
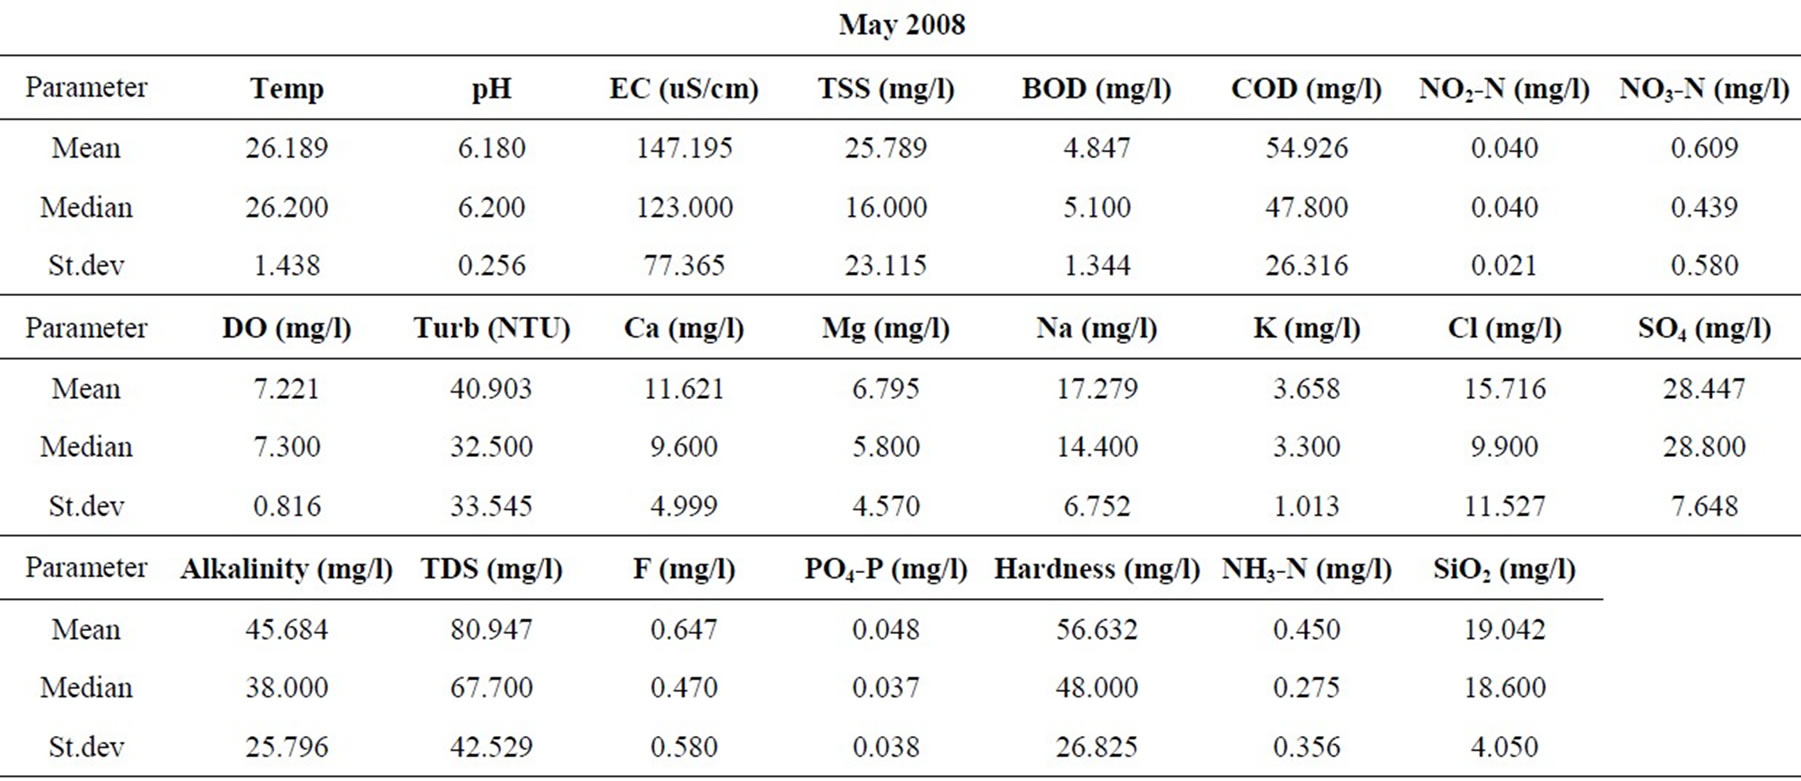
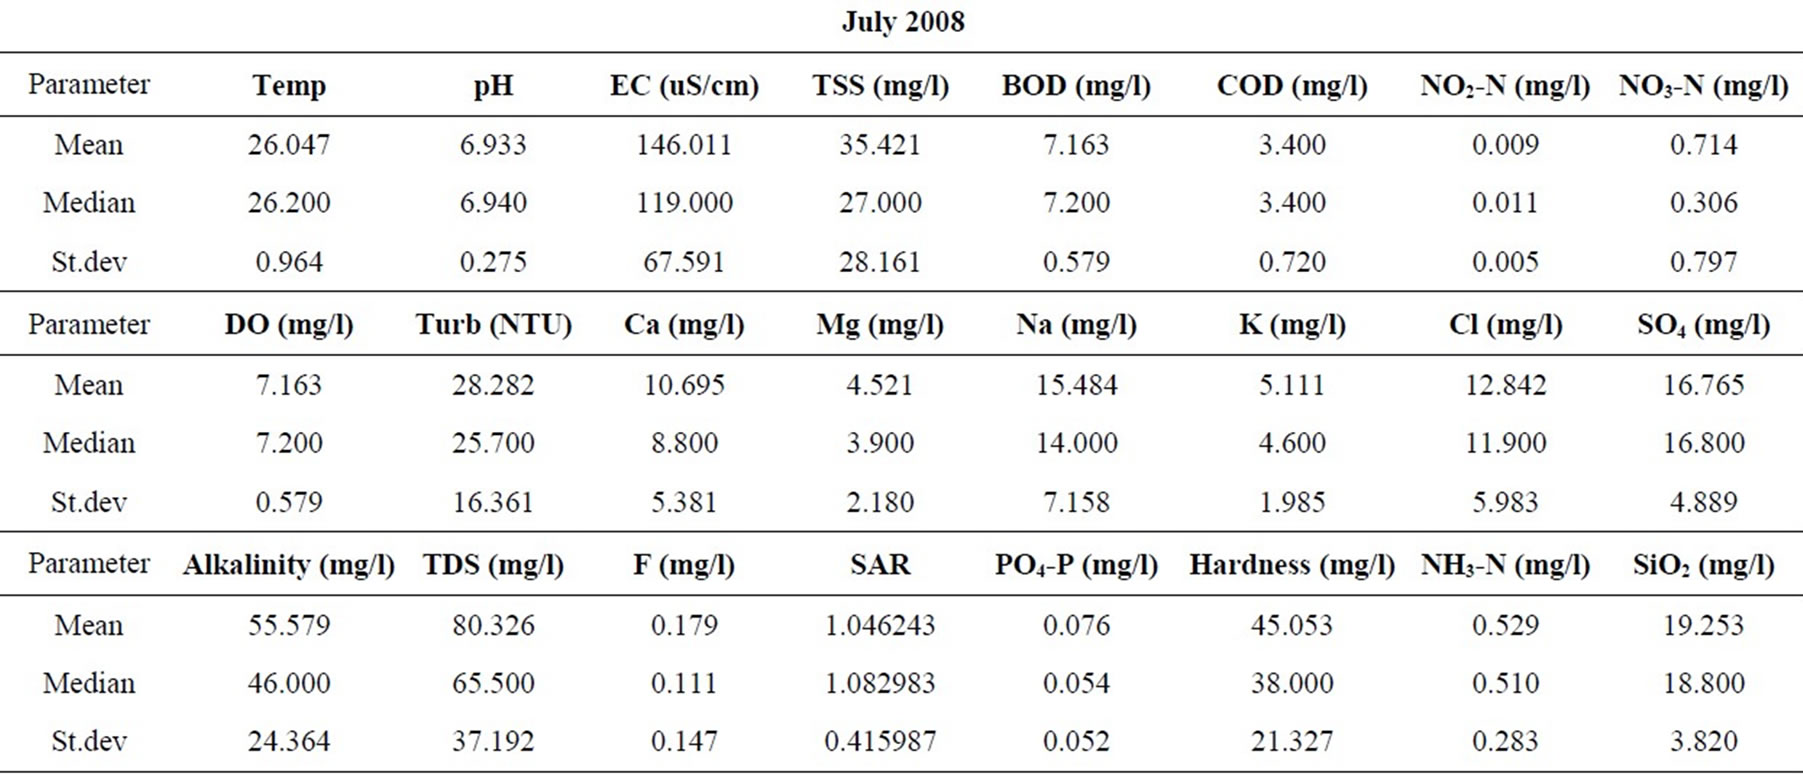
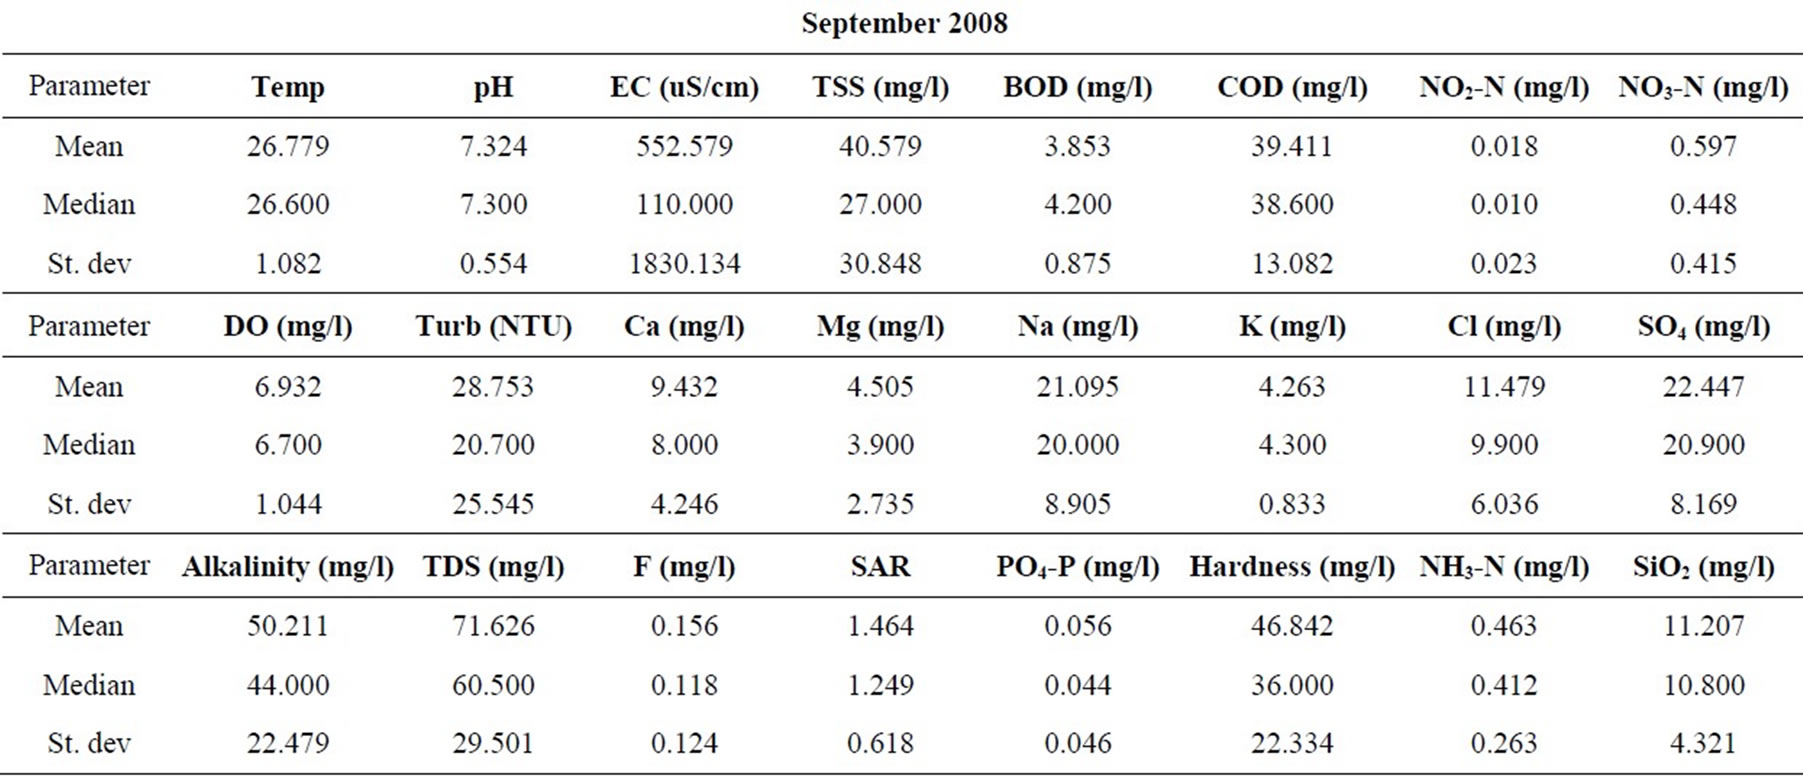
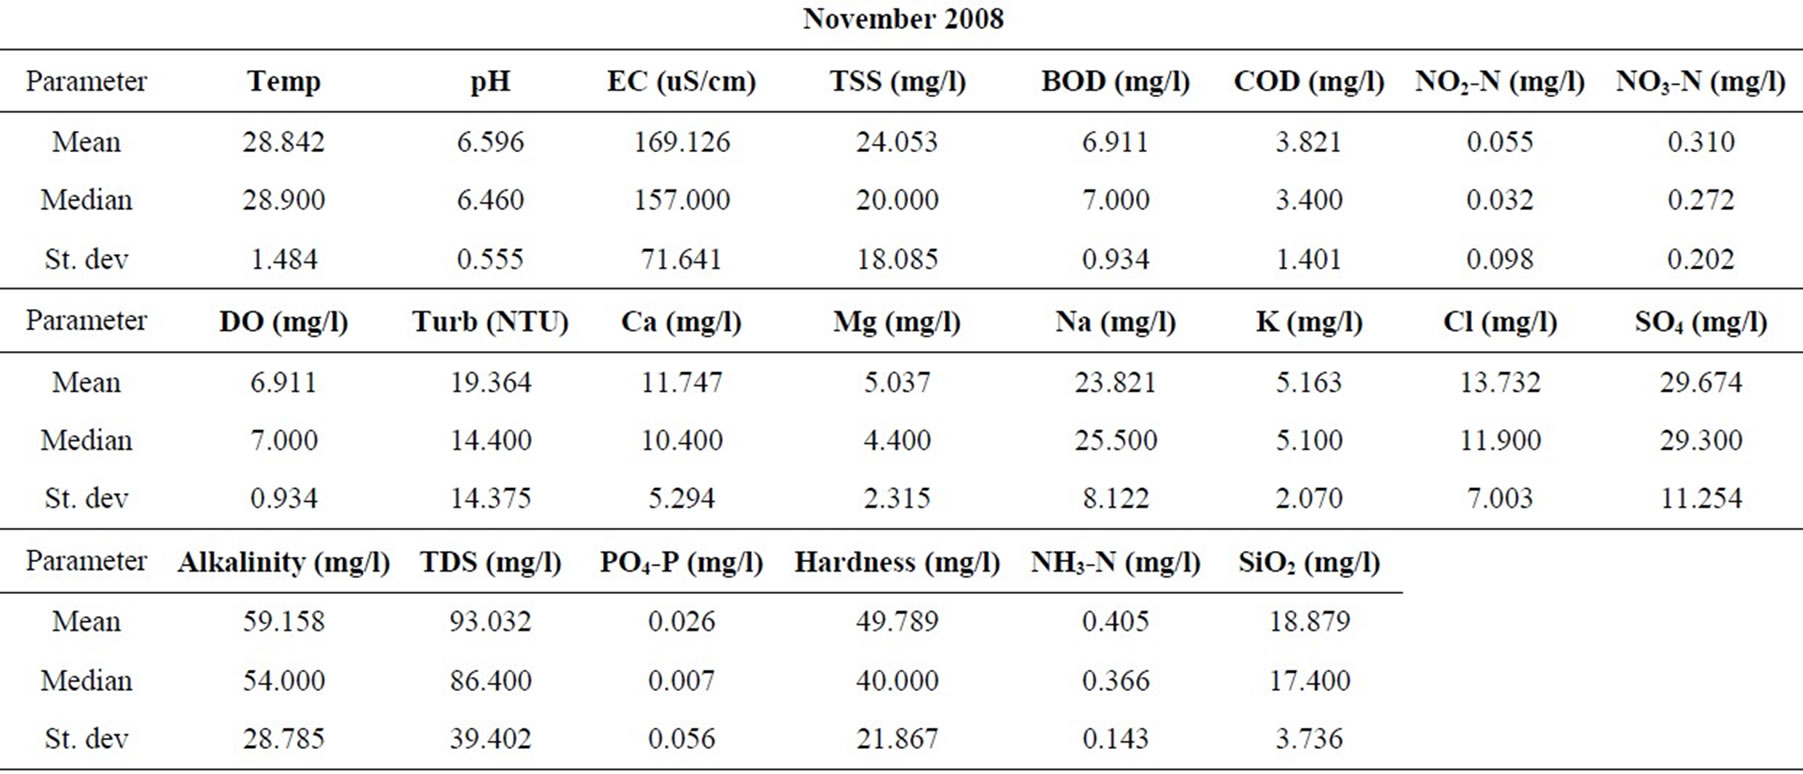
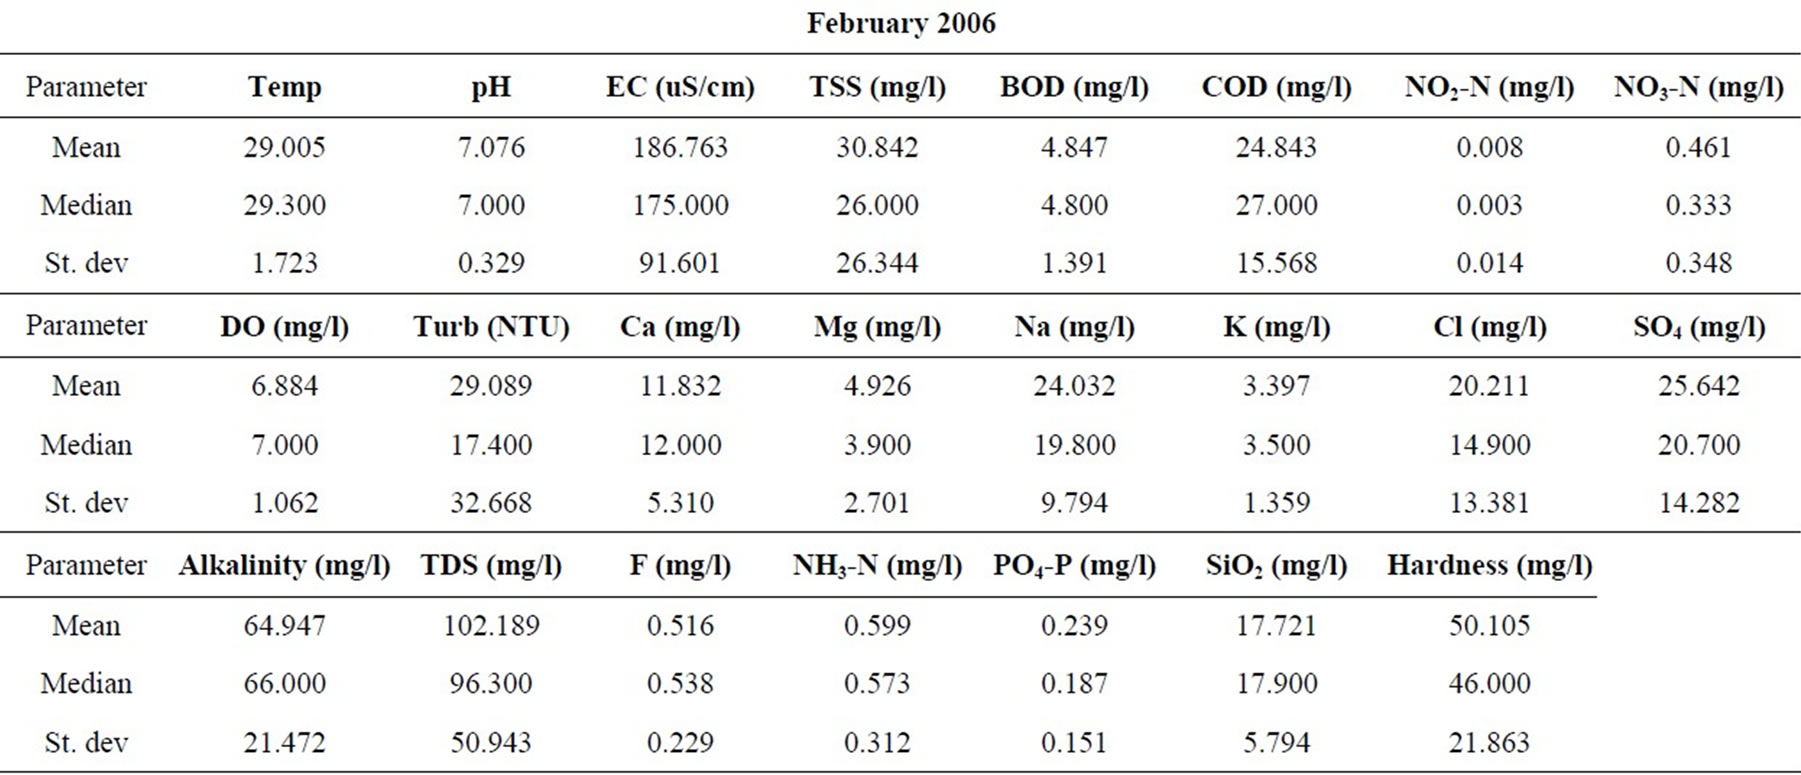
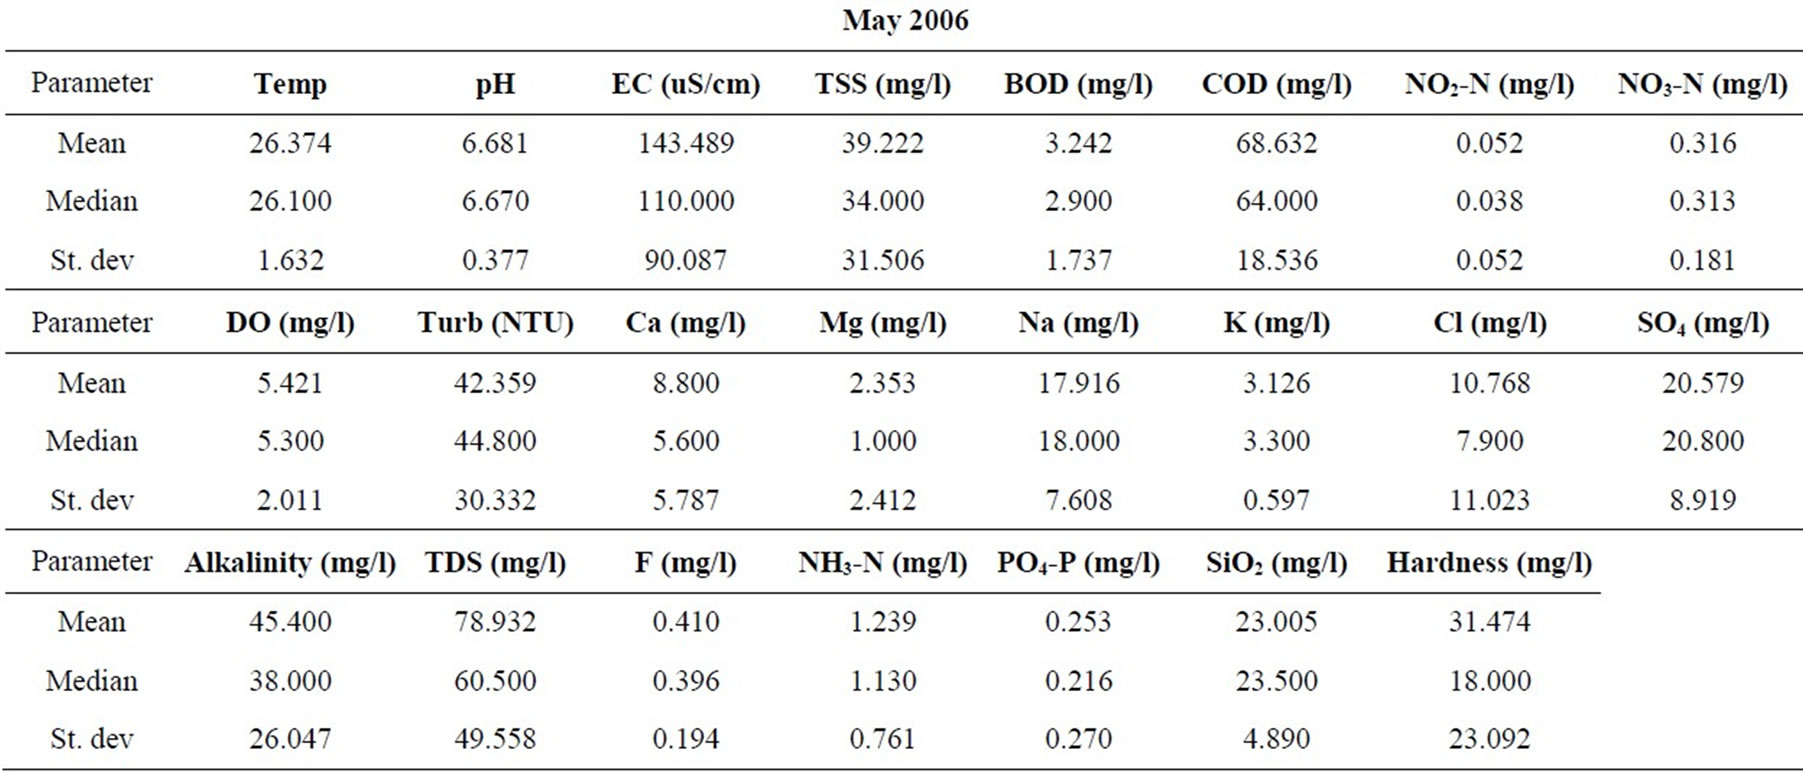
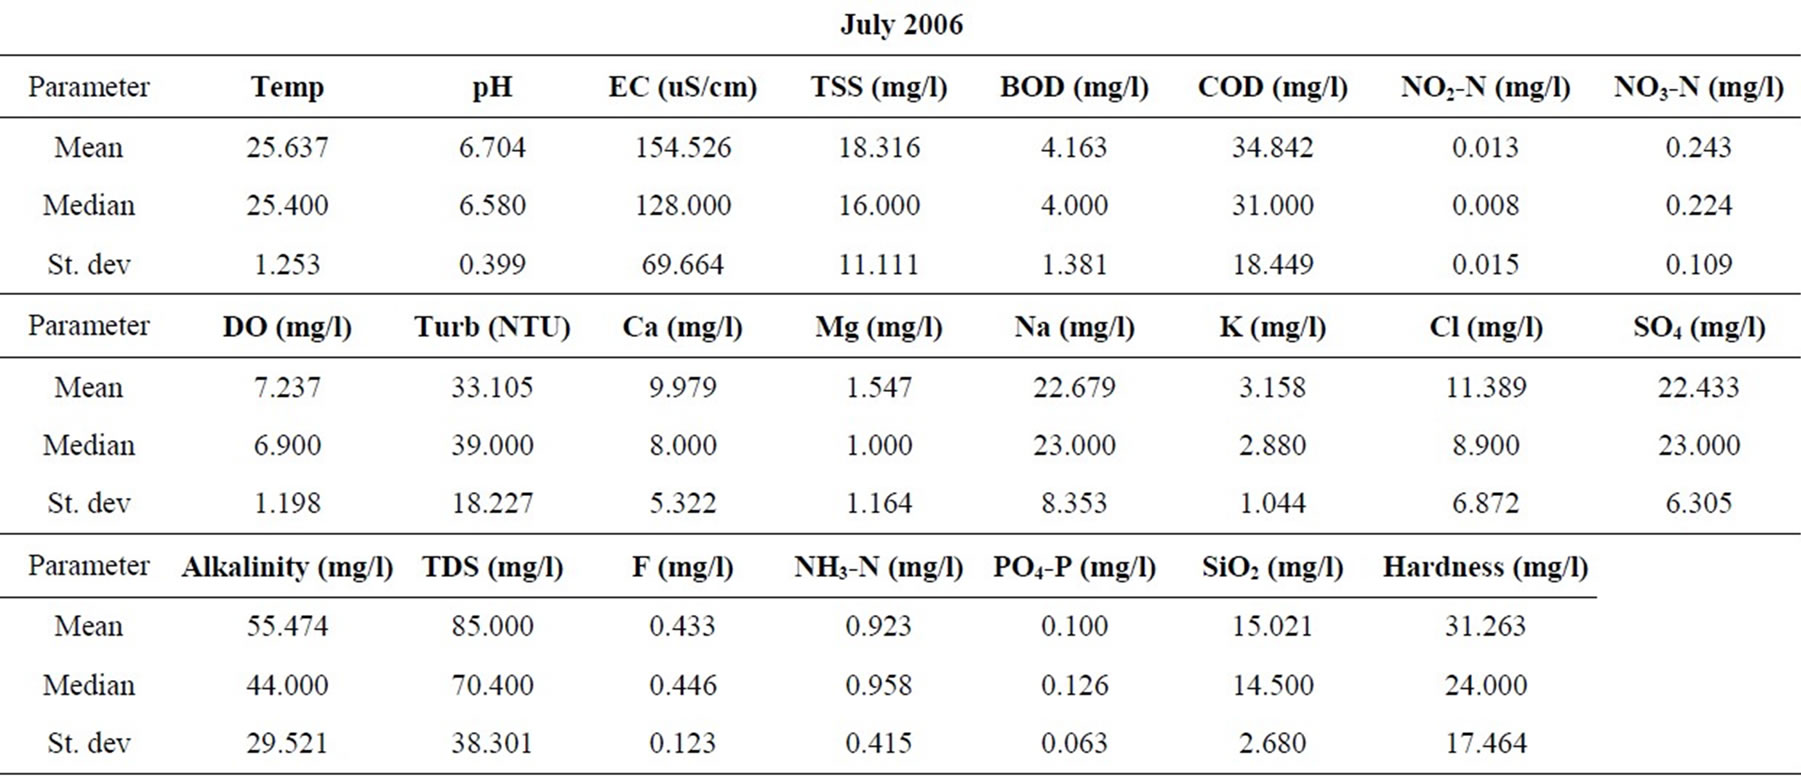
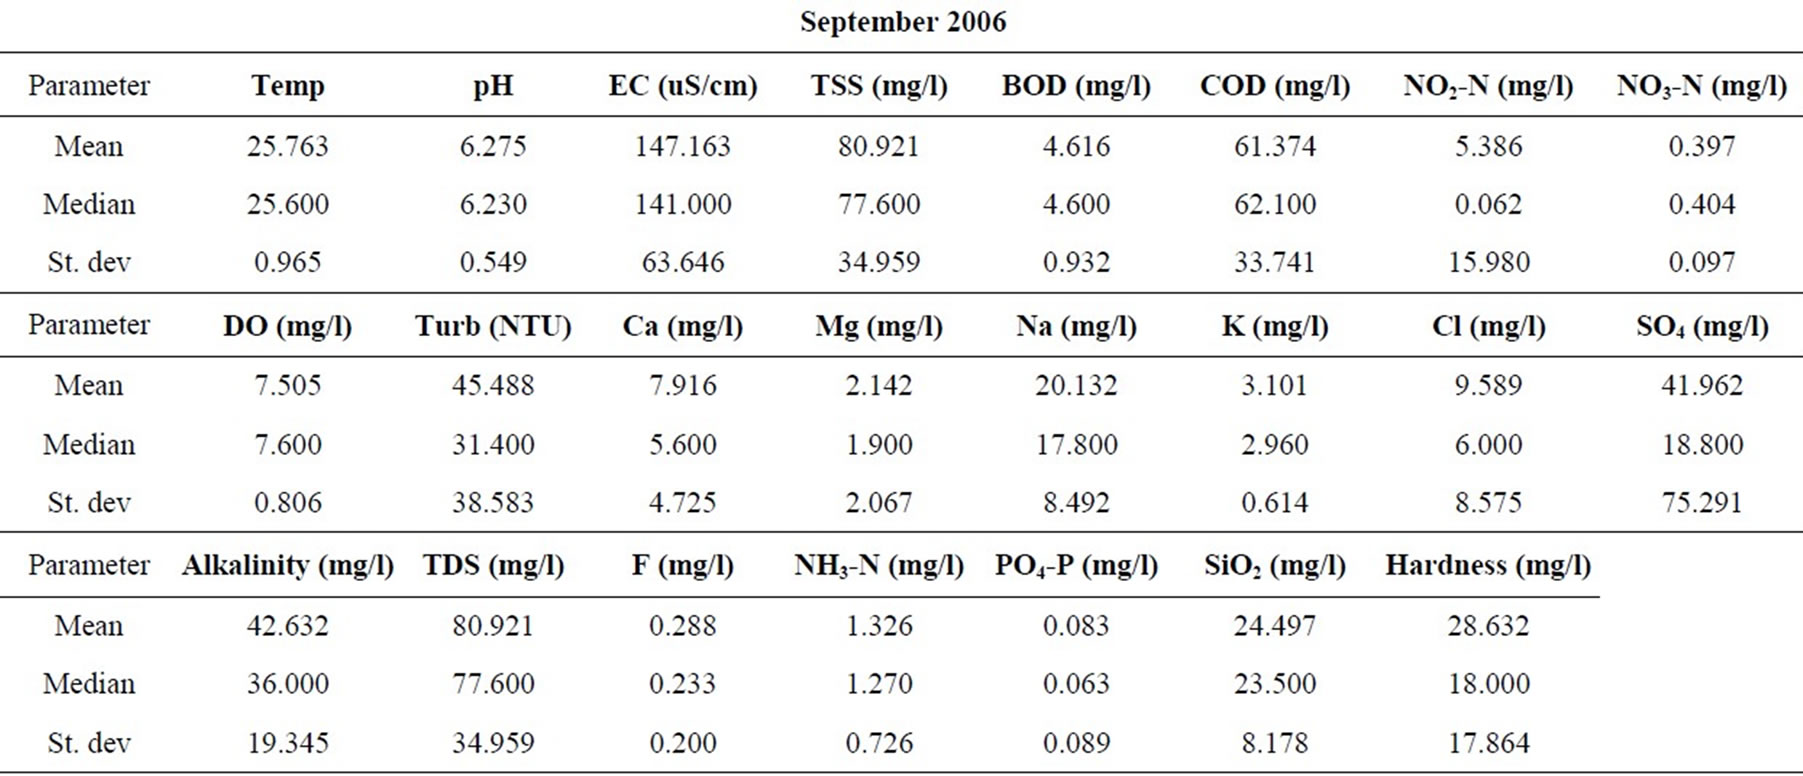
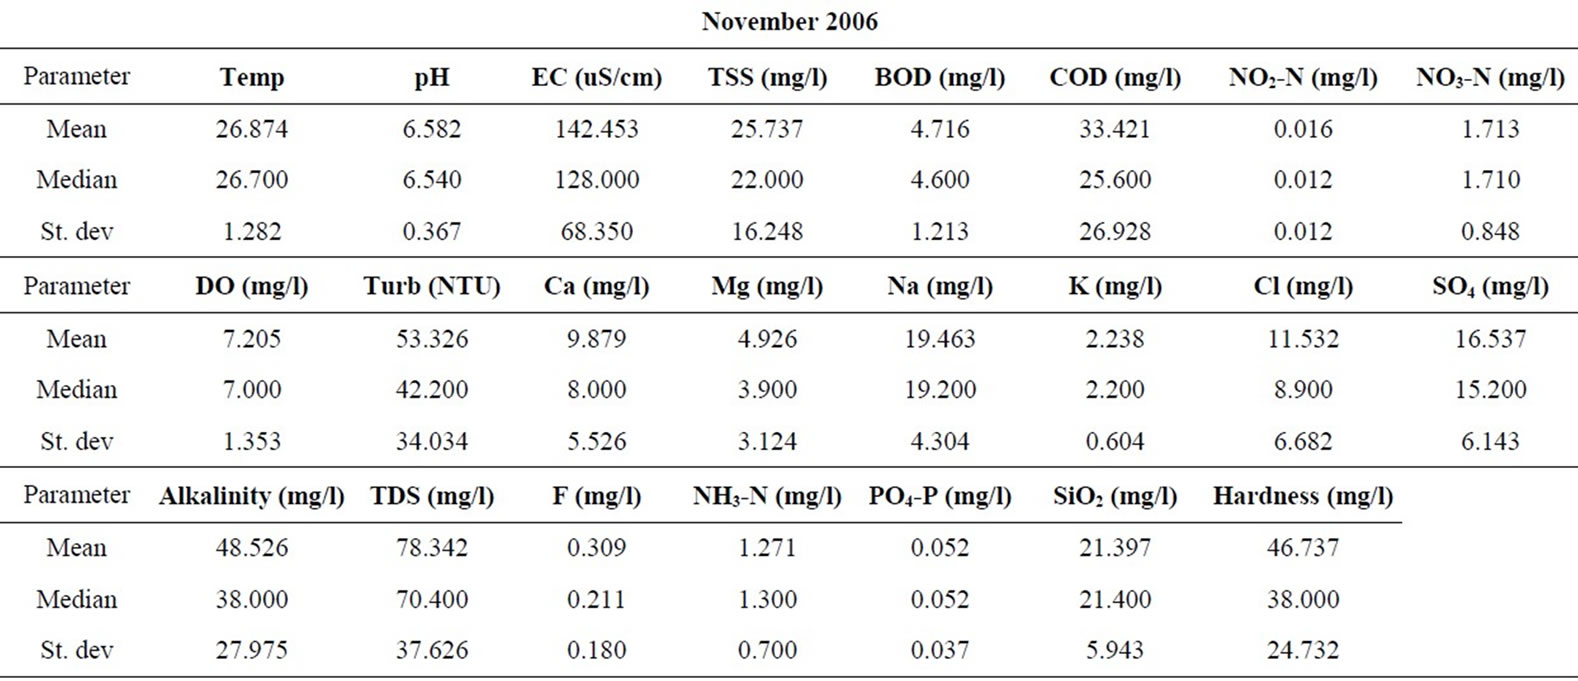
Table 1. Summary of the water quality data (February 2008).
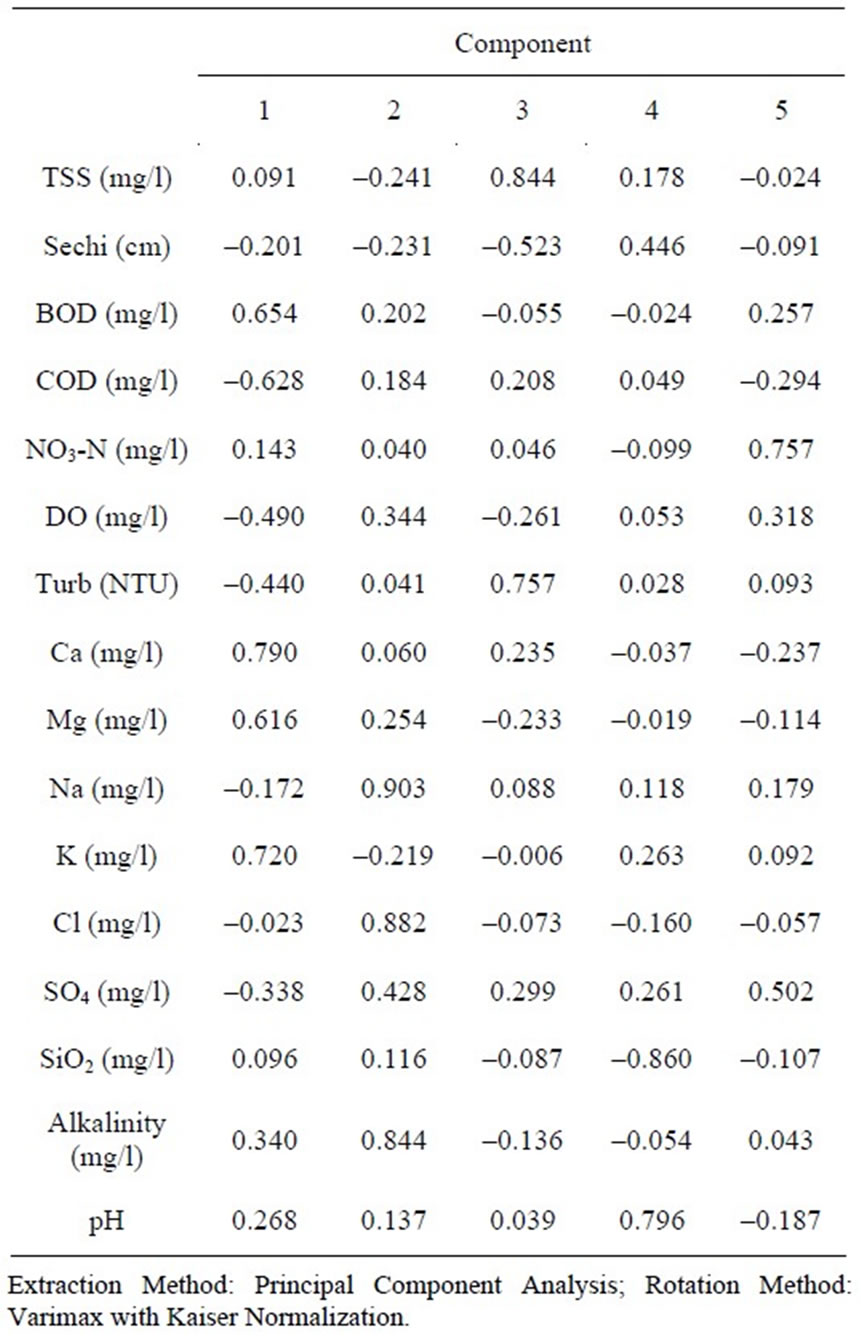
Table 2. Rotated factor model for the coastal and southwestern river basins.
contamination. Factor 1 also loads negatively with DO, suggesting that this factor is associated with processes which consume the dissolved oxygen content of the water. The oxidation of organic carbon from various contamination sources, will certainly involve a reduction in the DO content of the water since raw oxygen is the most powerful oxidant of organic matter. This suggests that factor 1 represents contamination from solid waste disposal, which apparently is the source of the major cations in the hydrochemistry. Factor 1 represents the effects of the improper disposal of solid waste with significant metal content in the area. Refuse dumps are rampant in the vicinities of these river systems, and as runoff from rainfall is the major recharge, leachates from these dumps find their way into the flows.
Factor 2 loads positively with Na+ and Cl– ions and obviously represents the contribution of the chemistry of rainfall, and the dissolution of halite in the soils, to the hydrochemistry of the river basins in the area. This is the second most important process controlling surface water hydrochemistry in the area. There is a reasonably strong relationship between Na+ and Cl– ions in the hydrochemistry (Figure 2). Such strong relationships are characteristics of the contribution of recharging rainwater, and /or the weathering of halite in the underlying sediments. Earlier studies [5,6] suggest rainfall and the weathering of underlying bedrock and sediments as the major sources of variation in the hydrochemistry of the Ankobra River and surrounding areas. Such studies were based on the major ion content and silica, and did not include the BOD, COD, and DO contents. The role of solid waste disposal in the hydrochemistry may have been shielded because these parameters were not included in the overall assessment of the quality control parameters.
The third factor loads positively with total suspended solids (TSS) and turbidity, and obviously loads nega-
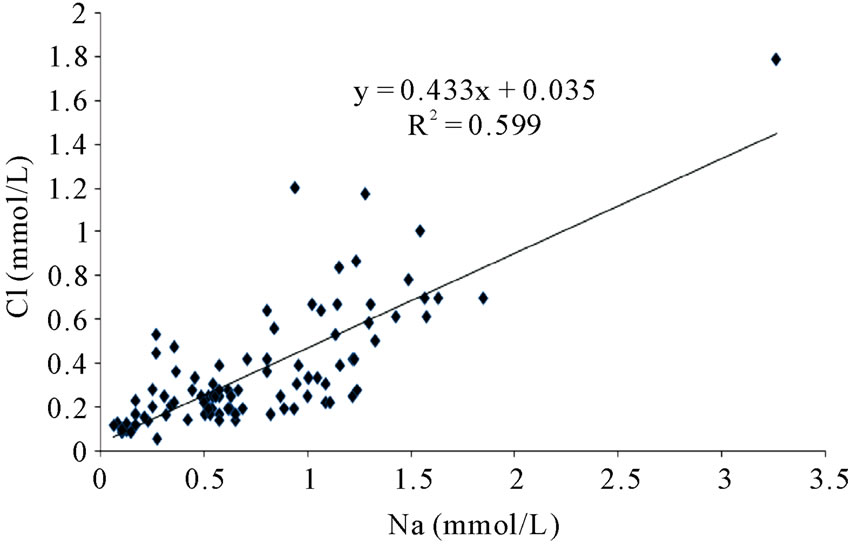
Figure 2. The relationship between Na and Cl ions in the area.
tively with Sechi which measures the degree of transparency of the water. Factor 3 therefore represents the enrichment of the suspended load of the river basins in the area. Turbidity and TSS content of water are directly related to each other and therefore have a common source. The effects of surface mining activities, especially the illegal activities of artisanal miners, popularly called “galamsey” operators in the Western Region have been blamed for the increasing suspended load of the river basins. Factor 3, the turbidity factor, therefore represents the effects of surface mining activities on surface water quality in the study area. Pollution of water bodies by illegal surface mining activities and its deleterious effects on aquatic life and terrestrial ecosystem in the Western Region and other parts of the country represent a major environmental issue that has been the cause for concern over the years. In addition to the problems of turbidity, some heavy and toxic metals sometimes find their way into the water bodies leading to the poisoning of the aquatic organisms. High turbidity in water hampers the smooth movement of aquatic organisms and can cause death. The position of surface mining activities in the scheme of factors influencing surface water hydrochemistry is significant, in that it ranks after solid waste contamination and the contribution of rainfall hydrochemistry. This study did not include the conventional contaminants such as mercury and other heavy metals which are usually associated with mining operations in the area. Since the inception of mining activities in the Western Region, there have been reports of contamination of surface water bodies in the area. These range from increases in turbidity which hampers aquatic life and renders the water unattractive for human consumption, to chemical spills [16].
Factor 4 has high positive loading with pH, and loads negatively with SiO2 suggesting that the processes controlling these parameters are divergent or orthogonal. This factor represents the weathering of silicate minerals in the underlying lithology. The incongruent weathering of silicate minerals requires acid medium to be effective. As the pH of the medium increases, the propensity of these silicate weathering processes reduces. It is on account of this fact that these parameters load negatively with each other in the hydrochemistry. Silicate weathering is certainly not a major process controlling surface water hydrochemistry in the area. This finding is not surprising due to the fact that silicate weathering processes play significant roles only when the residence time of the water over the underlying sediment and basement rock is long enough. For silicate mineral weathering to contribute significantly to the hydrochemistry, residence times as long as a couple of millions of years will be necessary. In the case of river basins, the residence time is rather short, resulting in shorter periods of contact between rocks and the water. This is contrary to the findings with respect to the major controls on groundwater hydrochemistry at most of the basins in Ghana, where general mineral weathering processes have been determined to be the major sources of variation in the hydrochemistry [3,7].
The final factor in the factor model has high positive loadings for NO3-N, and  and represents the contribution of agricultural chemicals to the hydrochemistry of these surface water basins. Nitrateand sulfate-rich fertilizers and manures are extensively used in farms and backyard irrigation schemes. Some of the irrigation schemes involve the use of surface water from some of the river basins under study. The excess fertilizer is washed into the river systems, thus raising the nitrate and sulfate levels beyond their natural concentrations. Obviously, the raw concentrations of these parameters and the results of the factor analyses do not ascribe any significance to these processes in the hydrochemistry of surface water basins in the study area. The critical national standard for NO3-N in portable water is 10 mg/l. Nitrate-N concentrations in the area over the period of the analyses are largely lower than 1.00 mg/l, and the highest concentration is a little over 3 mg/l. The critical maximum permissible concentration of
  in potable water is 200 mg/l. Sulfate concentrations in the area over the period of the analyses, are lower than 50 mg/l in most cases, suggesting that contamination from agricultural chemicals are not significant enough to cause any health hazards.
The results of the R-mode HCA reproduced the results of the factor analysis (Figure 3). The dendrogram is the visual product of the HCA and in the case of the R-mode, the parameters (hydrochemical variables) are grouped into associations based on similarities/dissimilarities in the trends of their levels/concentrations in the field. Parameters which trend similarly in the field will be linked to each other at closer linkage distances than those that are dissimilar in the field. Figure 3 is the dendrogram for the R-mode HCA. A phenon line is drawn across the dendrogram at a preferred linkage distance in order to separate and distinguish the resulting clusters. Five clusters (groups) have been differentiated. Group 1 members are the most similar amongst all the groups. This group contains Na+, Cl–, TDS, hardness and alkalinity. Sodium and Cl– ions are connected at a linkage distance of about 2, suggesting that the relationship between these two ions in the field is close and they vary in tandem. Alkalinity and TDS are also joined at a distance of about 2, and connected to the Na-Cl sub-cluster and hardness at a distance of about 3. Total dissolved solids and EC were both rejected in the R-mode factor analysis due to low communalities after the first trial of the analysis. They were therefore not part of the final factor model. The TDS appears to vary with Na+ and Cl– ion enrichment.
Group 2 contains BOD, K, Ca, and Mg, and mirrors factor 1 of the factor analysis. The connecting distances further suggest that K+ and Ca2+ are more closely related to the BOD content of the water than does the Mg2+ ion. Groups 3, 4, and 5 respectively mirror factors 3, 4, and 5 of the final factor model. The dendrogram includes some more parameters than could be included in the factor model. Most of such factors were excluded from the factor model on account of low communalities. Their inclusion on the dendrogram assists in the explanation of the trends represented by each of the water associations reproduced by the HCA and when compared to the factor model, the probable sources of some of these parameters can be deduced. For instance both total phosphorus (TotP) content and  concentrations are linked to the turbidity, which suggests that there is some component of the turbidity which is attributable to domestic waste. It is, however imperative to state that some of the associations may not necessarily be causative since statistical associations do not necessarily suggest causative relationships. For instance NH3-N, and total nitrogen are in the same group as SiO2. Whereas this may suggest that some component of the silica content of the water may be of organic origin, it does not necessarily indicate that the two parameters have a common source. In the study area, the relationship between SiO2 and NH3-N might be more complex. It might be related to the conditions that accompany their production. Silicate mineral weathering requires acid media to be effective, and the effect on the medium is an increase in pH. NH3-N is also associated with high pH.
The Q-mode HCA is presented in Figure 4. The water associations generally go along the lines of the river basins being studied. Two surface water associations have been distinguished in Figure 4. Group 1 members are mainly from the southwestern river basins, whilst group 2 members are drawn from the coastal river systems.
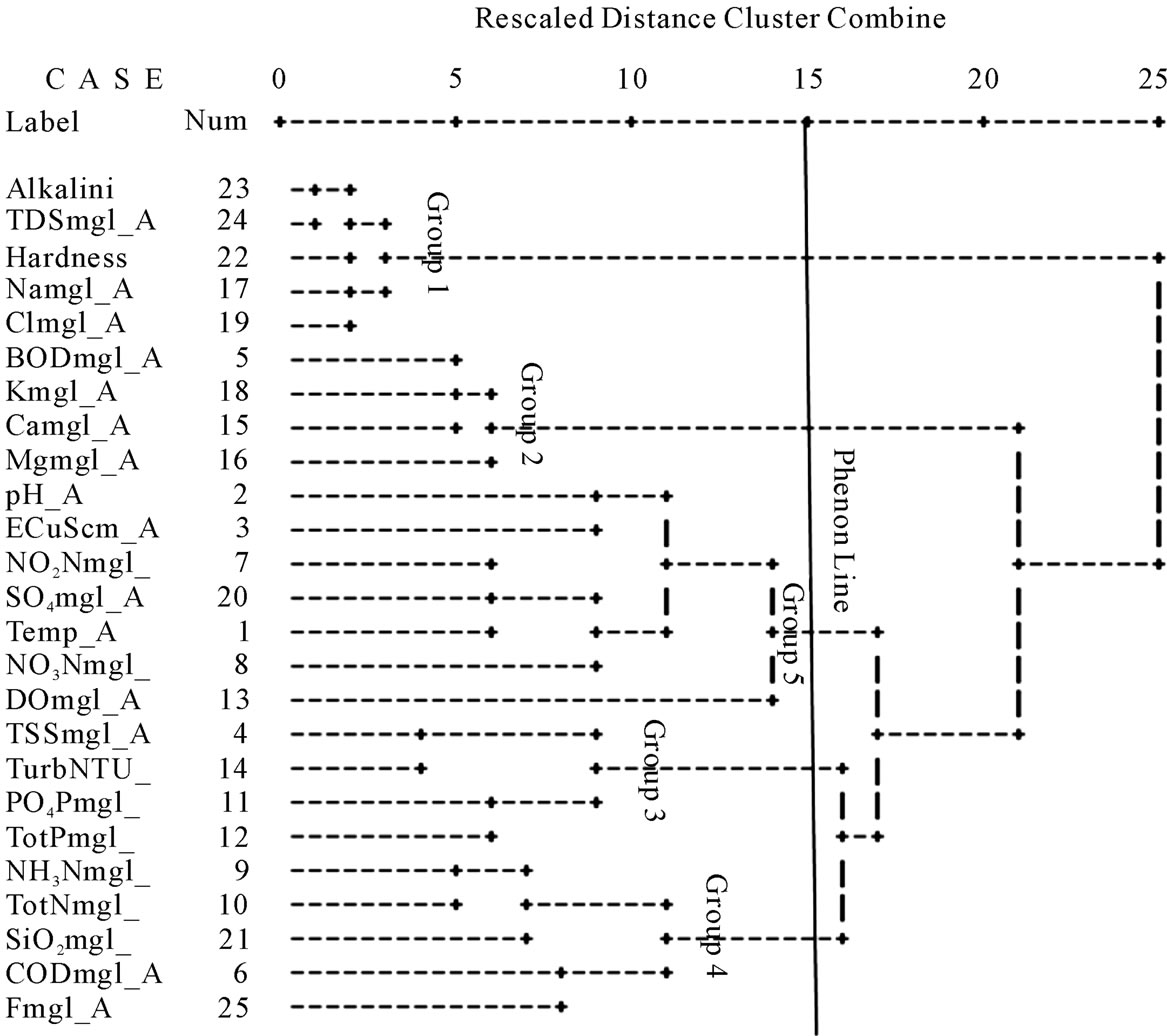
Figure 3. Dendrogram showing the results of the R-mode HCA.
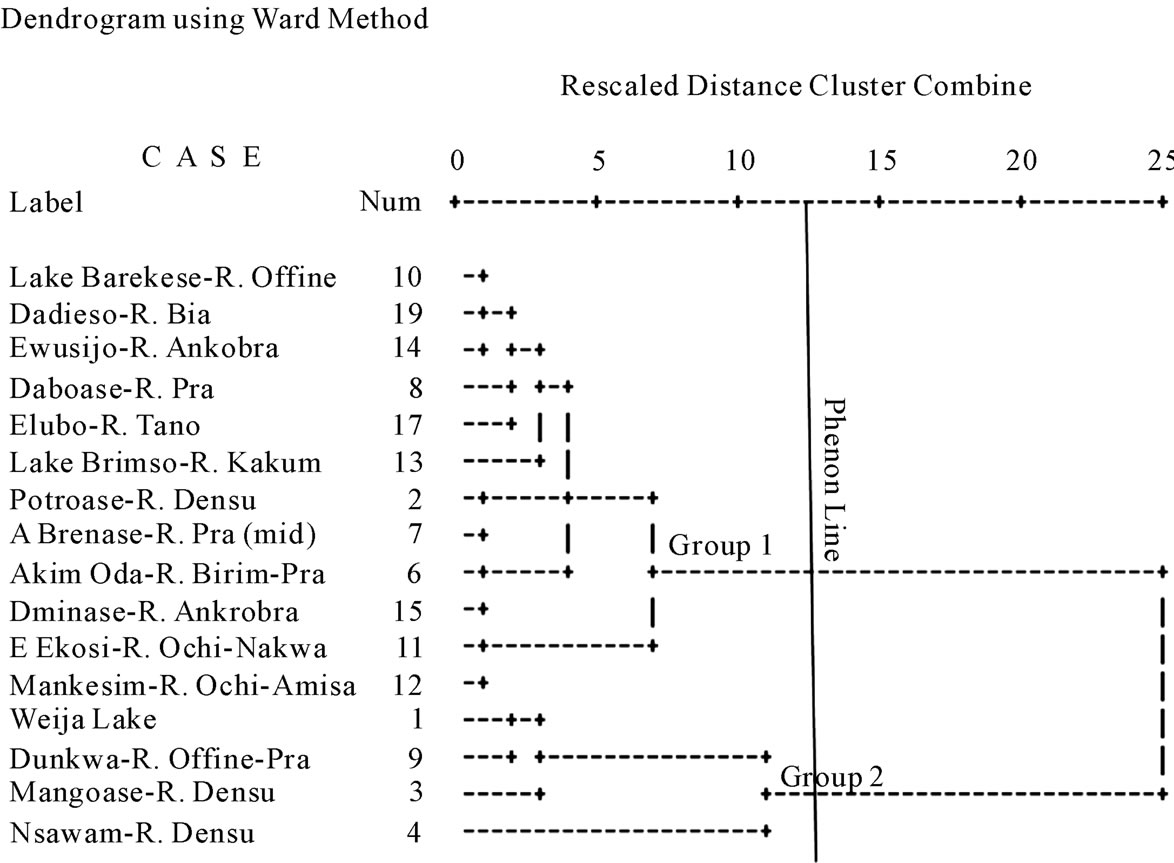
Figure 4. Dendrogram from the Q-mode HCA.
Summaries of the parameters in each group are presented in Figure 5. In general, mean and median concentrations of the parameters in group 1 are higher than those of group 2. Both surface water associations are Na-K-HCO3 water types (Figure 6). It appears that the southwestern river basins are much more enriched in terms of all the parameters than the coastal river basins. The significant finding from the Q-mode HCA is the clear differentiation of the two river systems in the area, which provides once again, another helpful use of HCA in environmental data analyses. The apparently higher concentrations of the major parameters in the southwestern river basins is attributed to the effects of surface mining activities in the Western Region, which are responsible for a significant proportion of the major ions in the water.
4.2. Irrigation Quality of Water from the Study Area
The assessment of the quality of water from the study area for irrigation is based on the salinity and sodium content relative to the concentrations of the other major cations in the water system. Extremely high salinities in irrigation waters have several adverse effects on both the irrigation soil and the crops being irrigated. High salinities affect plants both physically and chemically. High salinity waters reduce the osmotic ability of plants and thus interfere with the capacity of plants to absorb water from the soils and transport it to the branches and leaves [17]. This leads to a physiological drought of the plant although there may be a lot of water in the soil. This condition can cause the wilting of plants leading to death. In addition to the salinity effects, high concentrations of specific ions such as sodium, bicarbonate, and boron can be lethal to irrigation crops. Even if the salinity is low, high concentrations of these ions can interfere with the ability of plants to absorb water from soils. The long term effects of using high salinity waters for irrigation is the accumulation of salts in soils, leading to a reduction in the hydraulic properties of irrigation soils with time. When this happens, the ability of such soils to support optimum plant growth and development is greatly affected.
Figure 7 illustrates the variability of SAR values from one location to the other, and from one season to the next. Although the SAR values are generally low (below 4), the highest values for all seasons were recorded in September 2006 in Ekosi. The lowest seasonal variations were recorded in Lake Barekese. The low values in these areas are attributed to the relatively higher concentrations of the alkaline earth metals than the alkali metals in these areas.
Figure 8 presents the USSL [15] diagram for the study area. Both salinities and the sodium content are low in the study area as obviously shown in Figure 8. About 90% of the samples plot within the C1-S1 category and the remaining 10% plot within the C2-S1 region. This suggests that the use of water from the coastal and southwestern river basins in Ghana for irrigation will not pose sodium or salinity effects. This is however dependent on the conditions of the soils. Although the salinities are generally low, poor drainage can lead to the retention of salts in the soil zone, thus leading to the accumulation of salts in these soils over the long term. The Wilcox [2]
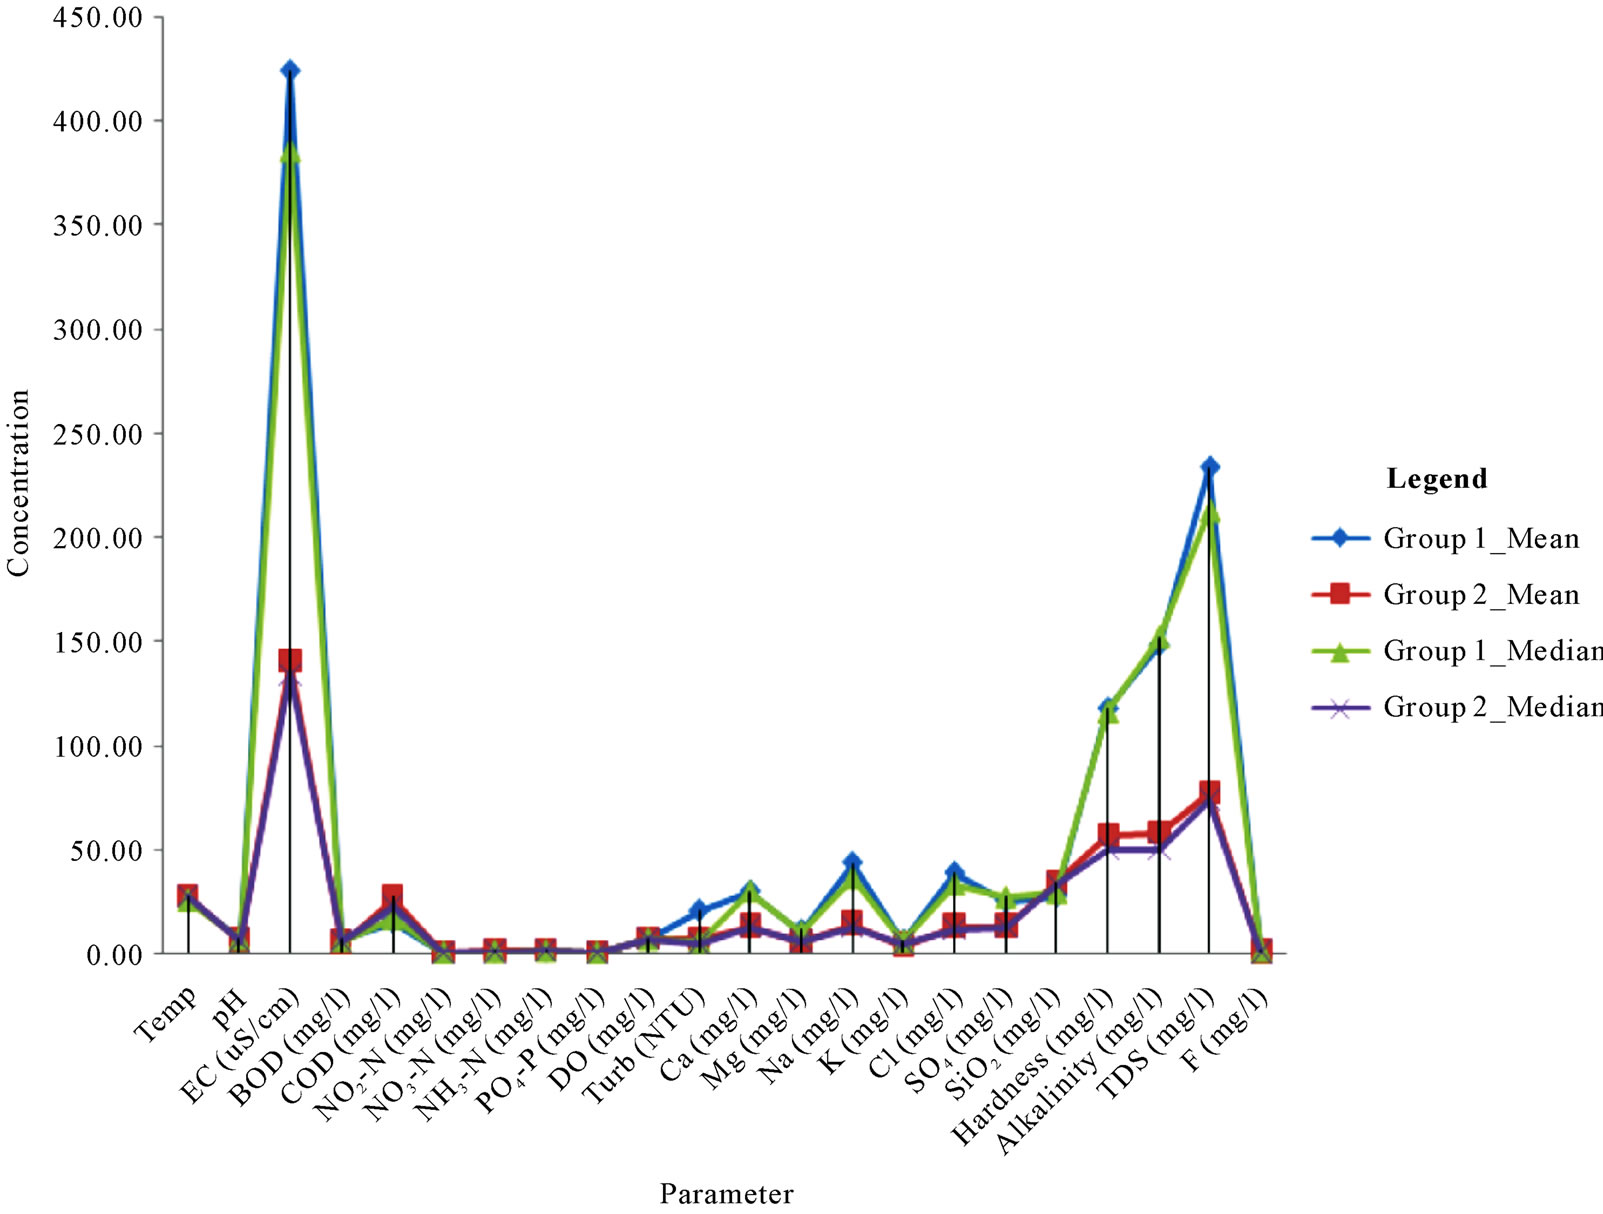
Figure 5. Summaries of the concentrations of the major parameters in clusters 1 and 2 from the Q-mode HCA.
 (a) (b)
Figure 6. (a) Stiff diagram for the average of the concentrations of the major ions in cluster 1 from the Q-mode HCA; (b) Stiff diagram for the average of the concentrations of the major ions in cluster 2 from the Q-mode HCA.
diagram (Figure 9) confirms this and ascribes “excellent to good” irrigation quality to all the areas sampled. The generally low concentrations of the physico-chemical parameters in the water is responsible for the low SAR and EC values, which have together influenced the irrigation quality of the surface water from the area. These generally low concentrations of the physico-chemical parameters suggest that the waters are largely pristine and have low residence times over the underlying lithology. Just as pertains in regional groundwater flow systems, surface water in the neighborhood of the discharge areas, after a long period of travel, is expected to have high concentrations for the major quality parameters. Low concentrations are characteristic of recharge areas or recently recharged surface waters. In the case of the study area, the concentrations are frequently diluted by rainfall which occurs two times in the year at most places in the locations sampled.
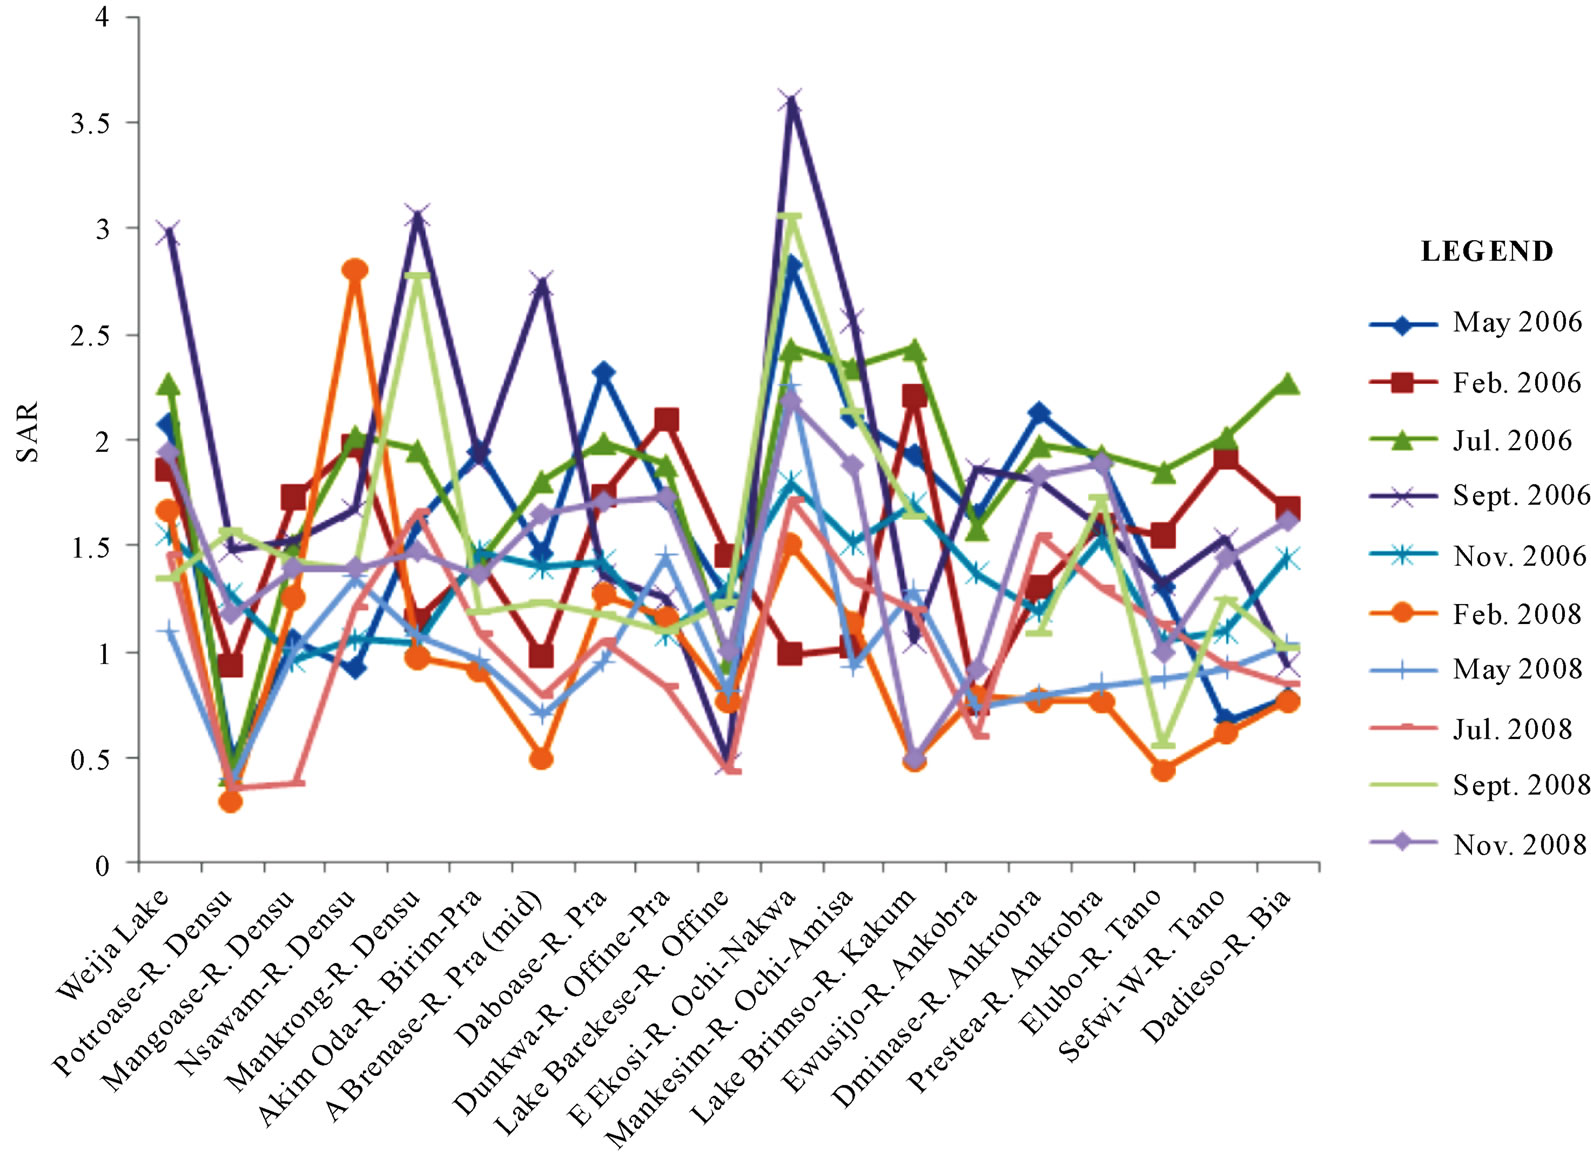
Figure 7. Spatial and temporal variations of SAR in the area.

Figure 8. Assessment the irrigation quality of water from the study area using the USSL (1954) methodology.
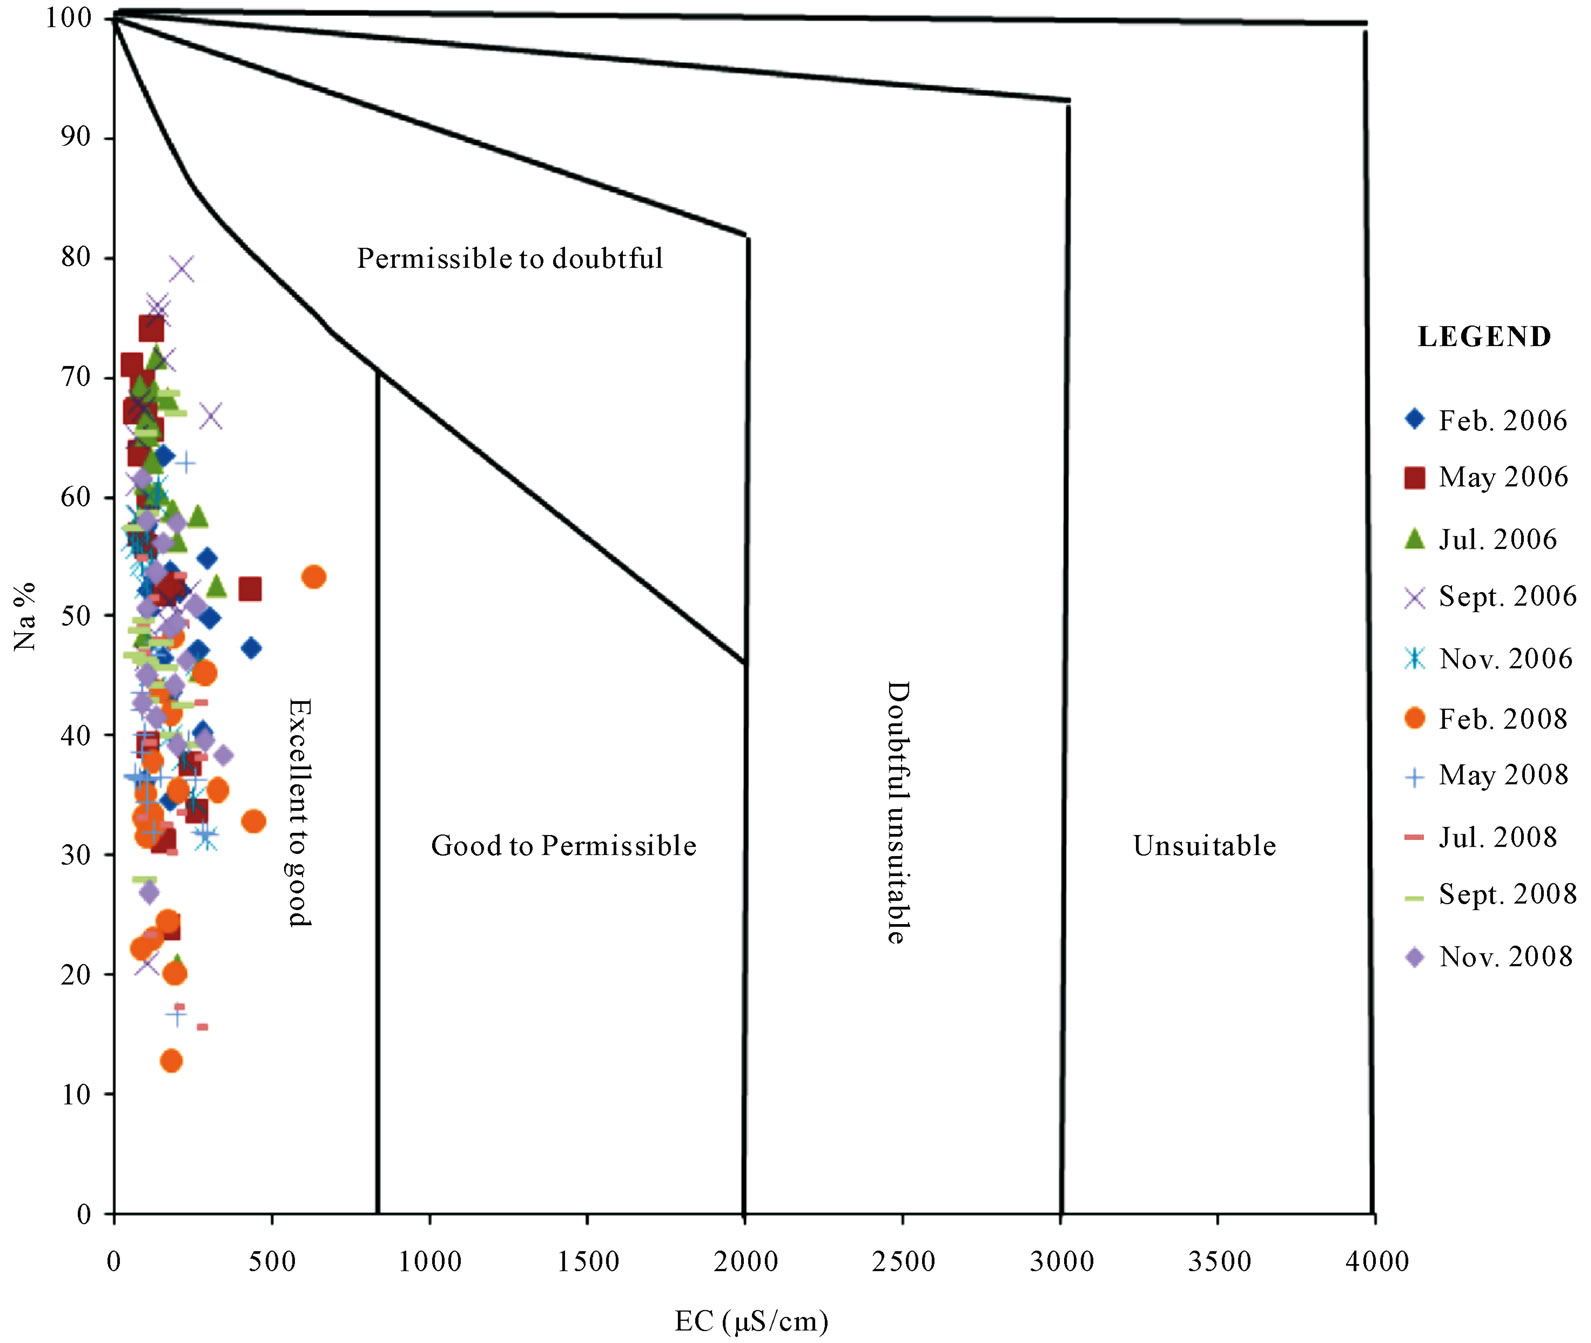
Figure 9. Wilcox (1955) diagram for assessing the irrigation quality of surface water from the Coastal and Southwestern River Basins.
5. Conclusions
Surface water from the southwestern and coastal river basins was sampled to assess the major causes of variation in the hydrochemistry, and the suitability of water from these basins for irrigation purposes. Irrigation has been envisaged as a viable alternative or compliment to the current rain fed agriculture. Irrigation is one of the many intervention measures that have been introduced to circumvent the ramifications of global climate change which have led to drastic changes in the rainfall distribution in the country. This study has shown that the concentrations of the major parameters are low and below the regulated limits for domestic uses. The hydrochemistry is principally controlled by contamination from solid waste, rainfall chemistry, silicate mineral weathering and agricultural chemicals in that order of importance. Leachate from solid wastes from domestic and mining activities in the area is the principal mechanism controlling the major ion content of surface water from both the southwestern river basins and the coastal river systems in Ghana. Silicate mineral weathering has no significant role. This is partly attributed to the fact that unlike groundwater, the residence times of the waters in the surface water basins is rather too short to encourage significant rock-water interactions. Due to the low salinities and SAR values, the water from both river systems is suitable for irrigation without the prospect of causing sodium effects and high salinity effects in irrigation waters.
REFERENCES
- A. M. Al-Bassam and Y. A. Rumikhani, “Integrated Hydrochemical Method of Water Quality for Irrigation in Arid Areas: Application to the Jilh Aquifer, Saudi Arabia,” Journal of African Earth Sciences, Vol. 36, No. 4, 2002, pp. 345-356.
- L. V. Wilcox, “Classification and Use of Irrigation Water,” US Department of Agriculture, Circ. 696, Washington DC, 1955.
- S. M. Yidana, “Groundwater Classification Using Multivariate Statistical Methods: Southern Ghana,” Journal of African Earth Sciences, Vol. 57, No. 5, 2010, pp. 455- 469. doi:10.1016/j.jafrearsci.2009.12.002
- R. S. Ayers and D. W. Westcot, “Water Quality for Agriculture,” FAO Irrigation and Drainage Paper, No. 29, Rev. 1, 1985.
- S. M. Yidana, D. Ophori and B. Banoeng-Yakubo, “A Multivariate Statistical Analysis of Surface Water Chemistry Data—The Ankobra Basin, Ghana,” Journal of Environmental Management, Vol. 86, No. 1, 2008, pp. 80- 87. doi:10.1016/j.jenvman.2006.11.023
- S. M. Yidana, “The Hydrochemical Framework of Surface Water Basins in Southern Ghana,” Environmental Geology, Vol. 57, No. 4, 2009, pp. 789-796. doi:10.1007/s00254-008-1357-2
- B. Banoeng-Yakubo, S. M. Yidana and E. Nti, “An Evaluation of the Genesis and Suitability of Groundwater for Irrigation in the Volta Region, Ghana,” Environmental Geology, Vol. 57, No. 5, 2009, pp. 1005-1010. doi:10.1007/s00254-008-1385-y
- S. M. Yidana, B. Banoeng-Yakubo and T. M. Akabzaa, “Analysis of Groundwater Quality Using Multivariate and Spatial Analyses in the Keta Basin, Ghana,” Journal of African Earth Sciences, Vol. 58, No. 2, 2010, pp. 220- 234. doi:10.1016/j.jafrearsci.2010.03.003
- Center for Scientific and Industrial Research (CSIR), “Water Quality Monitoring of the South Western and Coastal River Basins,” Annual Water Quality Monitoring and Assessment Report, 2007, 62 Pages.
- K. B. Dickson and G. Benneh, “A New Geography of Ghana,” Longman, London, 1980.
- J. C. Davis, “Statistics and Data Analysis in Geology,” John Wiley & Sons Inc., New York, 1986.
- C. Güler, G. D. Thyne, J. E. McCray and A. K. Turner, “Evaluation of the Graphical and Multivariate Statistical Methods for Classification of Water Chemistry Data,” Hydrogeology, Vol. 10, No. 4, 2002, pp. 455-474. doi:10.1007/s10040-002-0196-6
- V. Cloutier, R. Lefebvre, R. Therrien and M. Savard, “Multivariate Statistical Analysis of Geochemical Data as Indicative of the Hydrogeochemical Evolution of Groundwater in a Sedimentary Rock Aquifer System,” Journal of Hydrology, Vol. 353, No. 3-4, 2008, pp. 294-313. doi:10.1016/j.jhydrol.2008.02.015
- H. F. Kaiser, “The Application of Electronic Computers to Factor Analysis,” Educational and Psychological Measurement, Vol. 20, No. 1, 1960, pp. 141-151. doi:10.1177/001316446002000116
- USSL, “Diagnosis and Improvement of Saline and Alkali Soils,” USDA, Handbook 60, 1954, p. 147.
- D. Kosich, “Ahafo Mine Cyanide Spill Prompts NGOs to Question International Cyanide Code Validity,” MineWeb, Accessed on 3 May 2010. http://mineweb.com/mineweb/view/mineweb/en/page72068?oid=96302&sn=Detail
- M. Jalali, “Salinization of Groundwater in Arid and Semi-Arid Zones: An Example from Tajarak, Western Iran,” Environmental Geology, Vol. 52, No. 6, 2007, pp. 1133-1149. doi:10.1007/s00254-006-0551-3