Journal of Water Resource and Protection
Vol. 1 No. 5 (2009) , Article ID: 861 , 17 pages DOI:10.4236/jwarp.2009.15037
Upstream-Downstream Relationships in Terms of Annual Streamflow Discharges and Drought Events in Nebraska
1Texas Institute for Applied Environmental Research, Tarleton State University, Stephenville, USA
2Department of Computer Science and Engineering, University of Nebraska-Lincoln, Reno, USA
3Department of Statistics, University of Nebraska-Lincoln, Reno, USA
4School of Natural Resources, University of Nebraska-Lincoln, Reno, USA
E-mail: lksoh@cse.unl.edu
Received July 21, 2009; revised August 19, 2009; accepted August 26, 2009
Keywords: Streamflow Drought, Upstream-Downstream Relationship, Paired T-Test, Repeated Measures ANOVA with MIXED Procedure, Nebraska
ABSTRACT
Upstream-downstream relationships of annual streamflow discharges and severity and frequency of streamflow drought events are critical in understanding how streamflow droughts propagate over time and space. Such information can be used to resolve water disputes, trigger mitigation strategies, and understand how streamflow changes due to changes in the environment. During drought years, such information is even more critical as water resources are contested. The objective of this research is to study the upstream-downstream relationships of streamflow in Nebraska along four major river systems with diverse hydrologic characteristics and human activities: North Platte, Big Blue, Republican, and Niobrara. The relationships among the upstream and downstream stations along the four rivers are investigated by comparing several statistics derived from the annual flow discharge and on drought events. Trend analysis and coefficient of variation are applied to annual flow discharge values, and a host of drought-related parameters (e.g., annual maximum drought duration, annual accumulated drought duration, number of drought events) are also computed with respect to five different levels of streamflow drought events: water shortage, mild drought, moderate drought, significant drought, and extreme drought. The paired-t test and ANOVA with MIXED procedure are subsequently applied to the statistics to observe whether there is a significant difference between upstream and downstream stations along a river. The analysis allows us to characterize the upstream-downstream relationships of the four river systems, laying the groundwork for further investigations to identify the reasons for some of the trends and observations. These findings will be essential in water resources management during or prior to hydrological droughts.
1. Introduction
About 40 percent of the world population lives in 250 major river basins that are shared by multiple countries [1]. Competing uses of these rivers have led to conflicts and disputes between upstream and downstream countries. Downstream water users are directly affected by the water use of the upstream counterparts and are vulnerable to water overuse and misuse upstream. The construction of reservoirs and dams can prevent flooding and drought conditions downstream. On the other hand, if the upstream dams do not release water because of drought or water needs of the reservoirs, serious consequences can occur downstream. If the upstream and downstream water scarcity differs, it could indicate that the causes are not only natural but also management related.
In the High Plains Region of the United States, water resources management is especially critical to rapidly expanding cities, rural communities, the management of public lands (national forests and grasslands, state parks, and wildlife refuges), agricultural communities, and the nation’s economy. But the competing demands have created many water conflicts among the users along the same river. Even more, droughts often accelerate the impacts of the water conflicts. During the peak of the 1934 drought, for example, downstream Nebraskans had little water for irrigation because the water users in Wyoming held back as much water as they could, leading to fiercely contested arguments between the two states [2].
Frequent and severe hydrological droughts result in serious environmental, economic, and social consequences in a region. One concern is that extreme hydrological events (e.g., floods and droughts) or observable, statistically significant trends in hydrological measurements will increase in frequency and magnitude. The possible causes for this trend include local and global climate variation and change, water regulations, industrial and urban water withdrawals, excessive irrigation and land use, and loss of vegetation cover [3−12]. If the magnitude and frequency of hydrological droughts change spatially and temporally, the impacts on water management, agriculture, and aquatic ecosystems will be significant. In view of this, water accounting strategies have also been proposed to take into account groundwater and surface water management to use water more productively in parts of the world with water shortages [13]. In addition, Wilhite [14] indicated that drought vulnerability shows an increasing trend. Therefore, the knowledge of the characteristics of hydrological drought event and its spatial and temporal variability is essential for the efficient management of water resources in a specific region.
Thus, the examination of the relationships of streamflow annual discharges and severity and frequency of streamflow droughts among the upstream and downstream stations will be helpful to understand the influence of human activities and its consequences during the low-flow periods. To accomplish this objective, this study investigates these relationships by 1) comparing the basic statistical characteristics (i.e., mean, standard deviation, coefficient of variation, and trend slope) on the annual flow discharges; and 2) comparing the statistics of drought-related parameters (i.e., annual maximum drought duration, annual accumulated drought duration, number of drought events per year, total number of drought events with a duration greater than three weeks, largest drought deficit and its time period, and longest streamflow drought duration and its time period). To facilitate the analysis, we also devise a definition for different levels of drought events based on low flow range. For each river system, we identify two sets of streamflow stations: upstream and downstream. We then compute the above statistics for each set. Subsequently, the pairedt test is performed on the trend slopes (as they are scalar values) while the MIXED procedure [15] is used on all other parameters to determine whether the difference between the upstream set and the downstream set along a river is significant. These values help us define upstream-downstream relationships along each of the four river systems in our study area.
2. Study Area
2.1. River Systems
The State of Nebraska in the United States was chosen as the pilot study area because Nebraska, located on the High Plains region, represents a dynamic test bed for the integration of water resources monitoring systems. Nebraska is the transition zone between humid, semiarid, and arid climates, with major streams transecting these climate regions [16]. This study focuses on four major rivers in climatically distinct regions in Nebraska—the North Platte, Niobrara, Big Blue and Republican, as shown in Figure 1.
The North Platte River, originated in Colorado and Wyoming, flows to Nebraska. It is the most important river in western Nebraska. The North Platte River has several small tributaries. A number of canals were constructed in the North Platte River valley for irrigation. Lake McConaughy and Kingsley Dam were constructed more than 60 years ago on the North Platte River for the purposes of irrigation, power development, and recreation. In the River valley, coarse alluvial materials form a principal aquifer unit where wells are constructed for irrigation. The North Platte River on the alluvial sediments can have a good hydrologic connection to the underlying aquifer. The annul precipitation from 1948 to 2001 in Scottsbluff of the North Platte River Valley, about 32 km to the western border of Nebraska, was 39.1 cm.
The Niobrara River originates in far eastern Wyoming and snakes across northern Nebraska. The river in Nebraska is about 491 km in length (Figure 1). The unique nature of this river is its diversity from its wide, verdant valleys to its steep sandstone canyons, waterfalls and cliffs. Thus, recreation such as canoeing, tubing and air boating, is the main activity. A number of small creeks join the river and two major tributaries, the Snake River and Key Paha River, are located down stream. Five dams are constructed in this basin, four on the Niobrara River and one on the Snake River. To the south of the river lies the unique grass-covered Sandhills where a large amount of groundwater is stored. Groundwater feeds numerous lakes and streams in the Sandhills area [17]. Groundwater irrigation exists in the Niobrara River valley but most irrigation wells concentrate in the upstream area. Annual precipitation at Valentine near the middle stream of the Niobrara River was 55.6 cm from 1948 to 2001.
The North Fork Republican River flowing through Colorado and the South Fork Republican River flowing through Kansas conjoin in Nebraska to form the Republican River, which drains southern Nebraska and eventually flows to Kansas. For the river reach in Nebraska, three creeks, Frenchman Creek, Red Willow Creek, and Medicine Creek, join the Republican River on its north side. Beaver Creek joins the Republican River on the
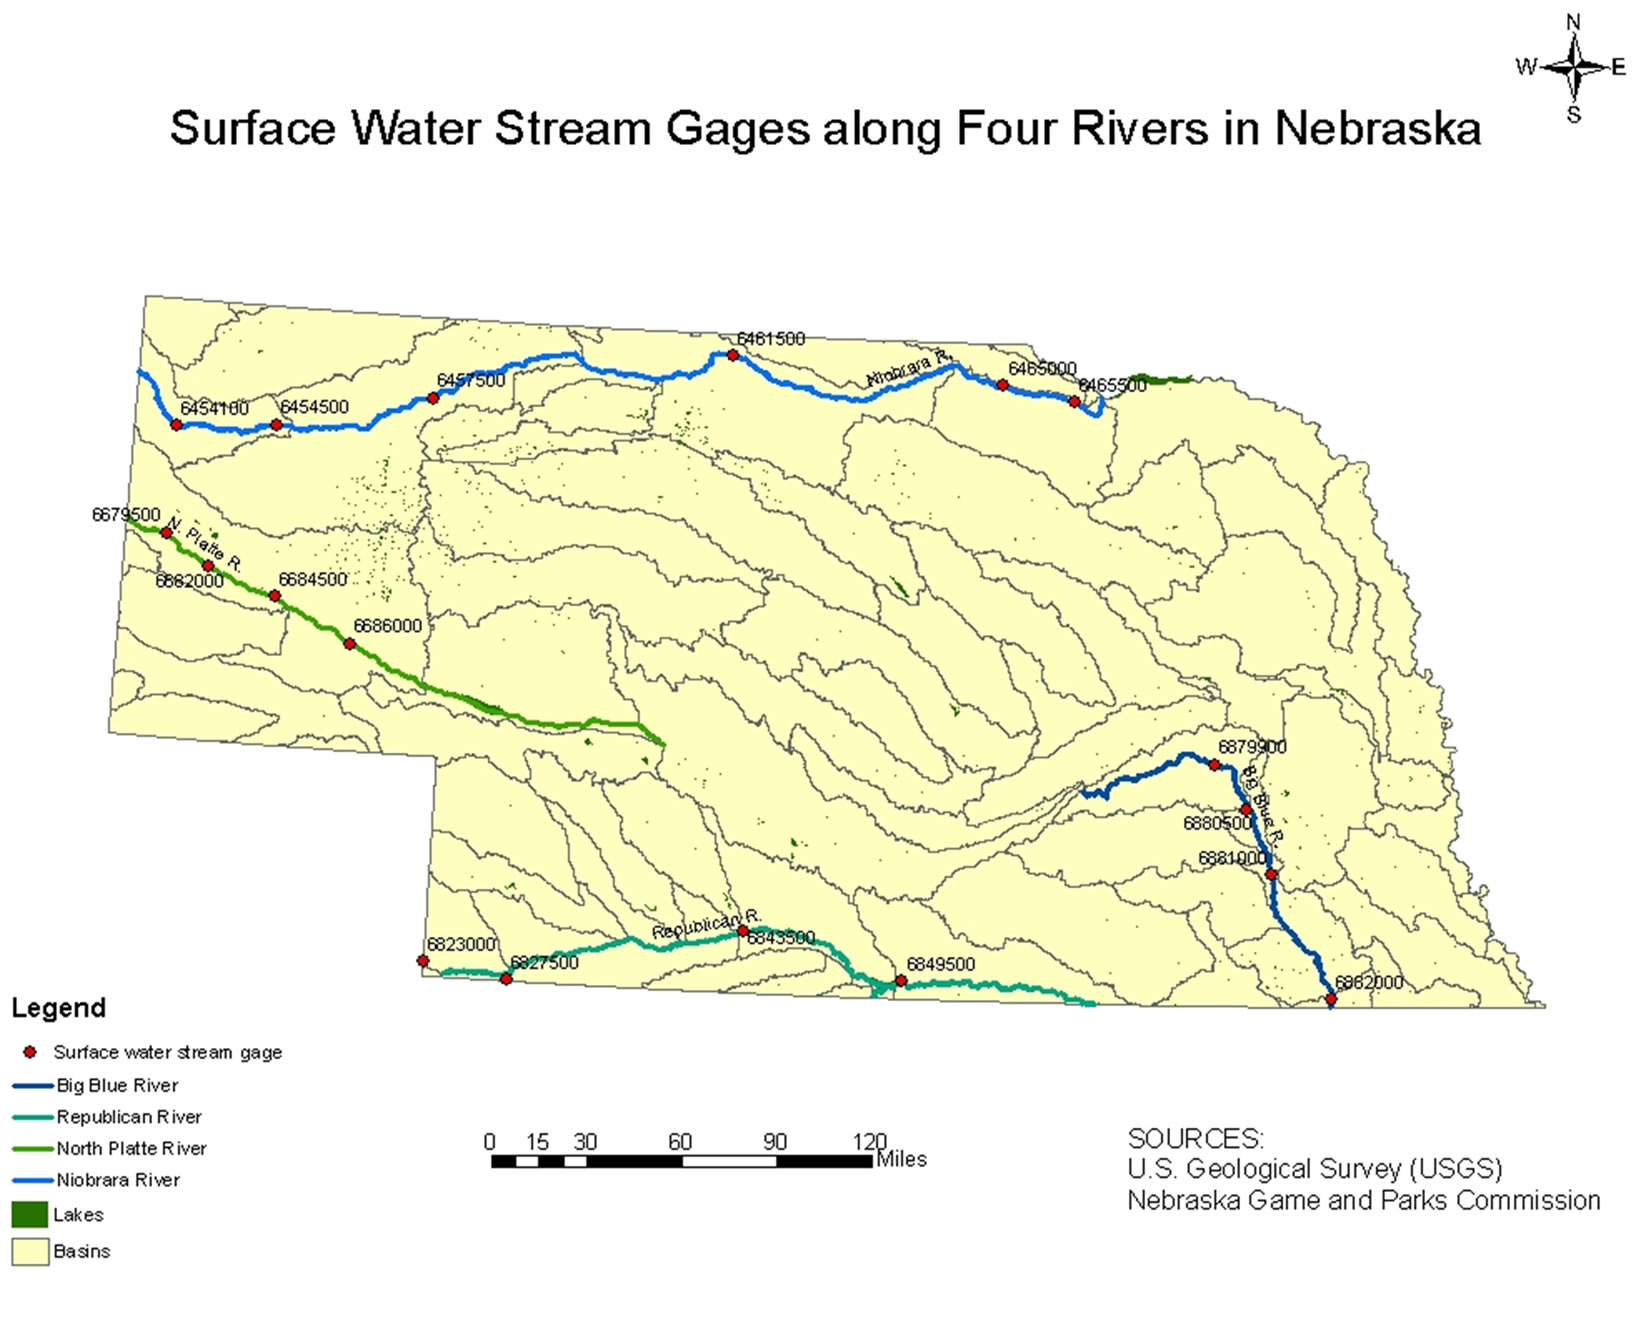
Figure 1. Distribution of the selected surface stream gages along the four rivers in Nebraska.
south side. In the main stem of the river, there are two reservoirs: Swanson Lake in upstream and Harlan County Lake in downstream. One reservoir was constructed on each of the three creeks in the north side of the Republican River: Enders Lake on Frenchman Creek, Hugh Butler Lake on Red Willow Creek, and Harry Strunk Lake on Medicine Creek. Sediments in the river valley of the Republican River consist of alluvial sand and gravel. Groundwater wells were constructed in the Basin for irrigation. There are also several canals which divert streamflow for irrigation. A depletion of streamflow at some specific locations in this river basin has been the starting point of water right disagreements between the users. For instance, rights to the streamflow in the Republican River basin have been in dispute between Nebraska and Kansas, as well as Colorado. The annual precipitation between 1948 and 2001 from a rain gauge of Benkleman (near streamflow gauge 06827500, see Figure 1) in the upstream of the Republican River was 47.4 cm.
The Big Blue River drains southeastern Nebraska. Several tributaries conjoin the river. The river flows to Kansas. The annual precipitation between 1948 and 2001 from a rain gauge of Crete (near the stream gauge 0688100, see Figure 1) was 75.6 cm. The top soil can be glacial or loess deposits. The river banks are usually composed of silt and clay. The groundwater system has a little hydrologic connection to the river [18]. Groundwater irrigation is well developed in the Big Blue Basin. The Big Blue agreement between Nebraska and Kansas has been more amicable than the Republican debates because of the higher annual precipitation levels and reduced threat of water shortage in the Big Blue basin, compared with those conditions in the southwestern and south-central parts of the state, where the Republican River basin lies. Among the four basins, the Big Blue River Basin has little impact of canal diversion or reservoir regulations on streamflow.
2.2. Stream Gauge Station Selection and Streamflow Data Sources
Choice of stream gages for this study posed a significant problem. All stations were chosen from a national database maintained by the U.S. Geological Survey (USGS). However, most stations with the most recent data did not have long-term historical data and the stations with long-term data were without up-to-date data. We decided to use the long-term data because they will be more meaningful in the statistical analysis. Therefore, the time periods of the selected stations were a somewhat outof-date. Along the four selected major river systems, thirty eight (38) stream gauge stations were identified based on the relative long-term streamflow data records. Specifically, four stations were chosen along the North Platte River with a period of measurement from 1930 to 1991; six stations along the Niobrara River (1957 – 1991); four stations along the Republican River (1952 – 2001); and four stations along the Big Blue River (1964 – 1994). USGS ended operations on some of these stations in 1990s. As a result, we selected the streamflow series based on the gauge with a shortest record. Nevertheless, the time period is still 30 years or longer for each study area. Figure 1 shows the stations used in this study along with the spatial coverage of the four selected rivers.
3. Methodology
In this study, we compare the streamflow stations on two sets of statistics: 1) the basic statistical characteristics derived from the annual streamflow discharges, and 2) the drought-related parameters derived from the identified streamflow drought events. To identify different levels of streamflow droughts, we devise a definition based on low flow range. Here we discuss these in detail.
3.1. Basic Statistical Characteristics on Annual Streamflow Discharge
Based on the streamflow data over the specific time period for each gauge station, the following basic statistical characteristics on the streamflow discharge were computed:
1) annual mean discharge: the average amount of water through a station per year;
2) standard deviation of the annual mean discharge;
3) coefficient of variation, the ratio of the standard deviation to the annual mean discharge; and 4) trend slope of the annual mean discharge based on linear regression analysis.
The coefficient of variation provides a comparison of the standard deviation of the annual mean discharge in units of the mean. These basic statistical characteristics will be compared among the upstream and downstream stations along each river to study the streamflow drought patterns of the four rivers.
3.2. Definition of a Streamflow Drought
Generally, a hydrological drought event for streams is characterized by three components: duration, severity, and magnitude [19]. Duration is the period during which streamflow stays below the long-term mean. Severity is the cumulative water deficiency. Magnitude is the average water deficiency during the period. Figure 2 illustrates these three drought components and the definition of a drought event schematically. Magnitude is also sometimes known as intensity [20]. Drought severity has also been defined as a combination of duration, deficit and maximum intensity [21].
The relationships among the three components are given by Equation (1):
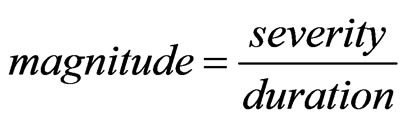 (1)
(1)
Prior to computing the three components, one needs to make sure that the distribution of streamflow is normal. If it is not, a logarithmic transformation on the flow data is necessary.
To obtain the “above normal” and “below normal” sections of a streamflow time series, the widely used threshold-based approach was employed [22]. A threshold level (or truncation level) divides a time series into two quantized sections. It is considered desirable to use a mean truncation level, since the mean is more sensitive to the extreme values of the distribution. Particularly in the study of drought events, these extreme droughts are generally of primary interest. In order to keep a consistent analysis of drought events, the average annual lowand high-flow seasons for each station were identified based on the multi-year average monthly discharge [23, 1]. Consequently, the stream drought events were defined in the lowand high-flow seasons separately.
3.3. Drought-Related Parameters
To describe the severity and frequency of streamflow droughts over the study period for each station from different aspects, several parameters were derived based on the three components of an event: duration, severity, and magnitude. The derived parameters were:
1) the annual maximum drought duration (AMD);
2) the annual accumulated drought duration (ACD);
3) the number of drought events per year (ND) [1];
4) the total number of drought events with a duration greater than three weeks over the study period;
5) the largest drought deficit and its time period over the study period; and 6) the longest streamflow drought duration and its time period over the study period [24].
Using annual results allows us to analyze the longterm trends and sensitivity of the streamflow. Similar parameters have also been used in analyzing other climate data such as evapotranspiration [25]. Comparisons of these parameters among the stations along a river
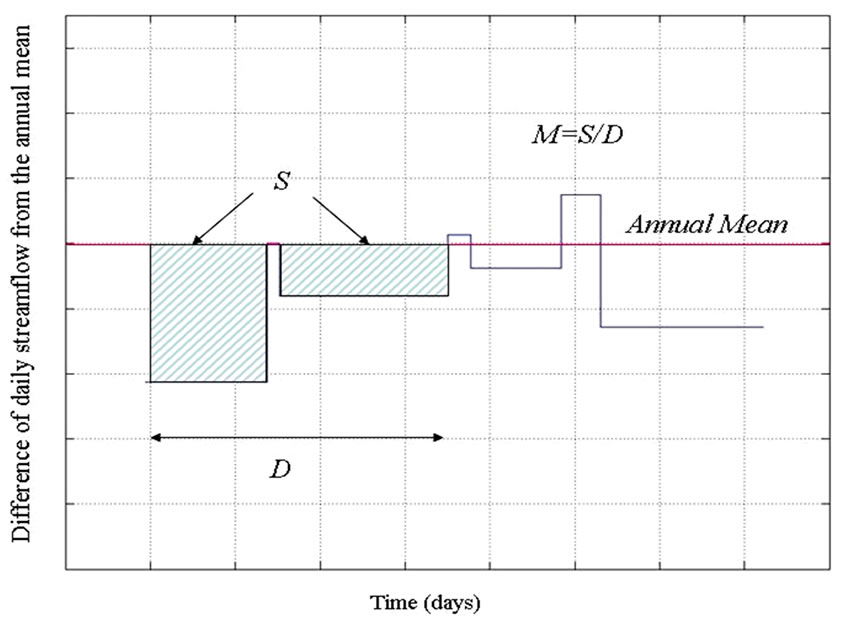
Figure 2. The three components of a drought event. M denotes the magnitude of a drought event; S the severity; and D the duration.
will reveal the upstream-downstream relationships in term of the severity and frequency of streamflow drought. Streamflow drought condition is essential information in the evaluation of water storage in rivers.
Two statistical tests were used to determine the differences of those statistical parameters between the upstream and downstream stations: the paired t-test and ANOVA using MIXED procedure. The paired t-test is commonly used for evaluating matched pairs of data with the assumption that the paired differences are normally distributed [7]. Since the parameters were driven from the daily streamflow data, repeated measurement data were involved. Therefore, the MIXED procedure was used to run an analysis of variance (ANOVA) because the MIXED procedure is able to accommodate data that have both fixed and random factors [5]. The two analyses were performed using SAS [20]. The level of significance was set at 0.05.
3.4. Classification of the Streamflow Drought Levels
In order to obtain greater resolution in the understanding of drought we propose a multi-level approach. We define six levels of droughts of increasing intensity from no drought to extreme drought. Based on the range of values of daily stream flow, we define the low flow range for a stream for a given day as follows:
lfr (d) = mean(d) - min(d),(2)
where lfr (d) is the low flow range, mean(d) and min(d) are the average value and the minimum value of the stream flow for the day (d), respectively. The six levels of droughts are defined using the computed lfr(d) and daily flow (water(d)) as follows:
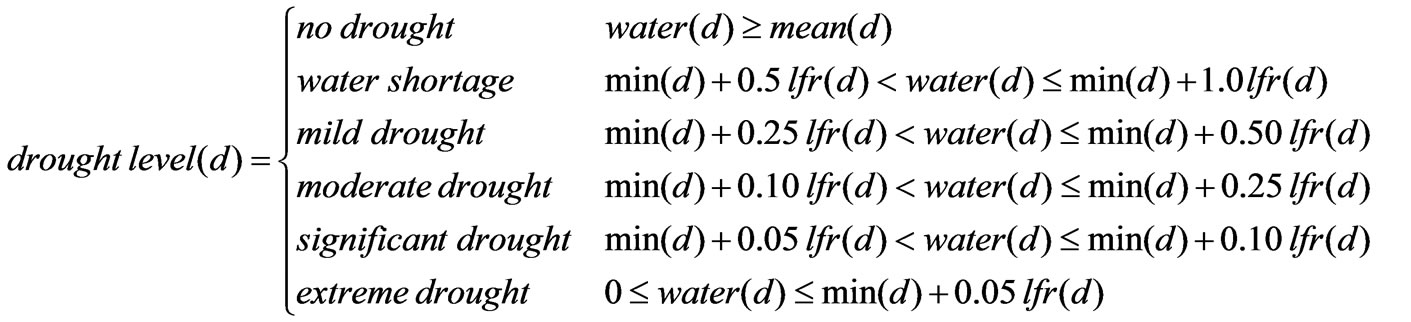 (3)
(3)
The time scale of streamflow used in the drought analysis is important. Using daily streamflow to define the drought events will introduce two particular problems: mutually dependent droughts and minor droughts [26]. Mutually dependent droughts are produced when the flow, which exceeds the threshold level in a short time period, divides a long-term drought event into a number of droughts of shorter duration. Minor droughts are results of flow fluctuations around the threshold level. In such cases, pooling successive events to define an independent sequence of droughts is necessary. The moving average procedure (MA) is a method for pooling dependent droughts into a single event. Based on a sensitivity analysis, Tallaksen et al. [27] and Hisdal et al. [1] concluded that an averaging interval 10 or 11 days is the “optimal” value in MA, respectively. As a result, the 11- day moving average procedure was applied to the daily streamflow data before performing drought identification on the data in this study. Thus, the streamflow data were smoothed by removing small, insignificant peaks and valleys above the threshold level and pooling some minor and dependent droughts together.
4. Results and Discussions
Here we discuss the results from two statistical comparative studies on the upstream-downstream relationships of the four major river systems in Nebraska. In each study, we will first present the statistics derived from the streamflow stations before comparing the upstream and downstream stations.
Note that the orientation of the Big Blue River is basically north-south while others are west-east. Since climatic condition varies largely across west-east, it probably has a larger effect on the streamflow for the Republican, Niobrara, and the North Platte rivers, especially on the Niobrara due to its significantly large distance between the most upstream and most downstream stations used in our studies. Further, the Big Blue watershed has a relatively small drainage area and that might cause the
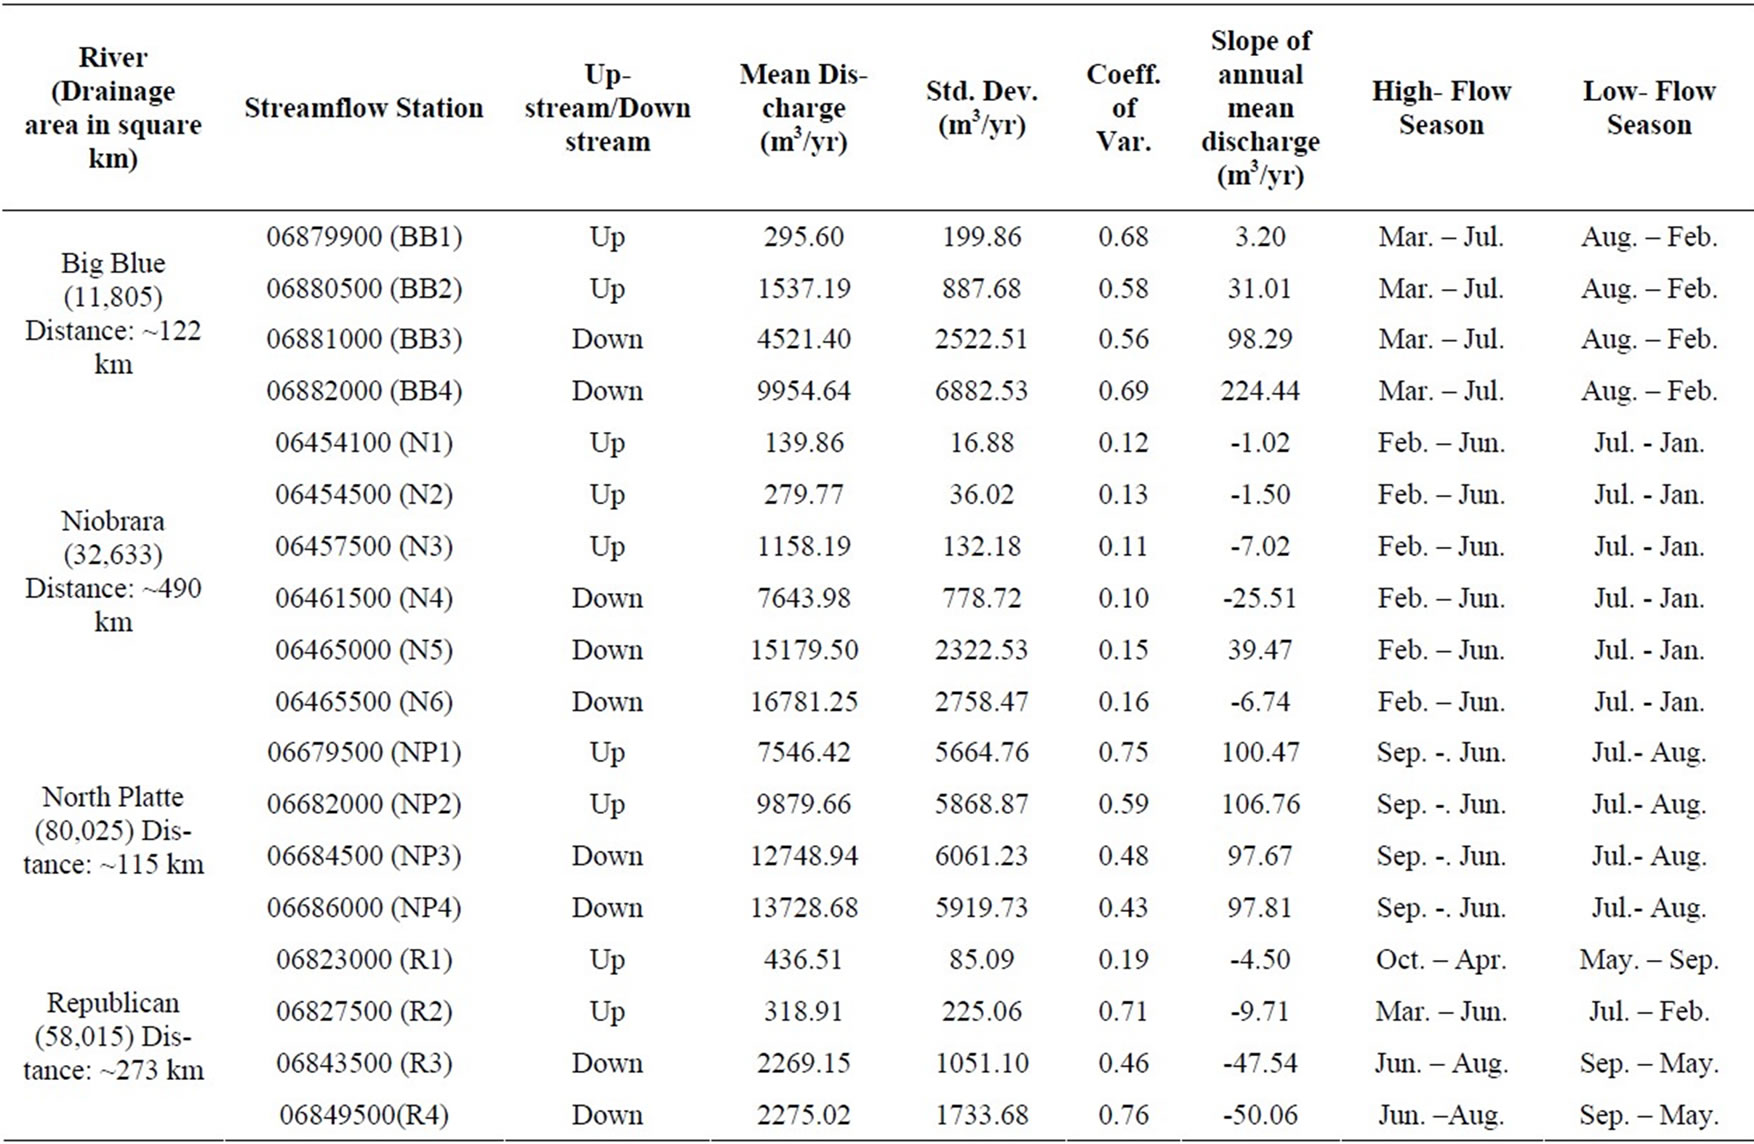
Table 1. Basic streamflow statistics of the stations along the four rivers and highand low-flow seasons. Stations are listed in order of flow directions, i.e. the upstream stations are listed before the downstream stations. Note: the Distance value is the distance between the most upstream and most downstream stations.
streamflow characteristics to be more volatile over time. The downstream flow is much larger than that in the upstream for this small Big Blue watershed because a larger precipitation in eastern Nebraska leads to large surface runoff on less permeable top soils. Soils in other three basins are more permeable; this can likely accelerate precipitation infiltration and reduce surface runoff during rain events.
4.1. Study 1: Upstream-Downstream Relationships of Streamflow
4.1.1. Statistical Characteristics of Streamflow
Table 1 summarizes the basic statistics of streamflow including the 1) annual mean discharge, 2) its standard deviation, 3) its coefficient of variation, 4) its slope of trend, and the distribution of the annual 5) highand 6) lowflow seasons for each station along the 4 river systems. (The measurements are shown in British units since the original streamflow measurements are reported as such.) As expected, the annual mean discharges of downstream stations generally are greater than those of upstream stations. This is because the discharges increase downstream in a river as tributaries enter and most rivers tend to increase downstream hydraulic parameters (i.e. width, depth, and mean velocity) [28].
The coefficients of variation shown in Table 1 indicate that the variability of the annual discharges is between 60-70% among the 4 stations on the Big Blue River, while the variability is about 10% among the 6 stations on the Niobrara River. The common thing between the two rivers is that the coefficients of variation are consistent among the stations along each river. On the other hand, the coefficients of variation for the stations on the other two rivers of North Platte and Republican are discrepant. For the North Platte River, the station NP1, located at the very beginning of the river, has the highest coefficient (0.75) among the 4 stations. The coefficient of variation decreases downstream. In contrast, the station R4, located on the lower Republican River, has the highest coefficient of variation (0.76) compared with other upstream stations, especially R1. This could be explained by the fact that the Harlan County Reservoir is located between the two stations R3 and R4. In addition, a canal system originates just below this reservoir. The canals divert streamflow during each irrigation season, leading to a high variation of the downstream station. A high coefficient of variation (0.71) is also observed for R2. This is very likely due to Haigler Canal constructed above R2 which diverts water from the North Fork Republican River.
All stations along the Big Blue and North Platte indicate a positive trend in the annual discharge over the study period, while the stations along the Republican indicate a negative trend. All stations along the Niobrara show a negative trend except for one downstream station. The detected negative trend along the Republican is consistent with what has been reported in Wen and Chen [29] as results of groundwater irrigation. Streamflow diversion to canals and consumption of water by riparian vegetation can also reduce streamflow. According to Chen and Shu [30], the rate of groundwater use by riparian vegetation can be up to 5 mm/day in the Republican River Valley. The negative trend is also consistent with the primary reasons for the dispute between the two states of Nebraska and Kansas.
The long-term monthly average discharge distribution over the given time period for each station shows that the high-flow season is a bimodal distribution, and the highand low-flow seasons for the stations along the Big Blue are consistent (Figure 3). For convenience, this study combined the two high-flow seasons into a single one, i.e., the high-flow season is from March through July, and the low-flow season is from August through February. This pattern is also exhibited by the stations along the Niobrara and North Platte Rivers. However, the distribution patterns of the monthly average streamflow of the stations along the Republican are inconsistent. One station’s high-flow season is another station’s low-flow season, for example. This inconsistency is probably due to the lower stream of the river being diverted via irrigation canals during the crop growing season. Note that the Republican River Basin has five major dams on the main stem and its tributaries. These reservoirs regulate water for irrigation and flood control. They can also contribute to the inconsistency.
4.1.2. Upstream-Downstream Relationships of Streamflow
Based on the results described in Table 1, we use the paired t-test to determine whether the trend slopes for the
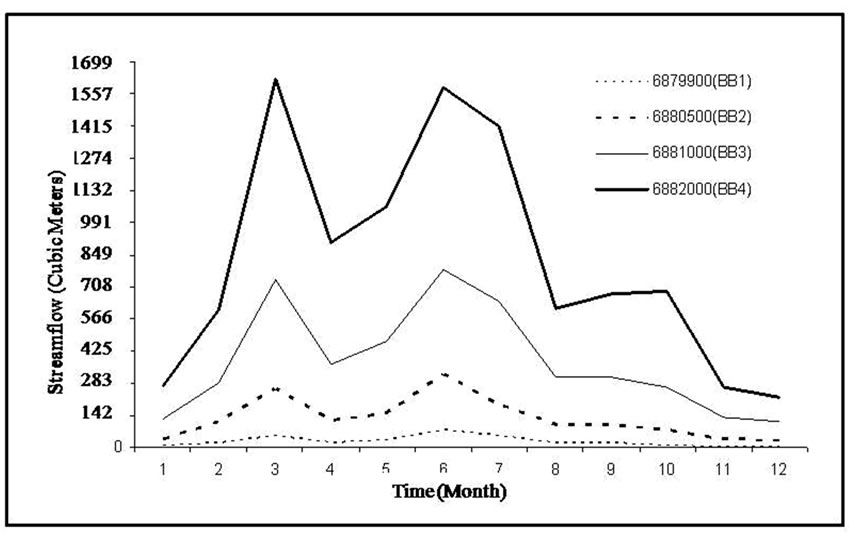
Figure 3. Long-term monthly mean discharge of the four stations along the Big Blue.
stations upstream are different from the trends for downstream stations. To test the differences on other parameters, we utilize the MIXED procedure in SAS to account for year.
PROC MIXED DATA=R1 COVTEST;
CLASS YEAR S T;
MODEL Y = T/DDFM=KR;
RANDOM YEAR YEAR*T S(T);
LSMEANS T;
In the above model, * denotes factor interaction and the parentheses denote factor nesting. That is, S(T) denotes the station id of type T, where the type can be either upstream or downstream. YEAR is the year of measurement.
Table 2 summarizes the results obtained from the two tests. There is no significant difference between upstream and downstream stations along the Big Blue and the Republican rivers, in terms of mean annual streamflow, variability and trend slope. For the North Platte River, there is no significant difference in terms of all the statistics but standard deviation between upstream and downstream streamflow. For the Niobrara River the characteristics between the upstream and downstream stations are significantly different in the annual mean streamflow, variability and the trend slope, with an exception of coefficient of variation. The variability between upstream and downstream stations is probably caused by its long stretch for the analysis, lower annual precipitation in the upstream area, potential effect of intensive groundwater irrigation in parts of the watershed, and surface water regulation (e.g., reservoirs and dams).
4.2. Study 2: Upstream-Downstream Relationships of Drought Events and Durations
The parameters associated with the severity and frequency of the streamflow drought—such as the annual maximum drought duration (AMD), the annual accumulated drought duration (ACD) and the number of drought events per year (ND) were compared among the upstream and downstream stations along the same river to
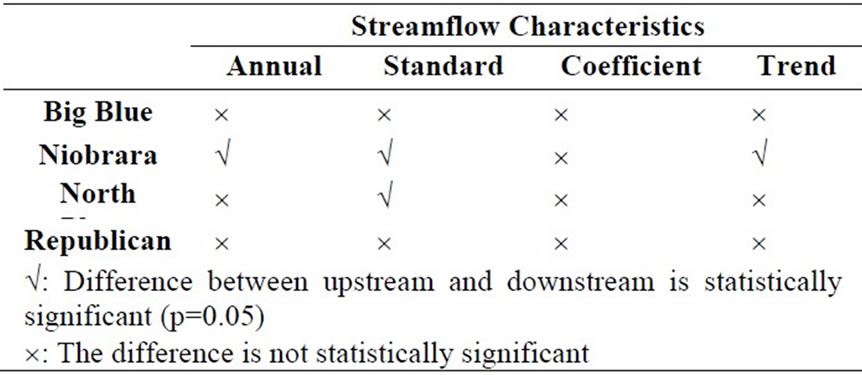
Table 2. The results of statistical tests to compare the streamflow statistical characteristics between upstream and downstream stations.
study the association of the severity and frequency of streamflow drought occurring along the same river.
In the following, due to space consideration, we present figures and tables to show only results of two representative stations of each river, one from the set of upstream stations and one from the downstream stations.
4.2.1. Number of Drought Days
Figures 4-7 show the distribution of drought days of different levels for the stations of the four rivers.
4.2.2. Annual Maximum Drought Duration (AMD)
Figures 8-11 show the distribution of AMD of different levels for the stations of the four rivers.
4.2.3.Annual Accumulated Drought Duration (ACD)
Figures 12-15 show the distribution of ACD of different levels for the stations of the four rivers.
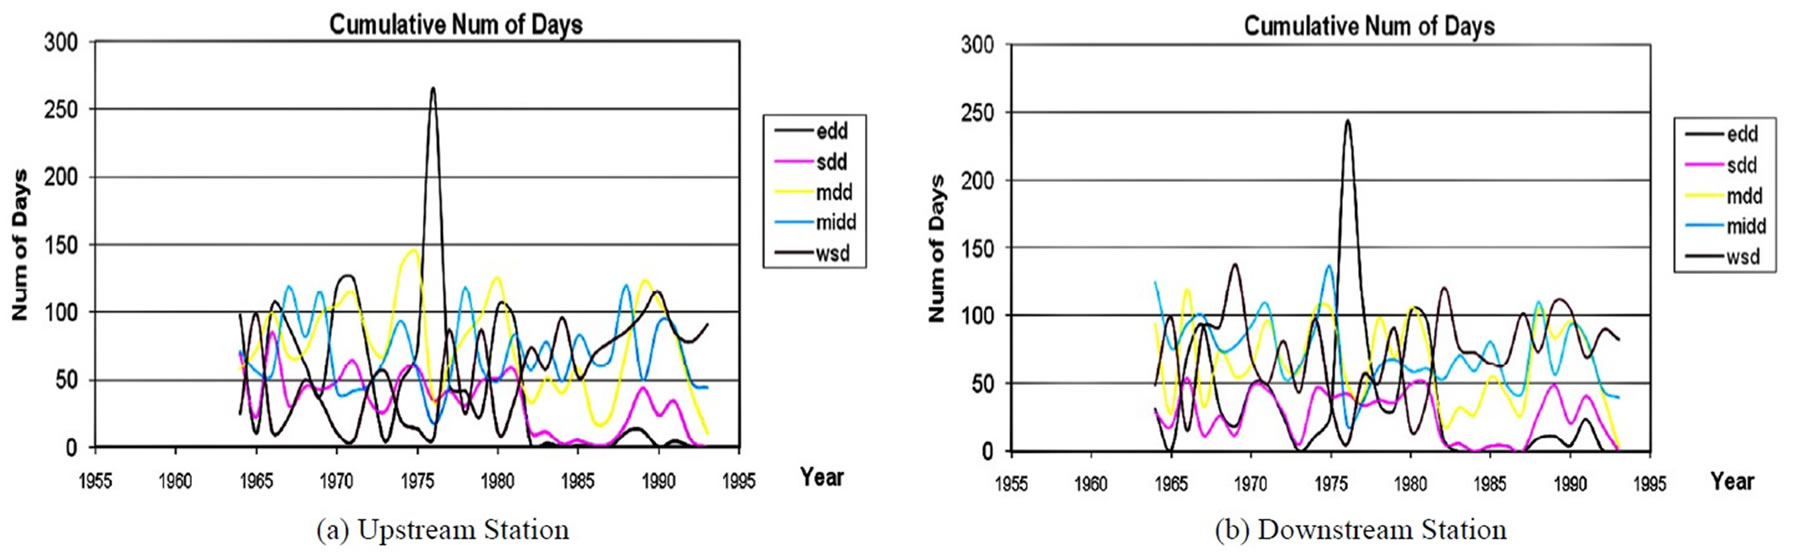
Figure 4. Number of drought days of different levels for the Big Blue River. “edd” denotes extreme drought days; “sdd” significant drought days, “mdd” moderate drought days, “midd” mild drought days; and “wsd” water shortage days.
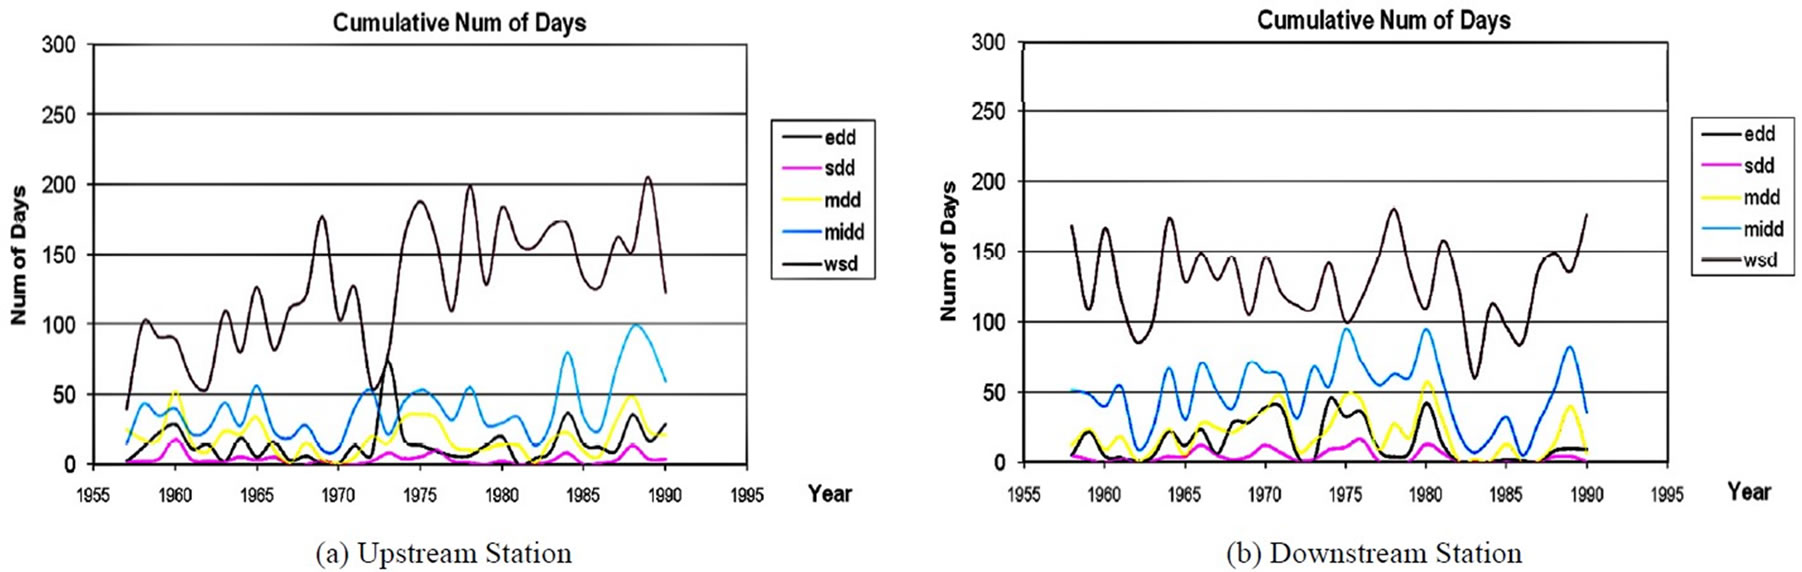
Figure 5. Number of drought days of different levels for the Niobrara River.
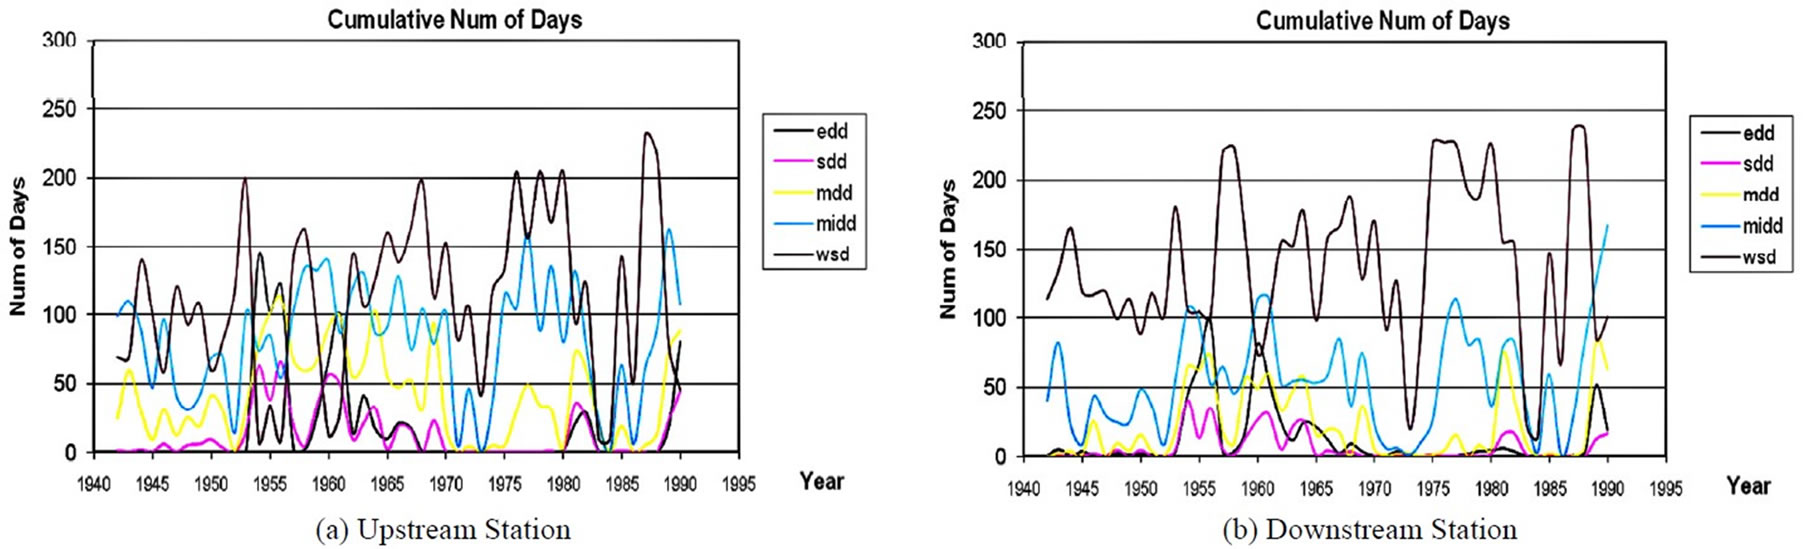
Figure 6. Number of drought days of different levels for the North Platte River.
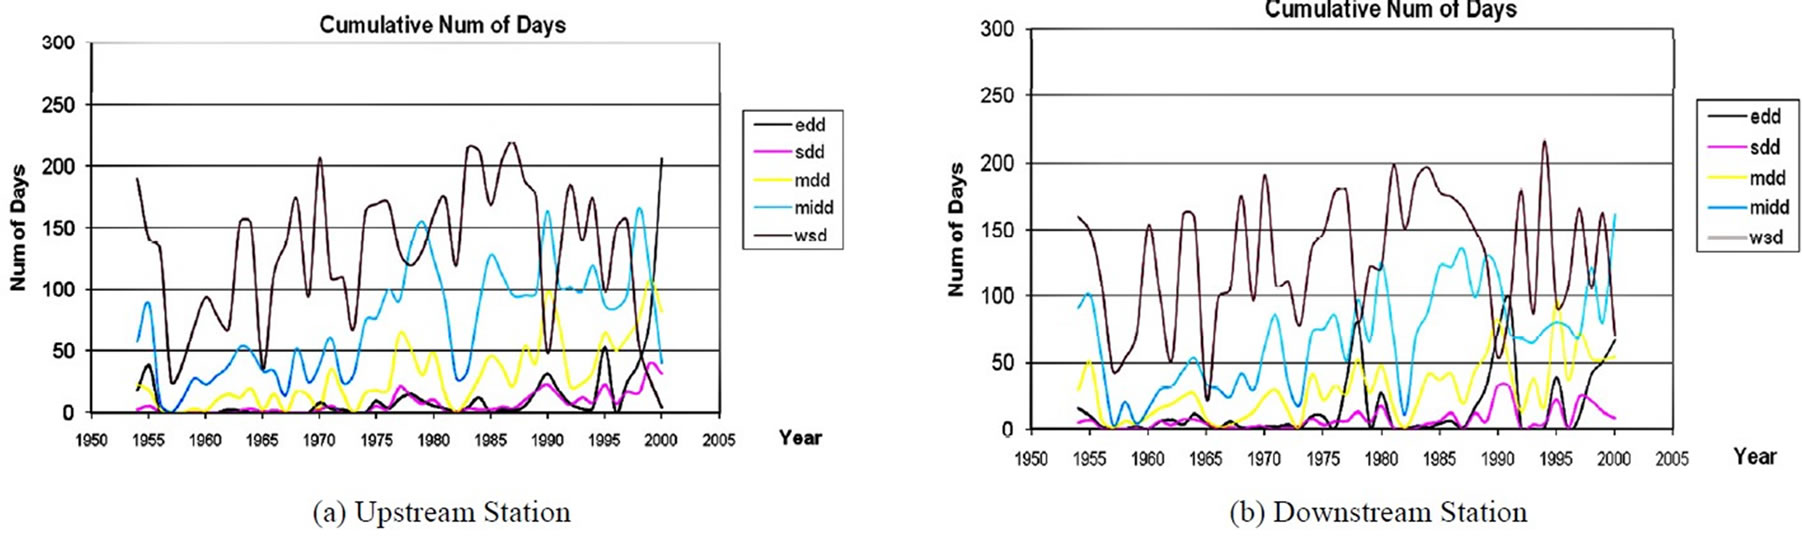
Figure 7. Number of drought days of different levels for the Republican River.
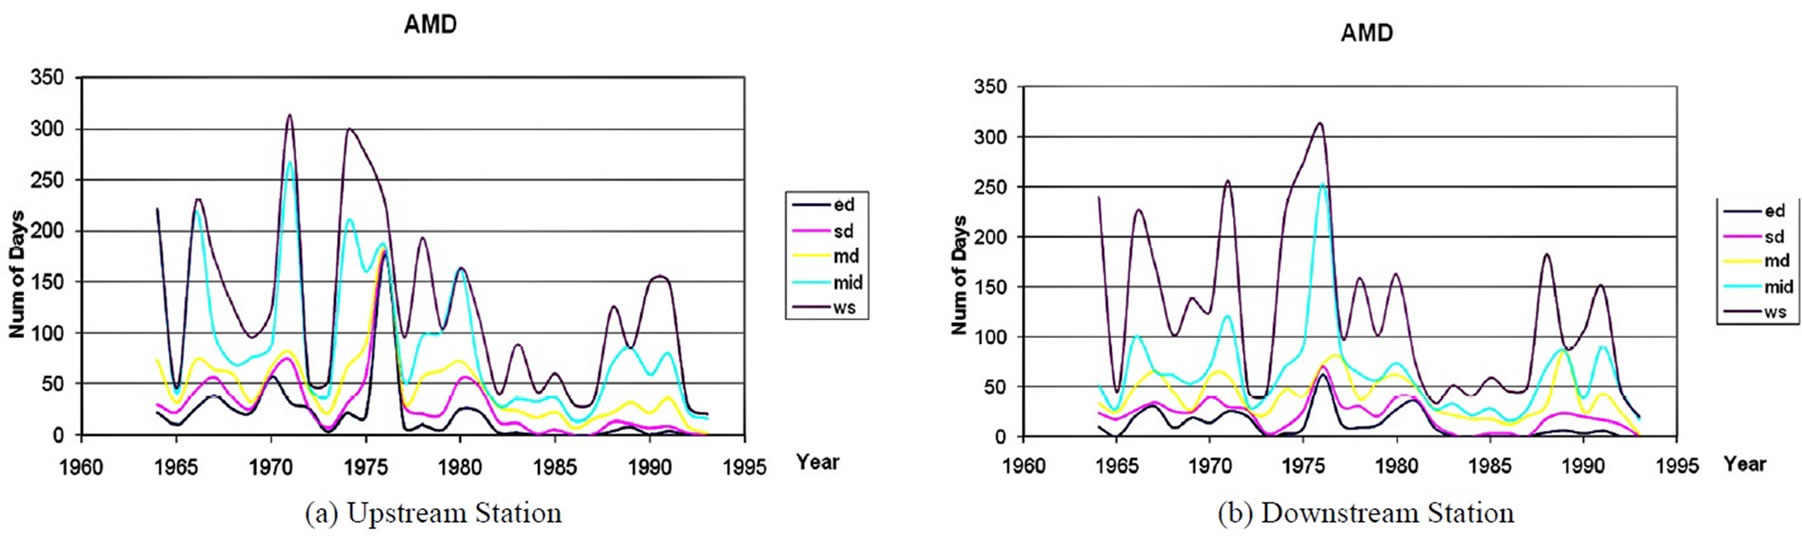
Figure 8. AMD of different levels for the big Blue River.
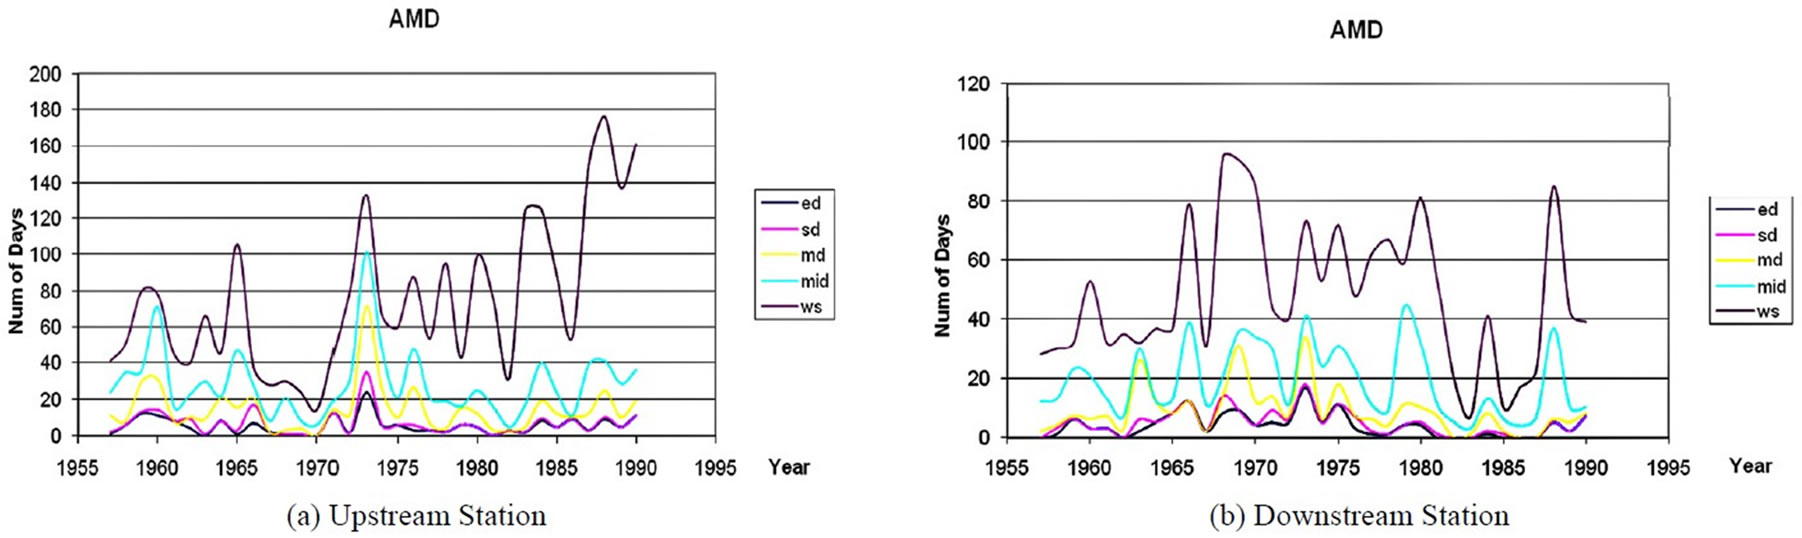
Figure 9. AMD of different levels for the Niobrara River.
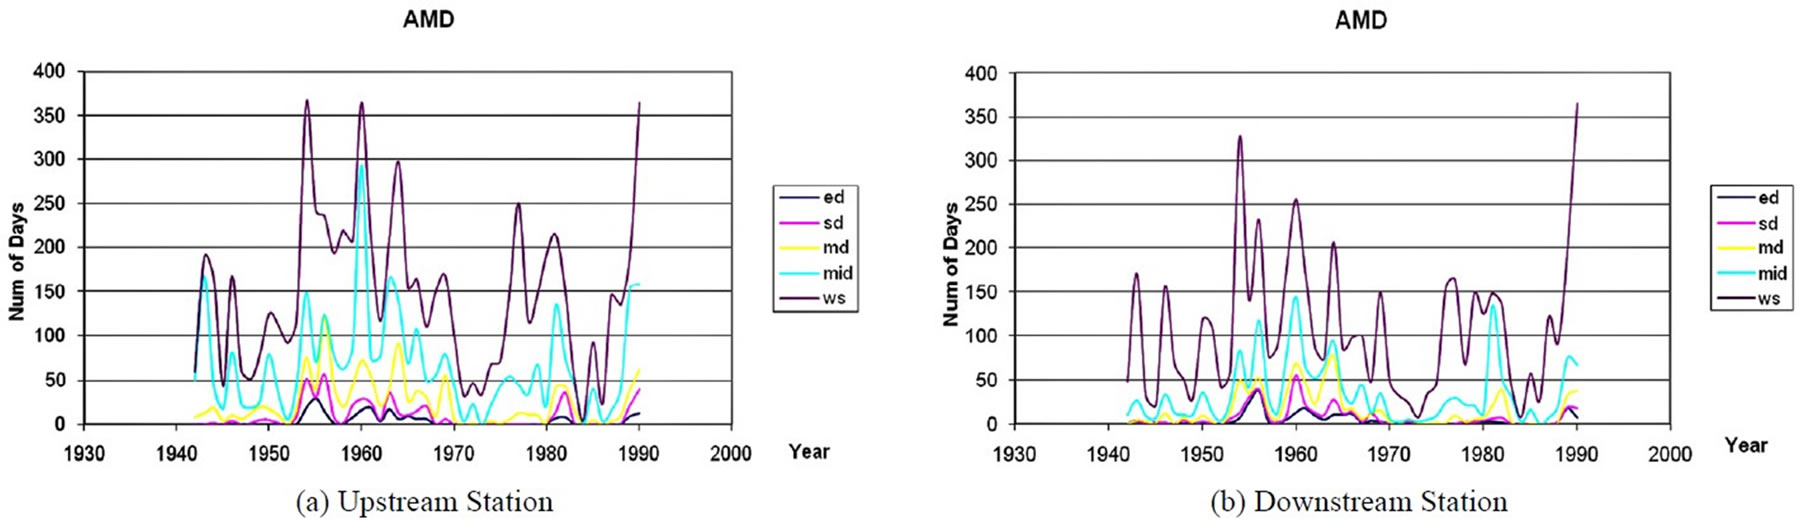
Figure 10. AMD of different levels for the North Platte River.
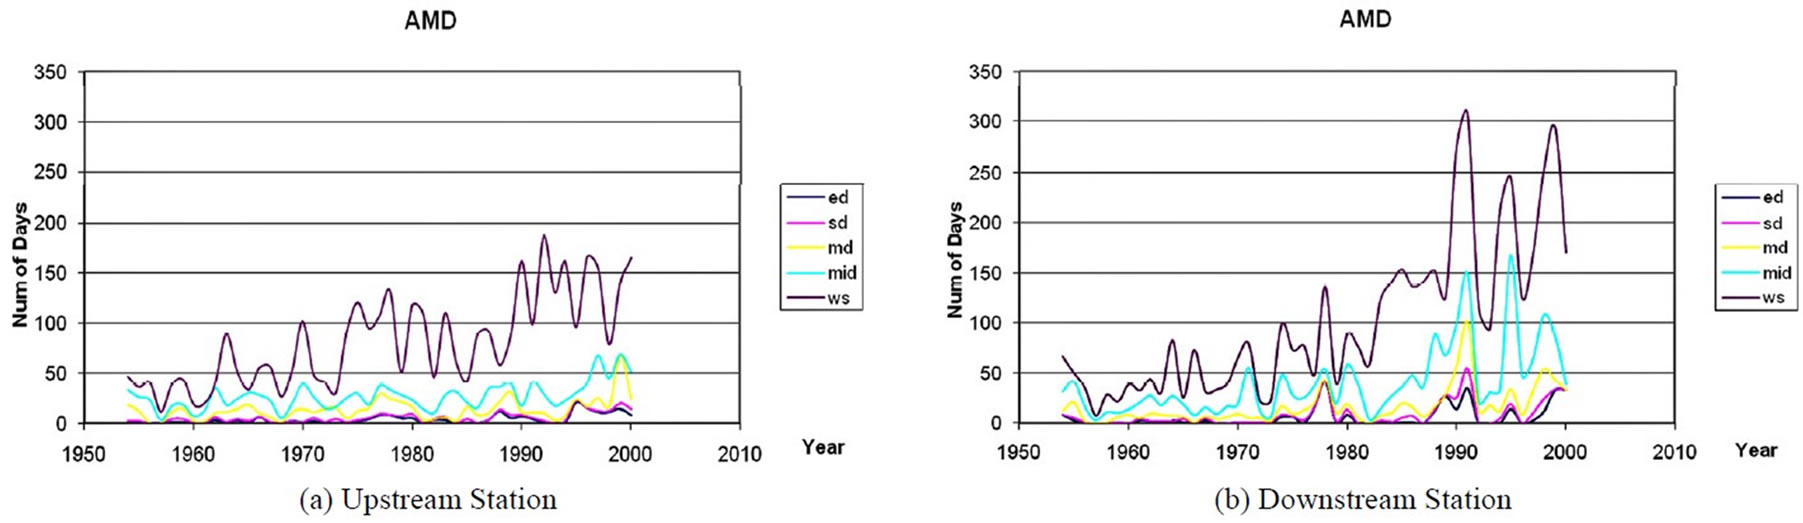
Figure 11. AMD of different levels for the Republican River.
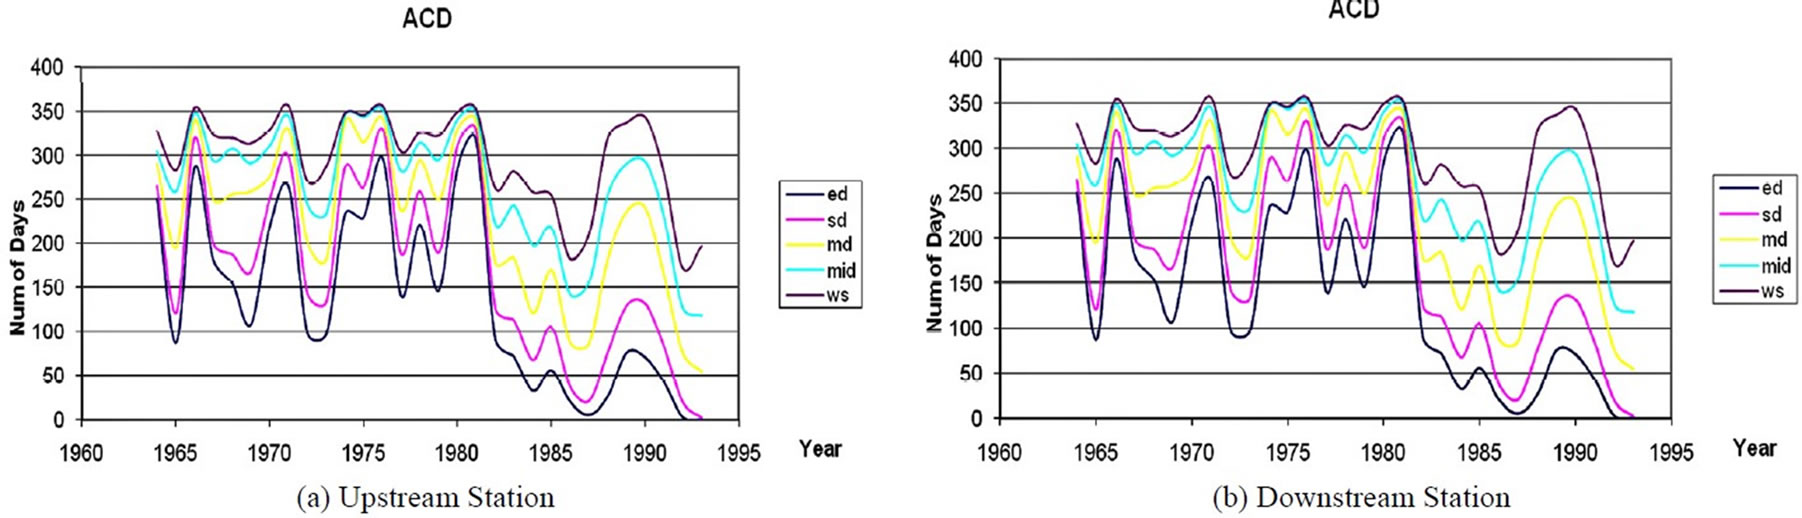
Figure 12. ACD of different levels for the Big Blue River.
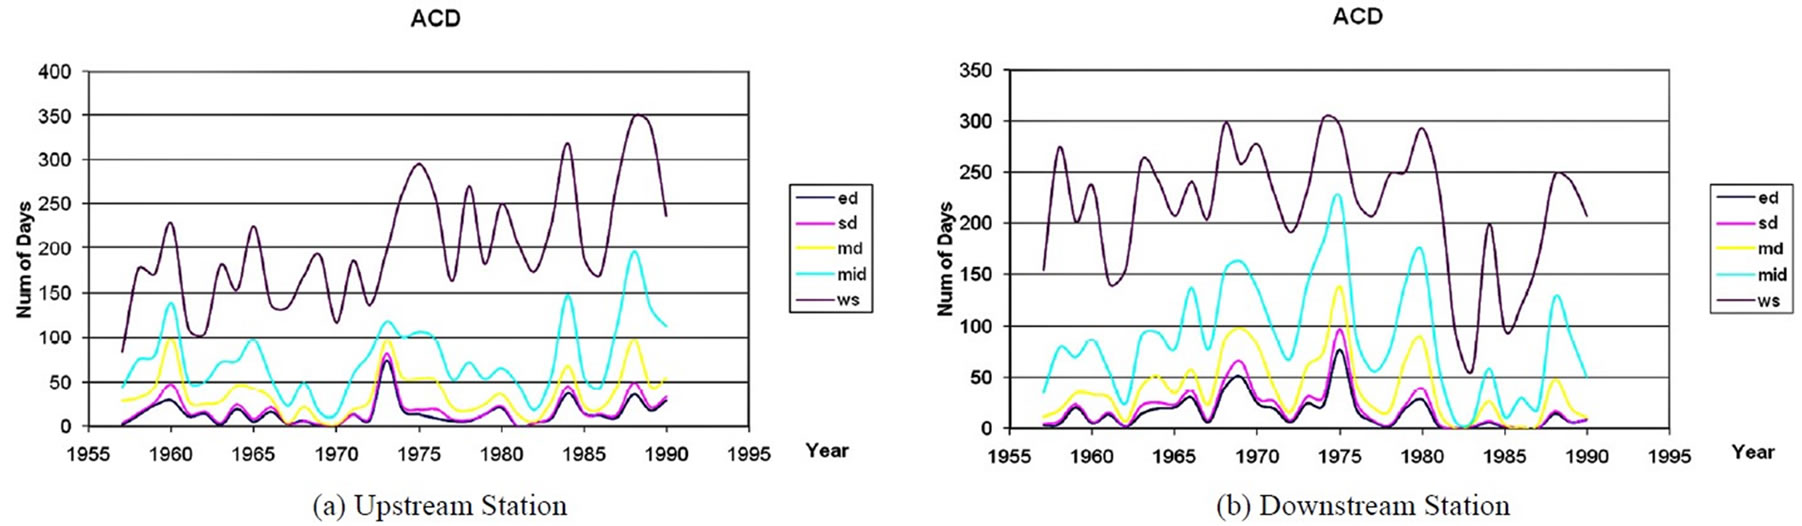
Figure 13. ACD of different levels for the Niobrara River.
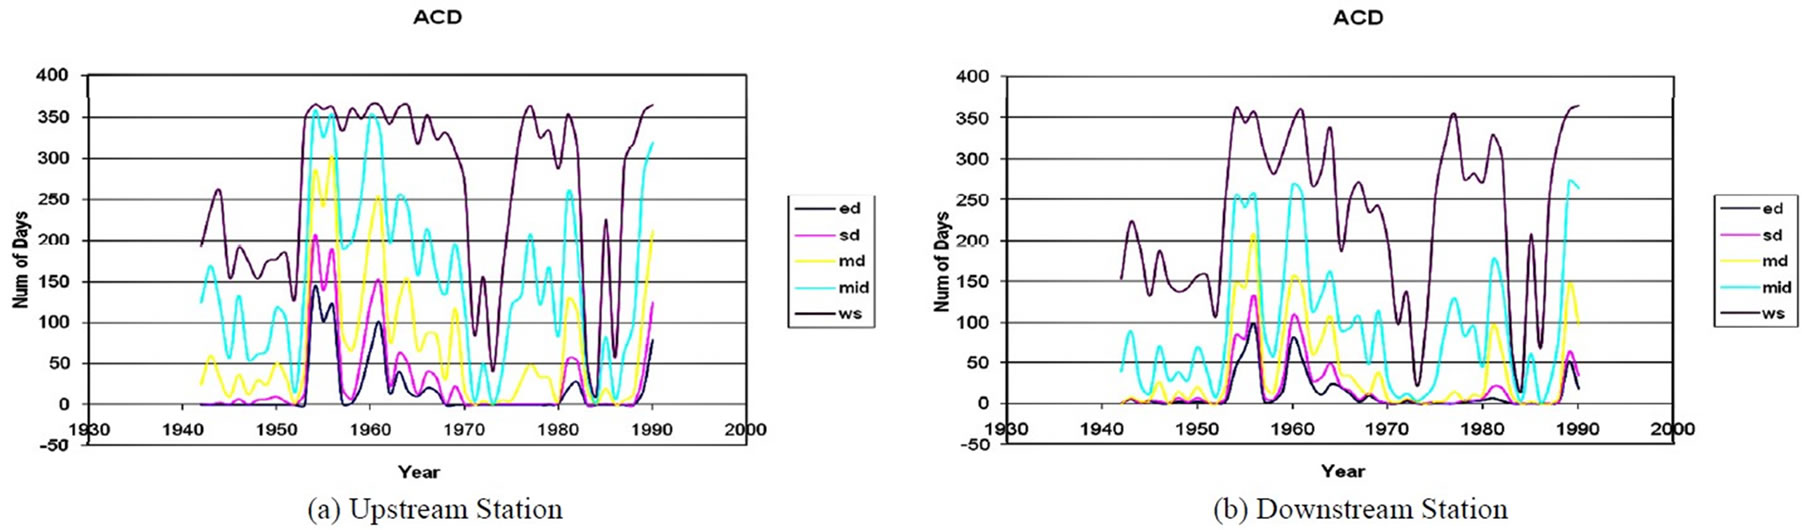
Figure 14. ACD of different levels for the North Platte River.
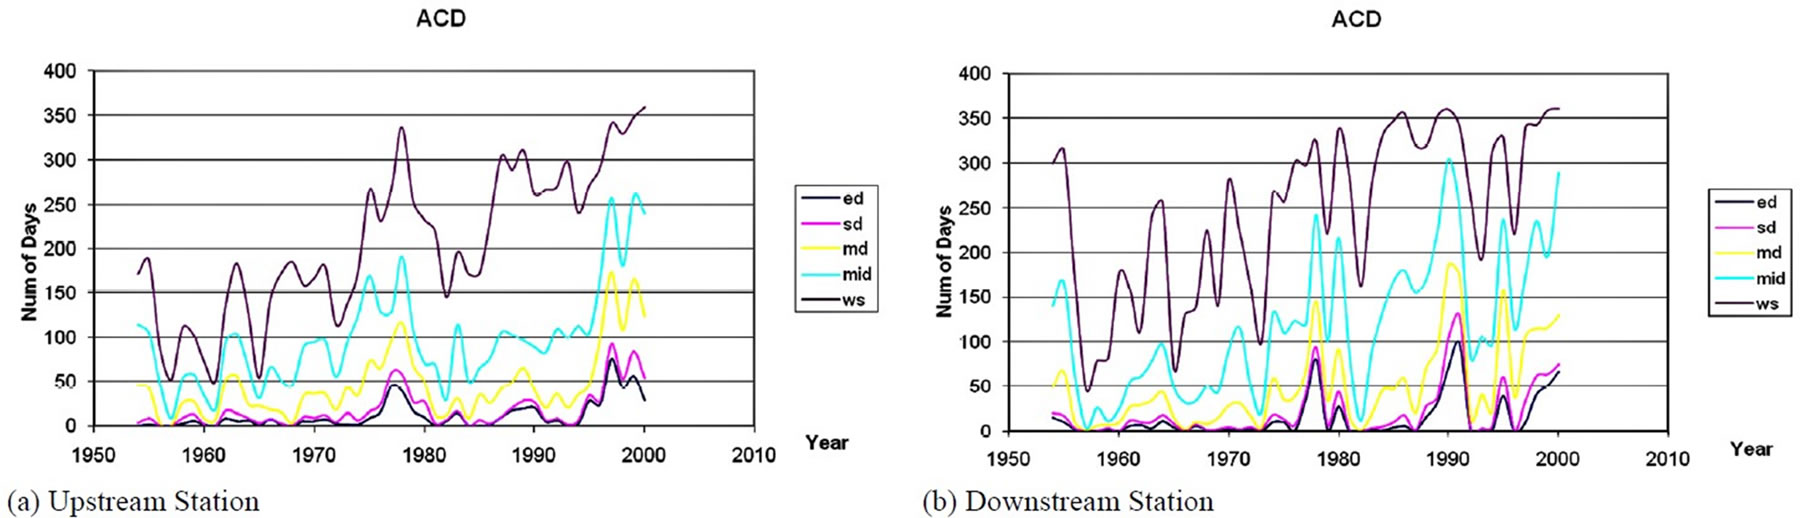
Figure 15. ACD of different levels for the Republican River.
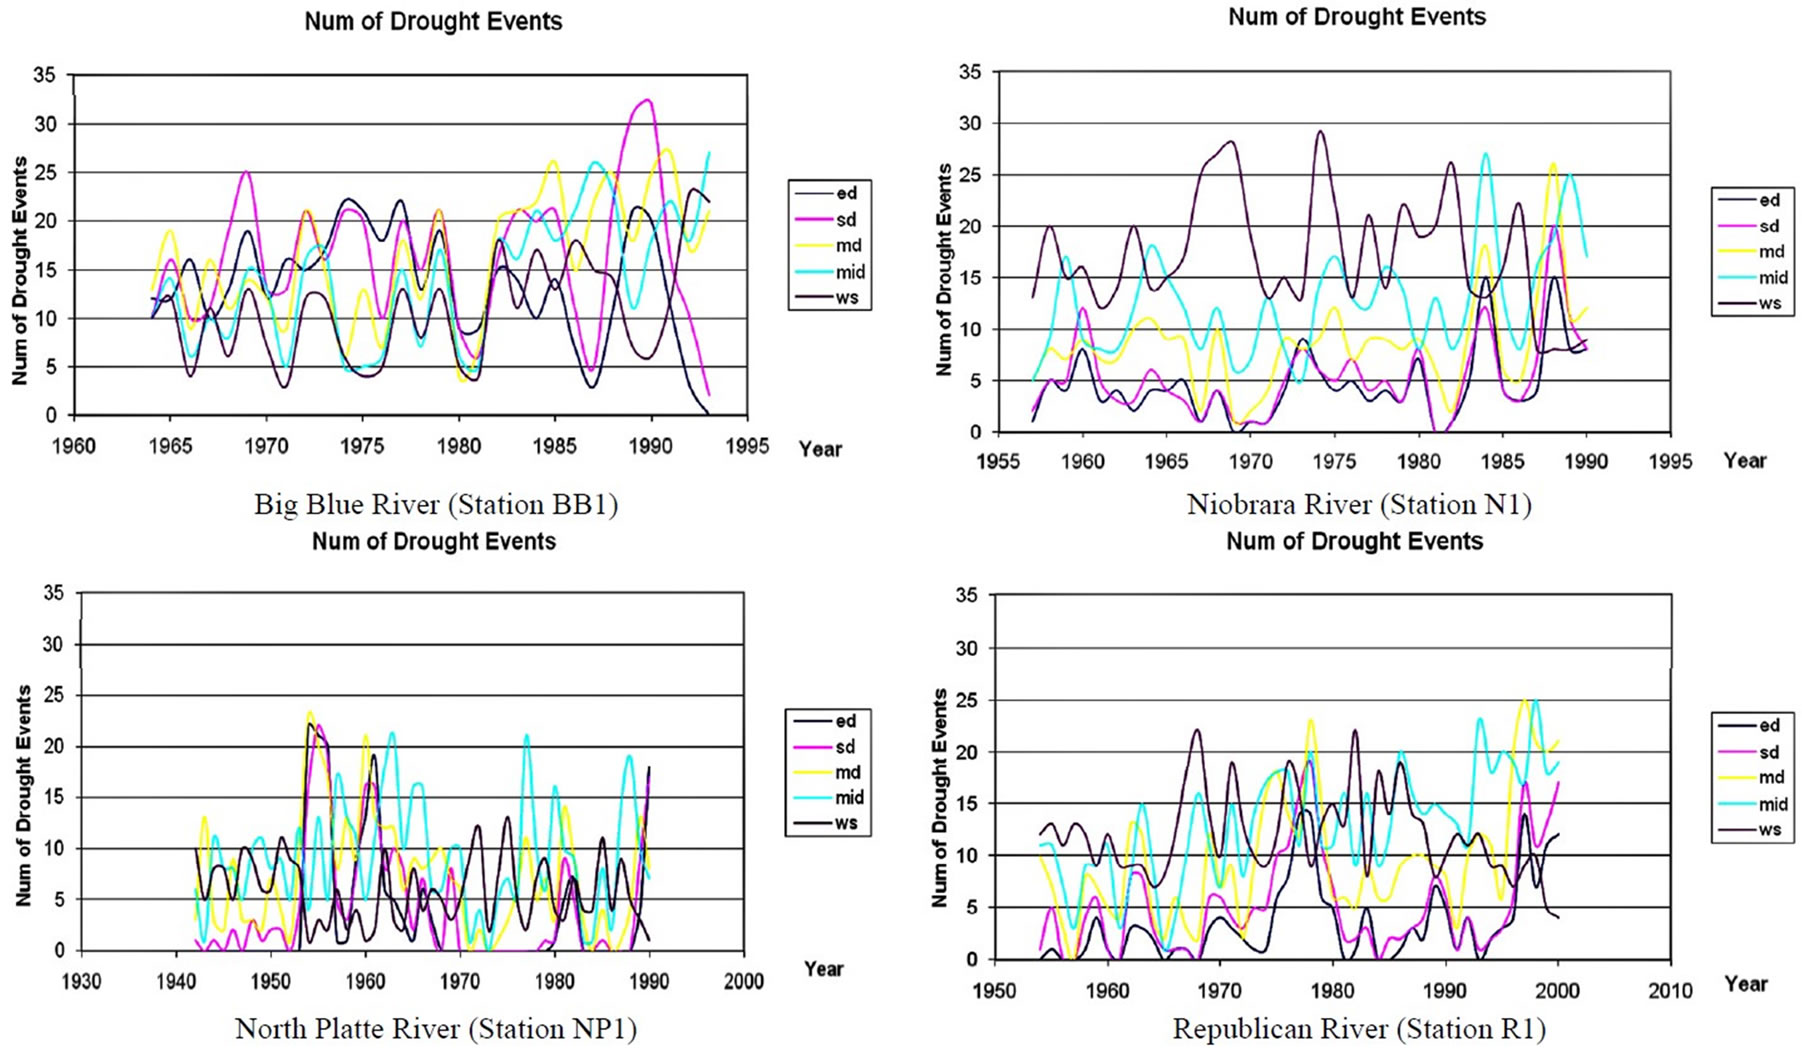
Figure 16. Number of drought events of different levels for the four rivers.
4.2.4. Number of Drought Events per Year (ND).
Drought events could be defined according to one of the five drought levels as defined earlier in Equation (3). For each level, the drought event is further classified based on the duration to show how long the water deficit will last. We tried durations of 2 weeks, 3 weeks, 4 weeks, 6 weeks, and 8 weeks for each drought type. Therefore there are 25 different combinations. To compare those different combinations, we constructed a 5 ´ 5 matrix for each station. Each entry in the matrix is one of the 25 different combinations of different drought duration thresholds and drought types. The upper left corner corresponds to the combination of water shortage drought and a threshold of 2 weeks. The lower right corner corresponds to the combination of extreme drought type and a threshold of 8 weeks. Tables 3-6 summarize the distributions of drought events of different levels and durations for some stations along the four rivers.
Figure 16 shows a graph of number of drought events versus year for different levels of drought for some stations along the four rivers.
4.2.5. Discussion on Upstream-Downstream Relationships of Severity and Frequency of Drought Events
For the Big Blue River, the AMD, ACD and ND are consistent among the 4 stations over the period 1965-1985 (Figures 4, 8, 12, and 16), indicating that the severity and frequency of streamflow droughts among the upstream and downstream stations are statistically similar during this period. For the time around 1985, the trends of the three parameters slightly decrease, and then bounce back
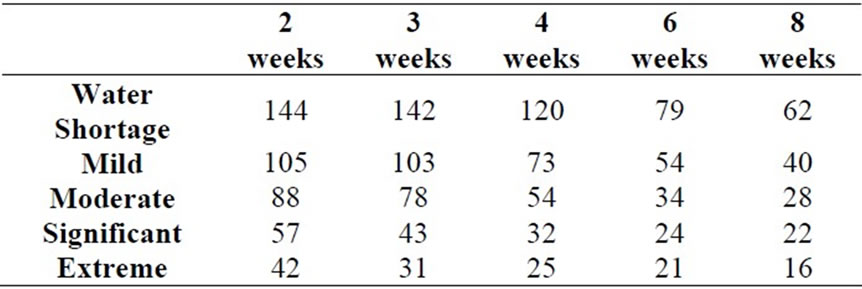
Table 3. Distribution of number of droughts for the Big Blue River (Station BB1).
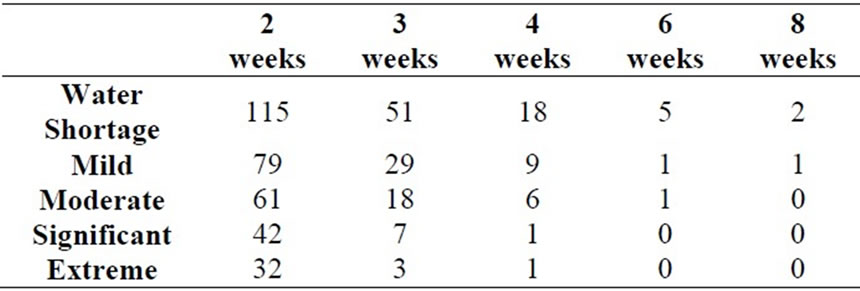
Table 4. Distribution of number of droughts for the Niobrara River (Station N1).
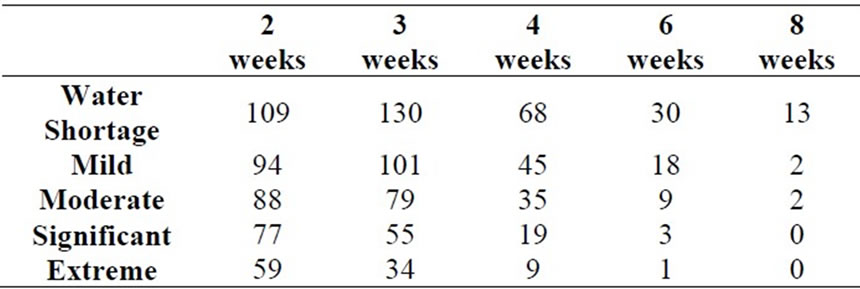
Table 5. Distribution of number of droughts for the North Platte River (Station NP1).
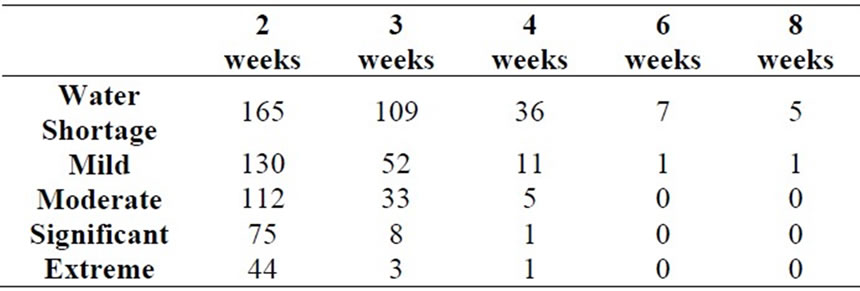
Table 6. Distribution of number of droughts for the Republican River (Station R1).
for the four stations. In addition, in late 1980’s and early 1990’s, the droughts at downstream stations have become more intense, more frequent and last longer than the upstream droughts. In 1976, the annual precipitation measured from the rain gauge of Crete was 46.6 cm, compared to annual average precipitation of 75.6 cm of 53 years. This below-normal precipitation led to a large number of drought days for upand downstream stations (Figure 4), as well as a large value of AMD for these stations (Figure 8).
For the Niobrara River, the AMD of the upstream stations is more severe for most of the study period compared to that of the downstream stations. The ACD of the upstream stations has an increasing trend and exceeds that of the downstream stations after 1980. Clearly, the number of droughts (ND) each year at the downstream stations is greater than the upstream stations (Figures 5, 9, 13 and 16). Thus, for this river, the upstream stations encounter more severe droughts, especially in recent years, while the downstream stations encounter droughts more frequently. Severe drought in upstream may come from the combination of two factors: lower annual precipitation rate in the western Nebraska and groundwater irrigation. In western Nebraska, the Niobrara River flows through the north border of Box Butt County where intensive groundwater pumping has caused a large decline of the water table in the aquifer for several decades. The decline has been up to 9 m at some locations, compared to the water table in 1950’s and 1960’s. If the river is hydrologically connected with the underlying aquifer, the depleted aquifer will have induced infiltration of streamflow to the surrounding aquifers. The trend analysis of streamflow by Wen and Chen [29] indicated that annual discharge in upstream of the Niobrara River had a decreasing trend in 1946-2003 at station 06454500 (N2) and in 1945-1991 at station 6457500 (N3).
The relationships of the parameters on the North Platte River among the 4 stations are shown in Figures 6, 10, 14, and 16. With regard to the AMD and ACD development over the years, the upstream stations are similar with the downstream stations. However, the upstream stations show a higher value of ND for most drought categories than the downstream stations for the entire period.
Figures 7, 11, 15, and 16 show a unique pattern along the Republican River. The parameters of the downstream stations more intense drought characteristics than that of the upstream stations during 1950 to 1990. After 1990, the three parameters of the station located upstream (R1) present a strong increasing trend and exceed the downstream stations in the severity and frequency, indicating this upstream station suffers from drought more severely and more frequently.
Tables 7-10 list the DD, AMD, ACD and ND of upstream and downstream stations in different levels of drought events. The statistical analysis is performed using the MIXED procedure and the paired t-test.
Tables 7-10 show that while strong trends are apparent in the drought parameters between upstream and downstream stations, many of the differences are not statistically significant. Table 7 shows that the difference in drought durations for upstream and downstream stations is significant only for Big Blue River (significant droughts) and for North Platte River (moderate droughts). For the other levels of droughts and for Niobrara River and Republican River, there are no differences between the upstream and downstream stations. Table 8 also shows that there are no differences in AMD between upstream and downstream stations for Niobrara River and Republican River. The differences for Big Blue appear only for mild droughts while those for North Platte are only for water shortage events. Table 9 shows that there no significant differences in ACD between up-
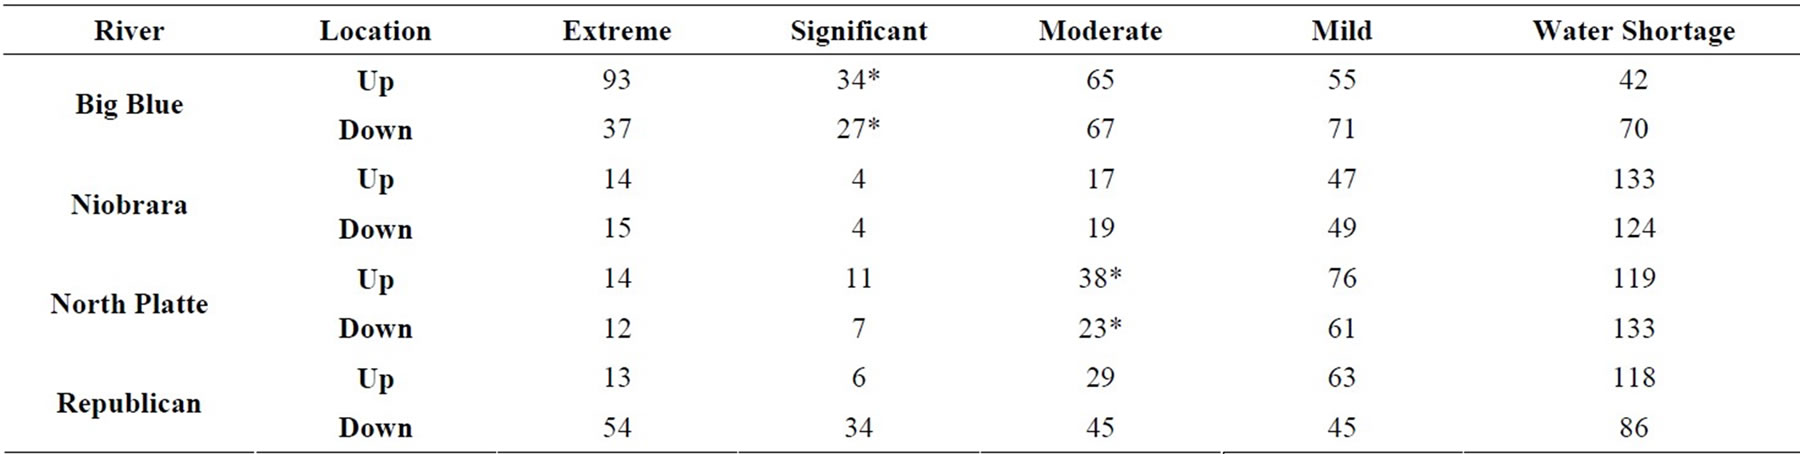
Table 7. Distribution of Drought Duration (DD) of different types for upstream and downstream stations along the four rivers. * denotes significant difference (p<.05).
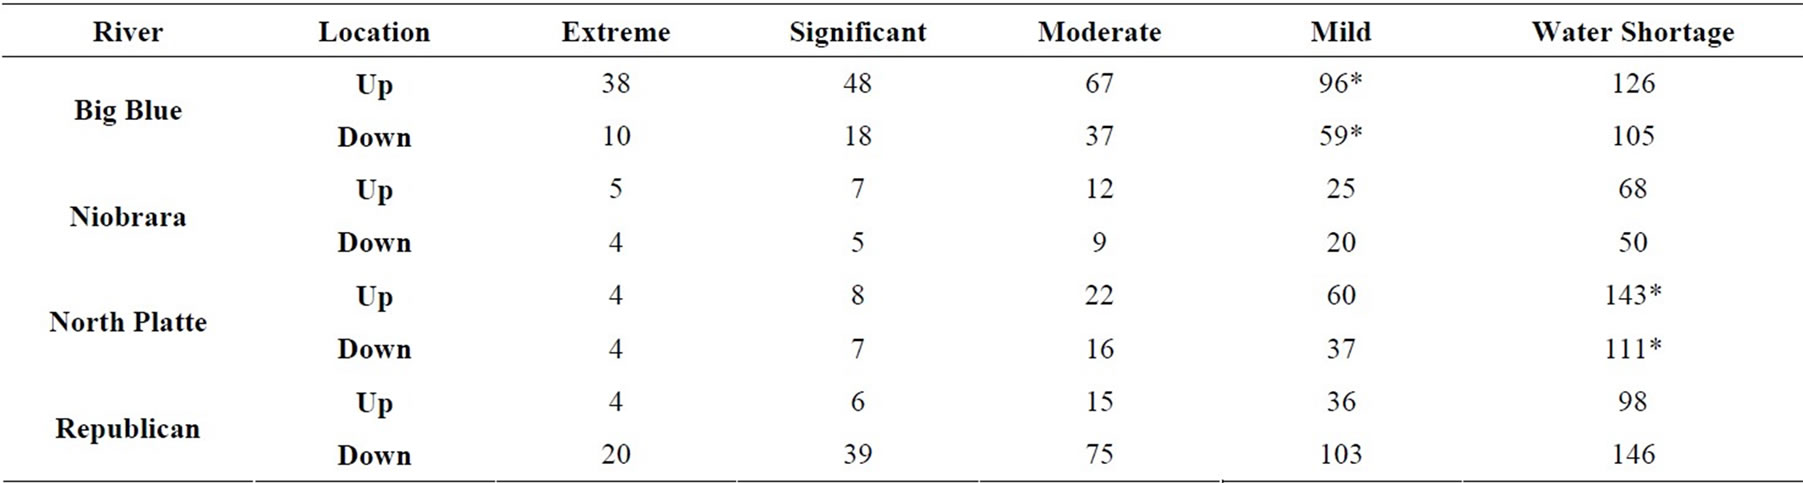
Table 8. Distribution of Annual Maximum Drought Duration (AMD) of different types for upstream and downstream stations along the four rivers. * denotes significant difference (p<.05).
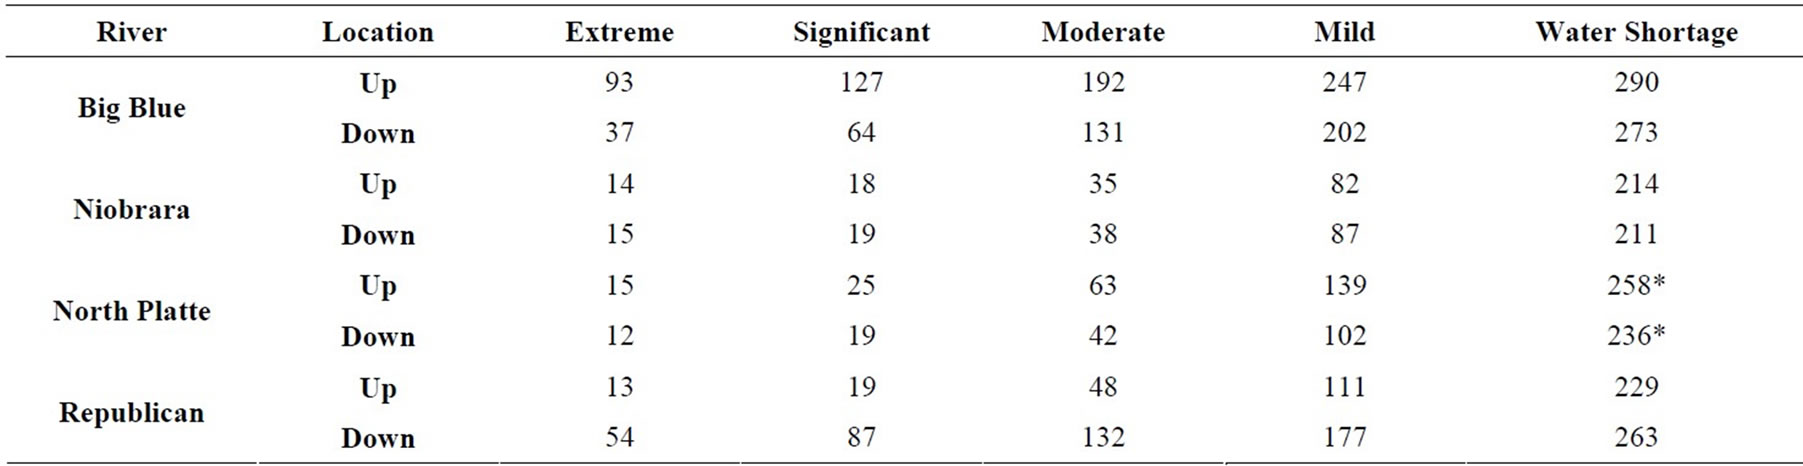
Table 9. Distribution Annual Accumulated Drought Duration (ACD) of different types for upstream and downstream stations along the four rivers. * denotes significant difference (p<.05).
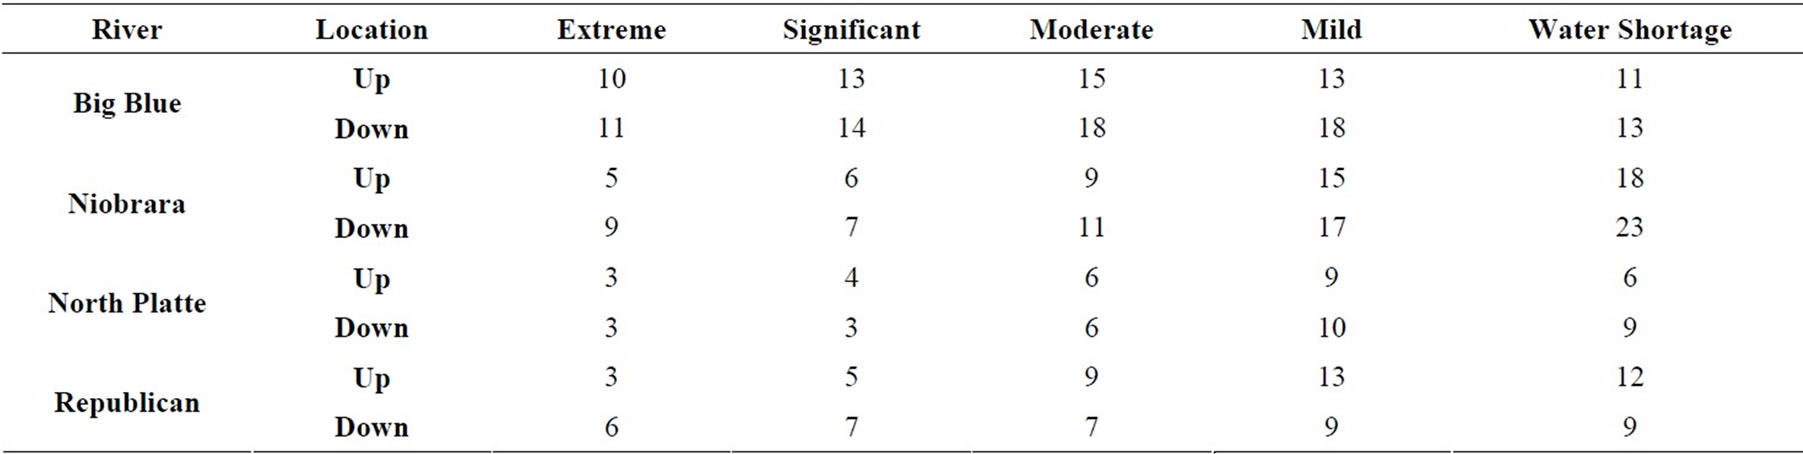
Table 10. Distribution Number of Drought events per year (ND) of different types for upstream and downstream stations along the four rivers. * denotes significant difference (p<.05).
stream and downstream stations along any of the rivers for any of the drought types with the sole exception of North Platte River and only for water shortage events. Table 10 shows that in terms of number of drought events, there is no difference between upstream and downstream stations along any of the rivers.
4.2.6. Discussion on Upstream-Downstream Relationships of Severe Drought Events.
Based on the 5 ´ 5 matrix as shown in Tables 3-6 above, we tried to identify severe drought events in terms of drought level and duration. Since the entries near the lower right portion of the matrix usually have small values, those combinations were not an appropriate definition of severe droughts. If the drought level was set as water shortage, numerous drought events would be identified. Thus, the combination of the mild drought type and a threshold of 3 weeks can be a good definition of severe droughts. As shown in Tables 3-6, the number of 4-, 6-, and 8-week drought is the largest for the Blue River Basin. This is probably due to its small drainage area of the watershed, as well as a small baseflow from the weak hydrologic connection between the river and the principal aquifer. The combined effect of the two situations gives only small amount of water that sustains the streamflow between precipitation events and makes the streamflow highly correlated with precipitation patterns. Although the Platte River watershed has the largest drainage area, the number of 4-, 6-, and 8-week drought is larger than that for the Niobrara and Republican River basins. This is in part attributed to the fact that the streamflow records of the four stations in the North Platte River used in this analysis are about 30 years longer than those of other stations. In 1930’s, a severe drought occurred in Nebraska.
Table 11 summarizes for each station 1) the number of streamflow droughts with duration of three weeks or longer, 2) the largest streamflow drought deficit and its time period, and 3) the longest streamflow drought duration and its time period during the period of record. As can be seen, the numbers of droughts with duration greater than three weeks occurring on each station are about the same for the Big Blue and North Platte Rivers. In contrast, the number of droughts on the Niobrara River increases downstream, indicating that severe drought becomes more frequent downstream. The Republican River shows an opposite pattern: the severe droughts occur at the upstream stations more frequently than the downstream stations.
According to Table 11, the time periods of the drought events with the largest deficit or the longest duration are not necessarily consistent among the upstream and downstream stations along the same river. Over the period 1964-1994 along the Big Blue River, the significant drought events with the largest deficit recorded by the 4 stations occurred in the1970s, while the events with the longest duration occurred in the 1970s, 1980s and 1990s. The largest deficit for stations BB3 and BB4 occurred in 1976 and 1977 (Table 11). This is apparently associated to the below normal precipitation in 1976. Along the Niobrara River during 1957-1991, the three downstream stations (N4-N6) recorded the same severe drought event with the largest deficit simultaneously, while the 3 upstream stations (N1-N3) recorded 3 different events. For the events with the longest duration, it seems that the drought events in recent years tend to last longer because all the 3 upstream stations indicate that the events lasting the longest happened in 1989-1990. The largest deficit at stations N4, N5, and N6 of the Niobrara River occurred in the same year (1976). The precipitation of 1976 measured from the rain gauge at Valentine near the middle stream of the Niobrara River was 32.4 cm, compared to the average annual rate of 55.6 cm from 1948 to 2001.
For the North Platte River in 1930-1991, the one upstream and two downstream stations (NP2-NP4) show the drought events with the largest deficit during 1934- 1935, and with the longest duration during 1954-1955. Although the annual precipitation of 1976 in Scottsbluff of the North Platte River Valley was only 24.7 cm, well below the average of 39.1 cm, this below normal precipitation did not lead to the largest water deficit in the North Platte River. The drought of 1934-35 in Nebraska was apparently much worse.
It appears that 3 out of the 4 stations along the Republican River indicate the severe drought events occurred in 2000-2001 during the study period 1952-2001, suggesting that the significant streamflow drought events become more severe and last longer in recent years. Like other three basins, the Republican River Basin also suffered a drought in 1976. The precipitation was 28.7 cm at a rain gauge of Benkleman, below the average rate of 47.4 cm. It is interesting to note that the precipitation in 2000 was 45.8 cm, only slightly below the average precipitation rate. Yet, as shown in Table 11, the largest deficit and longest duration of drought for a couple of stations in the Republican River occurred in 2000.This might be caused by increasing water use and human activities on this river. Another possible reason is that the study periods of the other 3 rivers do not cover the very recent years due to the lack of records. So it is impossible to accurately show the drought situation in the very recent years. A severe drought started in 1999 and continued to 2006 in Nebraska and other High Plains region.
Table 11 also reveals the impacts of several major severe droughts in Nebraska history through the statistics of the largest deficit and the longest drought duration for each station. In the North Platte River, the drought of the 1930s was the longest dry period for Nebraska in recent history [16] and is often referred to as the Dust Bowl (see Stations NP2, NP3 and NP4 on the North Platte River).
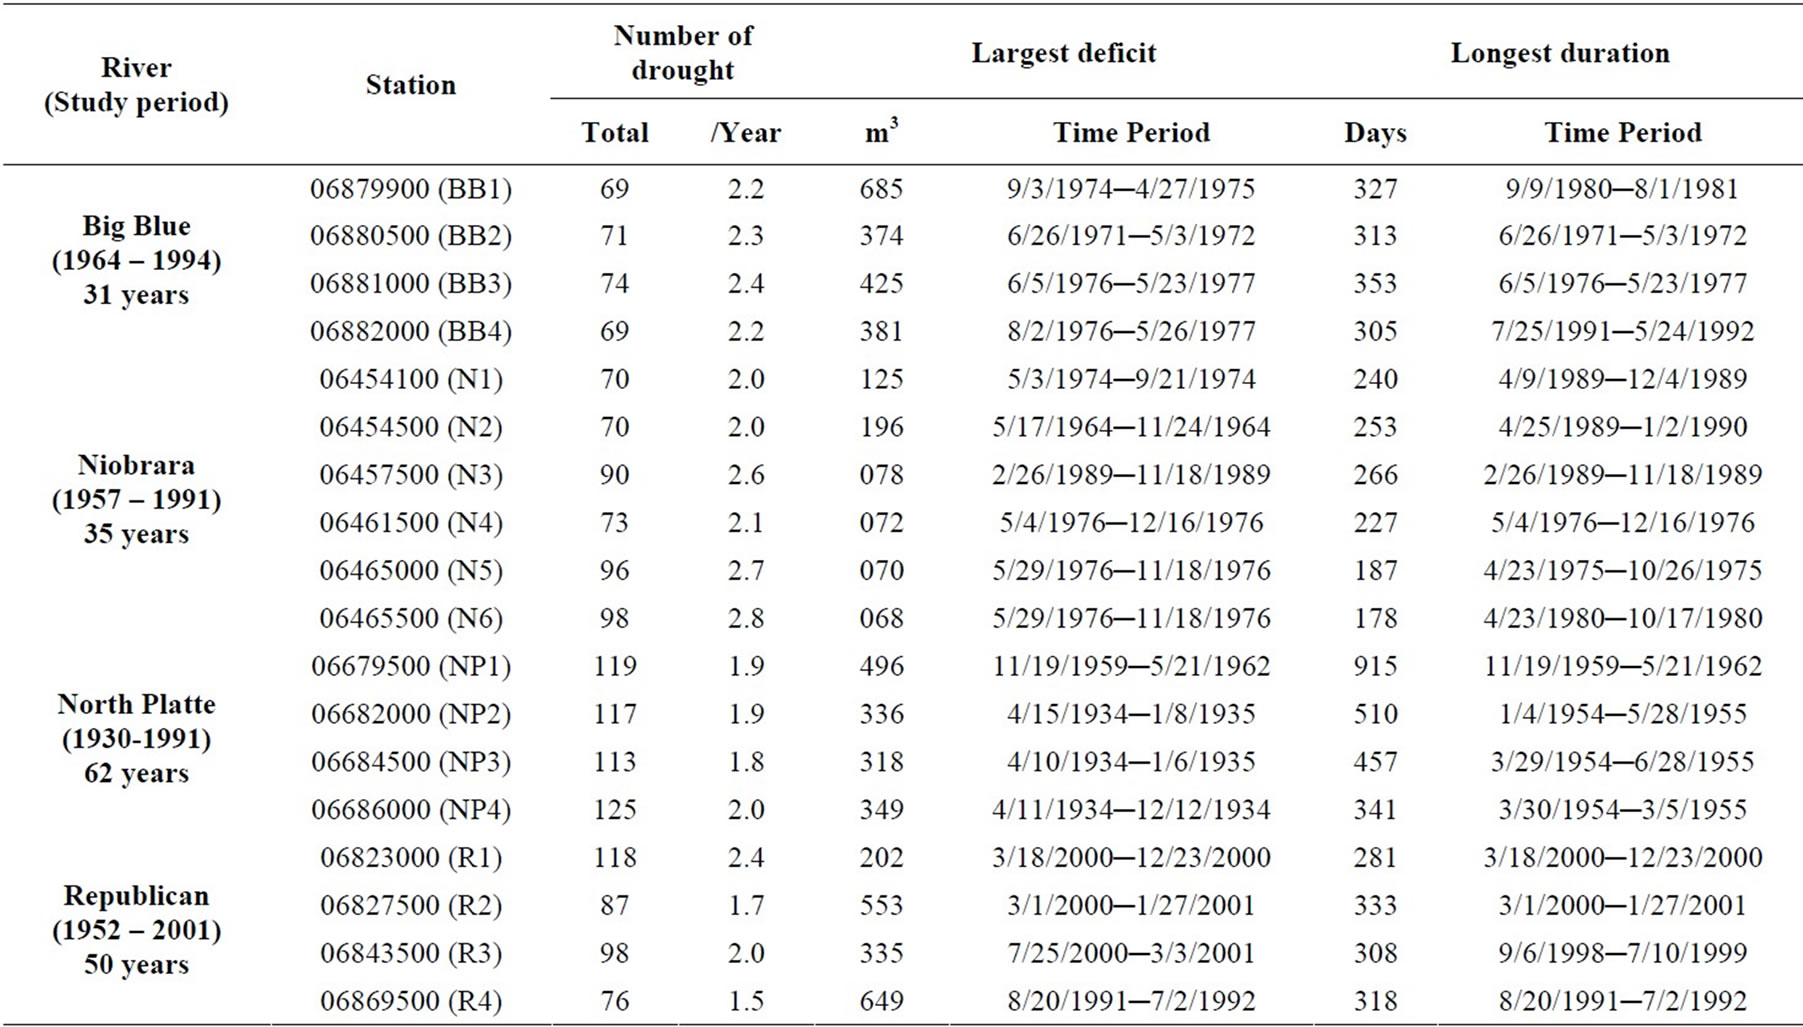
Table 11. Statistics on drought events of duration of at least three weeks.
For the Big Blue River Basin and the Niobrara River Basin, a major drought within the study periods occurred in the mid-1970s. This drought resulted in loss of over $10 million in eight counties ([14]; see Stations BB1, BB3 and BB4 on the Big Blue; N1, N4, N5 and N6 on the Niobrara River). In addition, the year of 2000 was a severe drought year ([31]; see stations R1, R2 and R3 on the Republican River).
It is interesting to note that some severe droughts with the largest deficit or the longest duration indicated by some stations were not recorded as a major drought event in Nebraska history (e.g., station NP1 on the North Platte River during 1959-1962). Reasons for such omissions need to be investigated further.
Statistical analysis shows that the difference in the largest deficit between upstream and downstream stations along any of the four rivers is not statistically significant. The same is also true for the longest drought duration for all the rivers except the Niobrara River.
5. Summary
In this paper, the upstream-downstream association in terms of the basic statistical characteristics of annual flow discharge and the streamflow drought severity and frequency were explored on 18 stream gauge stations along 4 major rivers in Nebraska: the North Platte, Niobrara, Big Blue and Republican Rivers. We used the paired t-test and ANOVA with MIXED procedure to test whether there were any significant differences in terms of streamflowand drought-related parameters between upstream and downstream stations. Overall, the statistical tests showed that there are not many significant differences between upstream and downstream stations along the four rivers.
Based on the results of the two comparative studies, the following upstream-downstream relationships are summarized for each river:
• For the Big Blue River, the four stations are consistent with respect to the coefficients of variation and positive slopes of the annual mean discharge, the distribution of the annual highand low-flow seasons, and the total number of severe drought events occurring during the study period. The severity and frequency of drought events are also similar among the upstream and downstream stations during 1964-1985. After that period, the droughts at downstream stations become more intense, more frequent and last longer than the upstream droughts.
• For the North Platte River, the four stations show the consistency on the positive slopes of the annual mean discharge, the distribution of the highand low-flow seasons, the severity of drought events and the number of severe droughts. On the other hand, the coefficients of variation of the annual mean discharge increase from downstream to upstream, and the downstream stations show a higher number of drought occurring each year than the upstream stations for the entire study period. Because the stations studied are all located upstream of the lake and dam, the conclusions are not as reliable and can only be applied on the upstream segments.
• For the Niobrara River, the six stations only show consistency on the coefficients of variation of the annual mean discharge and the distribution of the annual highand low-flow seasons. The stations demonstrate mixed signs of the annual discharge trend slope, either positive or negative. Furthermore, the upstream stations encounter more severe droughts in recent years, while the downstream stations encounter droughts more frequently. This complex upstream-downstream relationship on the Niobrara is attributed to its diverse nature and its journey through the Sandhills region.
• The relationships along the Republican River are also complex as expected. The only agreement among the four stations is the negative trend slope of the annual mean discharge. The stations exhibit inconsistencies in other statistical characteristics: increasing coefficients of variation from upstream to downstream, varying distributions of highand low-flow seasons. In addition, the results suggest that the upstream stations suffer from drought more severely and more frequently in recent years. Obviously, the water use activities such as reservoir regulation, canal diversion, and groundwater pumping in the Republican River Basin influence the relationships.
The streamflow drought conditions and statistics differ in each of the four watersheds. They can be influenced by fluctuation of precipitation, the size of drainage area, soil types, hydrologic connection between river and groundwater systems, and the demand levels on surface and groundwater. Below-normal precipitation seems to be the most important factor contributing to the largest deficit of streamflow. Diversion of stream water to canals and reservoir regulation are probably other major factors resulting in different features of streamflow drought and statistics among individual rivers reaches within a watershed. Future work includes conducting the above analysis for the irrigation season (June-September) to identify the impact of streamflow diversion and groundwater pumping on the streamflow and drought events.
6. Acknowledgement
This work was sponsored by an NSF Information Technology Research (ITR) grant (ITRF#IIS00219970). The authors would like to thank Bill Waltman, the United States Geological Surveys (USGS), the United States Department of Agriculture (USDA), the High Plains Regional Climate Center (HPRCC), and the National Drought Mitigation Center (NDMC) for support in domain knowledge and expertise. The authors would also like to thank Lei Fu, Jing Zhang, Songjie Wei, Jeff Mahnke, and Fujiang Wen for their programming work.
REFERENCES
- T. F. Homer-Dixon, “Strategies for studying causation in complex ecological political systems,” Occasional Paper, The Myth of Global Water Wars.
- C. A. Flowerday, Ed., “Flat water: A history of nebraska and its water, conservation and survey division institute of agricultural and natural resources,” University of Nebraska-Lincoln, Resource Report, No. 12.
- H. Hisdal and L. M. Tallaksen, Eds., “Assessment of the regional impact of droughts in Europe,” Drought Event Definition,Technical Report, No. 6, pp. 41, 2002.
- M. P. Lawson, A. Reiss, R. Phillips, and K. Livingston, “Nebraska droughts: A study of their past chronological and spatial extent with implications for the future,” Occasional Papers, Department of Geography, University of NebraskaLincoln, No. 1, pp. 147, 1971.
- L. B. Leopold, “A view of the river,” Harvard University Press, Cambridge, MA, pp. 298, 1994.
- H. F. Lins and J. R. Slack, “Streamflow trends in the United States,” Geophysical Research Letters, Vol. 26, No. 2, pp. 227−230, 1999.
- M. A. Miah, “Man-made climatic changes in the Ganges basin,” International Journal of Climatology, Vol. 22, pp. 993−1016, 2002.
- R. Neff, H. Chang, C. G. Knight, R. G. Najjar, B. Yarnal, and H. A. Walker, “Impact of climate variation and change on Mid-Atlantic region hydrology and water resources,” Climate Research, Vol. 14, pp. 207−218, 2000.
- C. Revenga, S. Murray, J. Abramovitz, and A. Hammond, “Watersheds of the world: Ecological value and vulnerability,” World Resources Institute and Worldwatch Institute, Washington DC, 1998.
- D. A. Wilhite, “Government response to drought in the United States: With particular reference to the Great Plains,” Journal of Climate and Applied Meteorology, Vol. 22, pp. 40−50, 1983.
- V. Yevjevich, “An objective approach to definition and investigation of continental hydrologic droughts,” Hydrology Paper, Colorado State University, Fort Collins, Colorado, 1967.
- E. Zelenhasic and A. Salwai, “A method of streamflow drought analysis,” Water Resources Research, Vol. 23, No. 1, pp. 156−168, 1987.
- Nebraska Agricultural Statistics Service, http://www.agr. state.ne.us/agstats/cropwthr.htm (accessed in 2009).
- F. J. Wen and X. H. Chen, “Evaluation of the impact of groundwater irrigation on streamflow depletion in Nebraska,” Journal of Hydrology, Vol. 327, pp. 603−617, 2006.
- N. Peranginangin, R. Sakthivadivel, N. R. Scott, E. Kendy, and T. S. Steenhuis, “Water accounting for conjunctive groundwater/surface water management: Case of the Singkarak-Ombilin river basin, Indonesia,” Journal of Hydrology, Vol. 292, pp. 1−22, 2004.
- H. Hisdal, K. Stahl, L. M. Tallaksen, and S. Demuth, “Have streamflow droughts in Europe become more severe or frequent,” International Journal of Climatology, Vol. 21, pp. 317−333, 2001.
- A. Bleed, “Groundwater in an atlas of the sand hills,” A. Bleed and C. Flowerday (Editors), Conservation and Survey Division, University of Nebraska-Lincoln, Lincoln, Nebraska, Resource Atlas, No. 5b, pp. 67−92, 1989.
- SAS Institute Inc. SAS System Version 9.1, SAS Institute Inc. Cary, NC.
- J. A. Dracup, K. S. Lee, and E. G. Paulson, Jr., “On the definition of droughts,” Water Resources Research, Vol. 16, pp. 297−302, 1980.
- L. M. Tallaksen, “Streamflow drought frequency analysis,” in J. V. Vogt and F. Somma, Eds., “Drought and drought mitigation in Europe,” Kluwer Academic Publishers, Derdrecht, pp. 103−117, 2000.
- J. Abaurrea and A. C. Cebrián, “Drought analysis based on a cluster Poisson model: Distribution of the most severe drought,” Climate Research, Vol. 22, pp. 227−235, 2002.
- D. A. Wilhite, “Drought as a natural hazard: Concepts and definitions,” Chapter 1, in D. A. Wilhite, Ed., “Drought: A global assessment,” Natural Hazards and Disasters Series, Routledge Publishers, U. K., 2000.
- D. R. Helsel and R. M. Hirsch, “Statistical methods in water resources: Techniques of water resources investigations of the United States geological survey,” Book 4, Chapter A3, Hydrologic Analysis and Interpretation, pp. 510, 2002.
- D. Yang, B. Ye, and D. L. Kane, “Streamflow changes over Siberian Yenisei river basin,” Journal of Hydrology, Vol. 296, pp. 59−80, 2004.
- D. P. Lettenmaier, E. F. Wood, and J. R. Wallis, “Hydroclimatological trends in the continental United States: 1948‑1988,” Journal of Climate, Vol. 7, pp. 586−607, 1994.
- A. Tabidian and D. T. Pederson, “Impact of irrigation wells on baseflow of the big blue river, Nebraska,” Water Resources Bulletin, Vol. 31, No. 2, pp. 295−306, 1995.
- S. Stefan, M. Ghioca, N. Rimbu, and C. Boroneant, “Study of meteorological and hydrological drought in southern Romania from observational data,” International Journal of Climatology, Vol. 24, pp. 871−881, 2004.
- E. Kahya and S. Kalayci, “Trend analysis of streamflow in Turkey,” Journal of Hydrology, Vol. 289, pp. 128−144, 2004.
- USGS, U. S., Geological Survey, http://water.usgs.gov/ nsip (accessed in 2009).
- X. H. Chen and L. C. Shu, “Groundwater evapotranspiration captured by seasonally pumping wells in river valleys,” Journal of Hydrology, Vol. 318, pp. 334−347, 2006.
- G. J. McCabe and D. M. Wolock, “Trends and temperature sensitivity of moisture conditions in the conterminous United States,” Climate Research, Vol. 20, pp. 19−29, 2002.