Journal of Water Resource and Protection
Vol. 1 No. 4 (2009) , Article ID: 755 , 10 pages DOI:10.4236/jwarp.2009.14028
Using MODIS Images and TRMM Data to Correlate Rainfall Peaks and Water Discharges from the Lebanese Coastal Rivers
1CRS, National Council for Scientific Research, P. O. Box 11-8281, Beirut, Lebanon
2SPCS, Department of Earth and Environmental Sciences, Northeastern University, MA, USA
3Center for Remote Sensing, Boston University, 685 Commonwealth Avenue, Boston, MA. USA
E-mail: geoamin@gmail.com
Received June 8, 2009; revised July 22, 2009; accepted July 31, 2009
Keywords: Plume, Rainfall, MODIS Image, Coastal Rivers, Lebanon
ABSTRACT
Water flows from rivers into the sea (plumes) is a common phenomenon in many coastal zones. The hydrologic behavior of plumes differs from one river to another depending on rainfall rate and intensity, as well as it is influenced by the hydrologic characteristics of river basin. In order to investigate the precipitation regime in a drainage basin versus the flow into the sea, sequential data must be available. Remotely sensed data can fulfill this scope, thus it can provide climatic and hydrologic data. The scope of this study is to monitor the behavior of water input in the catchments versus the output from rivers in the Lebanese coastal zone using remote sensing data. For this purpose, TRMM (Tropical Rainfall Mapping Mission) data and MODIS satellite images were used. Hence, rainfall data from TRMM was compared with the areal extent of water plumes from rivers. This enables establishing interpolation between water input/output for each river basin. In addition, the lag time and residence time of plumes into the sea can be measured and compared between the issuing rivers. The extracted data from remote sensing was compared with terrain measures and shows its reliability and accordance. The used approach proved to be creditable, non-invasive and cost effective and can be applied to other costal river basins.
1. Introduction
Water runoff into the sea has been received substantial attention in several coastal zones worldwide, in time many of these zones experience water shortage. This is well pronounced in arid and semi-arid regions, like the case of the Middle East.
The Eastern Mediterranean is typical example for this the hydrologic phenomenon. Hence, studies carried out in this regard include the coast of Lebanon, Arabian Sea and the Arabian Gulf [1–9] The discharged freshwater into the sea occurs either as direct surface runoff (i.e., from rivers and streams), or as groundwater discharge, which is commonly called “submarine springs ” and sometime as “invisible rivers”.
In Lebanon, high precipitation rate (i.e., averaging 950-1100 mm) results large amounts of surface water that rapidly flows towards the sea due to steep terrain. Also, there is groundwater seeps from coastal aquifers to the sea along the bedding planes of rocks, which encompass often with acute dip. Additionally, the intensive fracture systems increase the flow regime of groundwater seaward.
The coastal zone of Lebanon (33° 03′ 17"; 34° 40′ 00" N, and 35° 06′ 11”; 36° 19′ 16" E) is mountainous, with narrow coastal plain (<5km). It has an area of about 5000 km2. The width of this area is less than 50km and extends from the sea to mountain crests to the east. The length of the area is about 225 km (Figure 1).
The area of concern is a good example for surface and subsurface water flow to the sea, which is considered as losses. There are many studies in Lebanon tackled this hydrologic phenomenon. Many of these studies have been performed to identify the sources of groundwater discharges in the sea, such as those by [1,2], [10–13] and [8]. Besides, studies to utilize rivers water and their quantitative assessment are negligible, which is often attributed mainly to the lack of data.
In Lebanon, there are fourteen major rivers. Three of them are inner ones and originate from the Bekaa plain (i.e. a depression located between the major two mountain chains of Lebanon). The coastal rivers flow directly to the Mediterranean Sea. One of the inner rivers (the Litani River), is originates from the plain and flow southward, then diverts to the west where it also outlets in the sea (Figure 1); therefore, it was not included in this study because the threshold of its basin located outside of the study area. Also, El-Kabir River, which is a coastal one in the north, was not involved in this study, since the large part of its basin is located in Syria.
According to the available hydrologic records, the maximum reported average discharge from the Lebanese coastal rivers is approximately 408 million m3/year, which in Ibrahim River and the minimum discharge is 55 million m3/year in Siniq River [14]. The large variance in discharge between these rivers is not related to the catchment area or to the river’s length, etc. [15].
In the study area, the largest catchment is 480 km2 for Abou Ali River [16], with an average discharge of about 269 million m3/year. The hydrologic characteristic differs from one river to another. This is obvious in the drainage density, relief gradient, meandering ratio and width/length ratio [9]. It can be attributed to the existence of different rock lithologies and intensive structures (e.g. faults and fractures).
Filed observations and available data from rainfall records show direct relationship between rainfall intensity and flow regime of surface runoff to the sea (i.e., plumes), but the mechanism and dynamics of flow are still undefined.
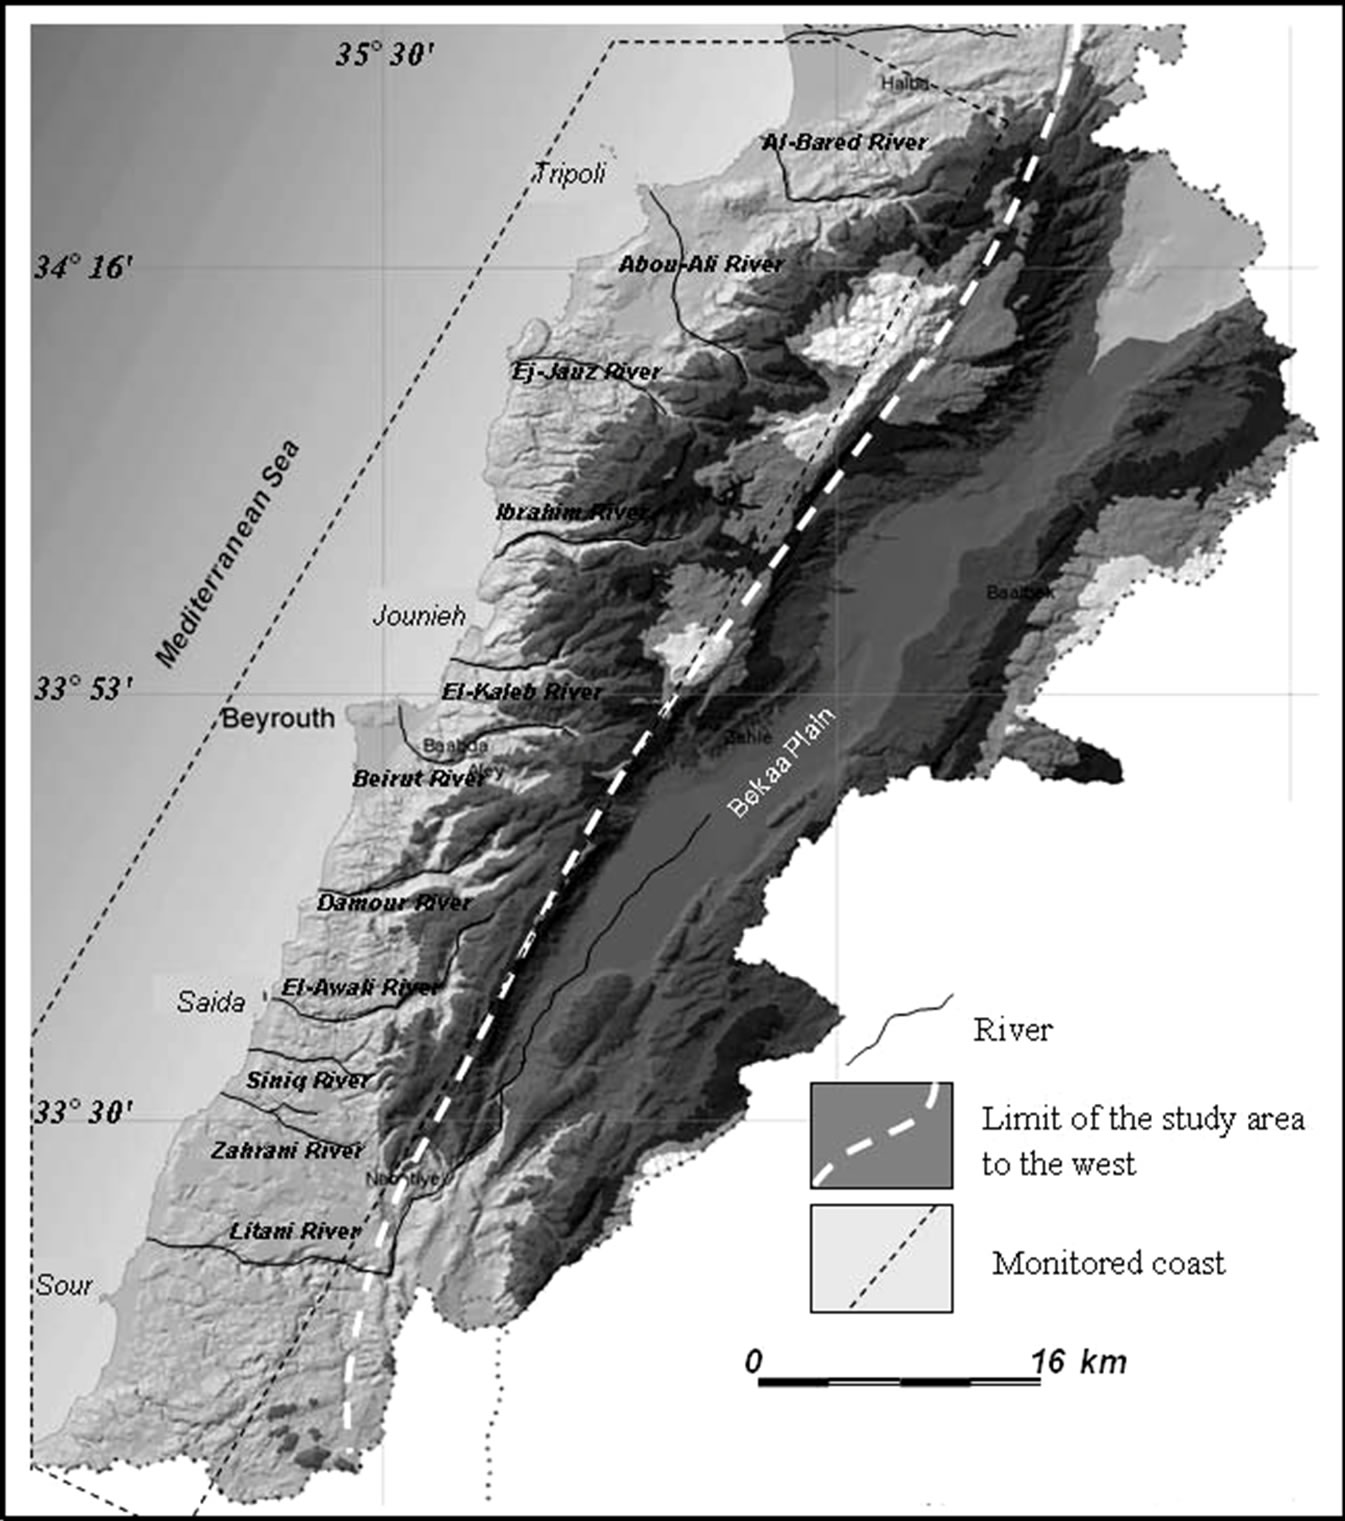
Figure 1. Location map of the study area
In Lebanon, most instruments used to measure rivers discharge (i.e. hydrographs and flow-meters) were destroyed during the past three decades, and only a limited number of them remains operational. This decreases the availability of data, notably in a sequential time series. Therefore, the use of remote sensing techniques, combined with field surveys, could compensate the lack of data and fill gaps in hydrologic and climatic records, like the case in the area of concern.
In this study, two types of remotely sensed data were utilized. The first is the TRMM (Tropical Rainfall Mapping Mission) data, which illustrates rainfall amounts and peaks. The second one is the satellite images of MODIS-Terra, which enable detecting sea surface temperature, thus observing the areal extent of water plumes from rivers, and consequently estimating the volume of discharged water in the sea.
The main objective of this study is to use remote sensing data as a monitoring system between rainfall and water flow from rivers, thus applying comparative analyses for each river basin separately. Also, assuring the creditability of remotely sensed data as a supporting tool to ground measuring stations. It is a cost-effective approach to monitor and assess the hydrologic regime of rivers and the relation to their basins. Also, it interprets a number of hydrologic criteria, such as the existing of small-scale plumes (i.e. low discharge) from river basins with high rainfall and vise versa. The used approach also reflects the hydrologic characteristics of basin terrain.
2. Method and Data Sources
The main implication of this research is a monitoring approach of water flow from rivers versus rainfall peaks. Fresh water flow in the sea can be monitored using thermal data from MODIS-Terra images. These images are acquired on daily basis. While, sequential series of rainfall data are also available from TRMM data daily. In this study, data comparison was carried out for the period from January 2002 till February 2003, in total 396 days. The selection of this year based on the availability of ground measures from gauge stations and flow-meters. This enables obtaining comparison between data from remote sensing and ground data.
The emphasis was on rainfall peaks, after which monitoring the areal extent of water flow in the sea (plumes) starts for each river basin. With this premise, the time period between the date of rainfall peak and the appearance of water plumes in the sea (i.e. lag time) was calculated, as well as the residence time of the plume in the sea (i.e., time the plume remains on sea surface). This allows assessing of the hydrologic dynamics of flowing water and the terrain characteristics for each basin that captures rainfall water and diverts it seaward.
2.1. TRMM Data
Operational meteorological stations in Lebanon are insufficient, and in some regions rare. In addition, the existing stations are not evenly distributed and are not closely spaced to present a comprehensive figure on rainfall.
In this study, a continuous rainfall record was adopted from TRMM rainfall data. TRMM is a joint mission between NASA and the Japan Aerospace Exploration Agency (JAXA) and was primarily designed to study and monitor tropical rainfall. This data is acquired globally, and is free of charge. It can be retrieved either as graphic illustrations/ or as contour maps for any area worldwide and to any selected time interval.
Also, in this study the creditability of TRMM data was investigated by comparing it with the available data from ground stations. Thus, it was indicated that the daily rainfall records from TRMM were almost coincident with the available records, and thus suitable to be used for the purpose of rainfall monitoring for each river basin independently.
2.2. MODIS-Terra Data
Thermal satellite images were used in this study to observe the water flow from rivers in the sea (plumes). It is mainly a process to monitor the time of water occurrence and its geographic distribution in the sea. The concept of plume identification based on measuring sea surface temperature (SST). Thus, freshwater is often cooler than saltwater, and this enables applying thermal differentiation between them by using thermal bands in MODIS images.
MODIS-Terra satellite images are useful in this regard, since they are retrieved two times a day, and can facilitate sequential monitoring of water flow. The selection of the images based on their coincidence time with the available records of rainfall peaks observed in the TRMM data.
In this study, day and night time Level 2 11µm MODIS-Terra images were retrieved from the Goddard Space Flight Center “DISC” website, which is also introduced by NASA. The spatial resolution of the used images is 250m, which is adequate for the purpose of this study. Images were downloaded for the period from January 2002 to February 2003 (~ one-year time interval). However, not all retrieved images were suitable for analysis, because of clouds masking, missing data in some instances, or due to other irregularities, such a stretching (Figure 2).

Figure 2. Two thermal MODIS images. The left one is not suitable for analysis because of extensive cloud cover, compared with the right one.
All selected images required geo-referencing procedures. Geo-referencing is needed to co-register the images; store them in a GIS database; and enable the geolocation of satellite observations in the sea and on land. This was performed using PCI’s Geomatica GCPworks software, thus applying the UTM coordinate system and WGS84 datum. To attain clear observation, the advantage of digital enhancement was applied on the used images. The ENVI (Environment for Visualization Images) software was used for image processing.
The temperature difference between river water and seawater can be measured directly from MODIS image by selecting any point of interest in the sea. However, the resulting value from the image is primarily inaccurate and needed to be converted to the real temperature value.
A scaling/conversion algorithm is applied using the band math option, in order to map the “real” temperature in degrees Celsius. The scaling conversion equation is:
Scale type = "Y= Slope * X + Intercept";
Slope = 0.0099999998; Intercept = -300 f;
Y (in Deg C) = 0.01 times X-300 The difference in temperature between cooler freshwater plumes and the ambient temperature of seawater is called “thermal anomaly”. In order to identify thermal anomalies on the images, a number of digital and optical advantages must be applied, such as density slices, enhancement, stretching, color scaling, etc. Figure 3 shows an example of thermal anomalies with temperature differences.
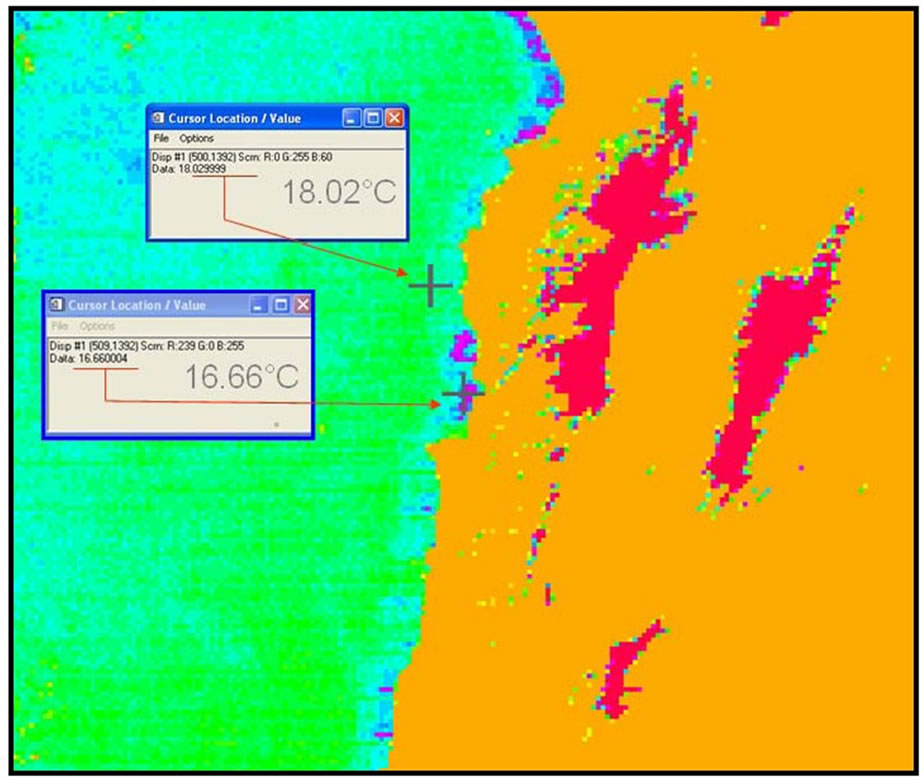
Figure 3. Density sliced MODIS images showing different temperature levels and cool freshwater plumes.
The temperature difference along the investigated coast is often found to range between 2 and 4 Celsius, and varies slightly with the climatic conditions. The abrupt change in temperature indicates high-energy of water flow from rivers in the sea that allows no enough time for mixing seawater and freshwater.
Accordingly, the Lebanese coastal zone encompasses a number of groundwater discharges (submarine springs) [8]; however, these discharges were eliminated in this study in order to focus only on water plumes from occurred from rivers. This was done through the application of Geographical Information System (GIS) techniques. In this case, processed satellite images were overlain on topographic maps to show the exact geographic location of the outlets of river into the sea. Hence, only thermal plumes correspond with river outlets were considered.
2.3. Rainfall/Water Flow Responses
TRMM and MODIS data were prepared and the obtained results were tabulated for the selected period. This was a perquisite step for data correlations to assess the rainfall/ water-flow relationship, the scope of this study. Consequently, a number of hydrologic relations were obtained as shown in Figure 4.
As a first step, the amount of rainfall as extracted from TRMM data was measured in millimeters (mm), and then it was multiplied by the area of the catchment (i.e., km2) to convert it to million m3 per day. The extent of water plumes into the sea was measured in km2. Units were standardized for all calculations. This was applied to all studied rivers for the selected period.
Five key elements were utilized for quantitative analysis (Figure 4; Tables 1 and 2). These are:
1) Rainfall peaks, which represent torrential rain events and intensity and their behavior (i.e. ascending or descending trends)2) The coincidence between the plume area (PA) and recorded rivers discharge from gauging stations (Qm). It can be obtained by interpolating both parameters, and this enables recognizing rivers discharge from the areal extent of the plume as it appears in satellite image3) Lag time (τ) between precipitated water and the existence of water plumes into the sea, which is indicative to several terrain parameters including mainly, recharge, geology, slope and land cover/use4) The spatial extent of plumes into the sea (PA) after each rainfall peak, and this is related to water flow energy as well as the terrain parameters mentioned in point 35) The ratio between the area of plumes with respect to the recorded discharge (Rpd).
3. Results
In coastal zone of Lebanon, rivers discharge varies according to the terrain characteristics of the corresponding basins, particularly the rainfall; geology and land cover use and water exploitation. For example, although the catchment area of El-Bared River is 202 km2 and equals two times that of Zaharai River (140 km2), yet the discharge from the Zaharai River (225 M m3) is equals to 1.5 times that of El-Bared River (155 M m3).
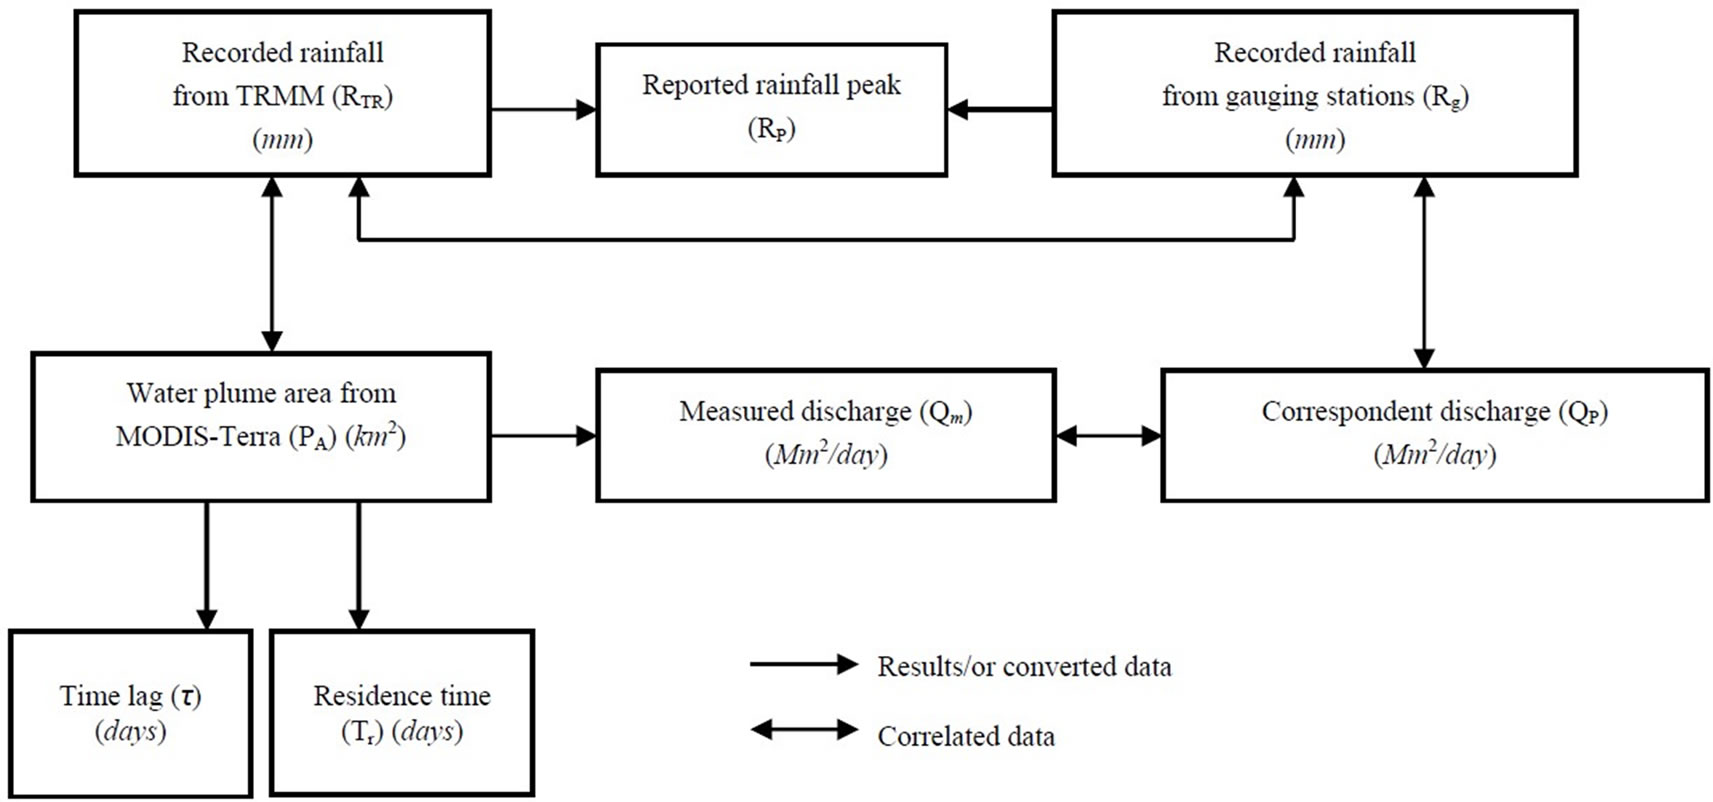
Figure 4. Schematic diagram showing the relationships of different hydrologic elements.
Therefore, monitoring the mechanism between water captured by a river basin and water discharged allows diagnosing the hydrologic behavior and even the anthropogenic activity for each basin. The availability of hydrologic and climatic records in combination with remotely sensed data gives a chance to obtain a monitoring approach. This can be easily done since the TRMM data provides daily information on rainfall, and also MODIS-Terra data provides daily images of the existing plumes in the sea. Hence, the use of TRMM and MODIS-Terra data, enables establishing a number of hydrologic relationships by the integration of different hydrologic elements (i.e., rainfall peaks, PA, Qm, τ and Rpd). The relationships might exist between two or more of these elements as illustrated in Figure 4.
As an example, Table 1 illustrates the calculation that carried out for the Abu Ali River (Figure 1). It shows that plumes appear in the Sea 3-4 days after a rainfall event takes place. These plumes were only visible for one day before disappear, as observed in 250m spatial resolution MODIS images. This timing of events varies in the issuing Lebanese costal rivers (Table 2), where the lag times ranges between 1 and 4 days, and residence times between 3 and 8 days.
3.1. Rainfall Gauges (Rg) and TRMM Data (RTr)
Several worldwide studies have used TRMM data as a reliable source of rainfall information (examples are: [16,17]). In this study, rainfall records from available gauging stations were compared with TRMM data as an verifying approach for TRMM data (Table 2). Thus, both almost show similar results in a clear coincidence in the trend of rainfall amounts (i.e., ascending and descending), though the recorded amounts of rainfall from gauging station were found to be a little bit exceeded (example in Figure 5).
In average, the ratio of TRMM values for all rivers to the recorded data is 1:1.35 (Table 2). This often exists with peaks (main rainfall events). The lower values of rainfall appears in TRMM data is attributed to a distortion in the satellite images that may might occur during torrential events, thus creates error in data simulation. In general, the use of TRMM data is a capable tool to acquire rainfall information, notably in a time ground data is lacking.

Table 1. Example of datasets that are available for the Abou Ali River as recorded from field gauges, and TRMM and MODIS-Terra data. It shows plumes appear approximately 3-4 days after a rain event and are only visible for 1 day at 250m spatial resolution.
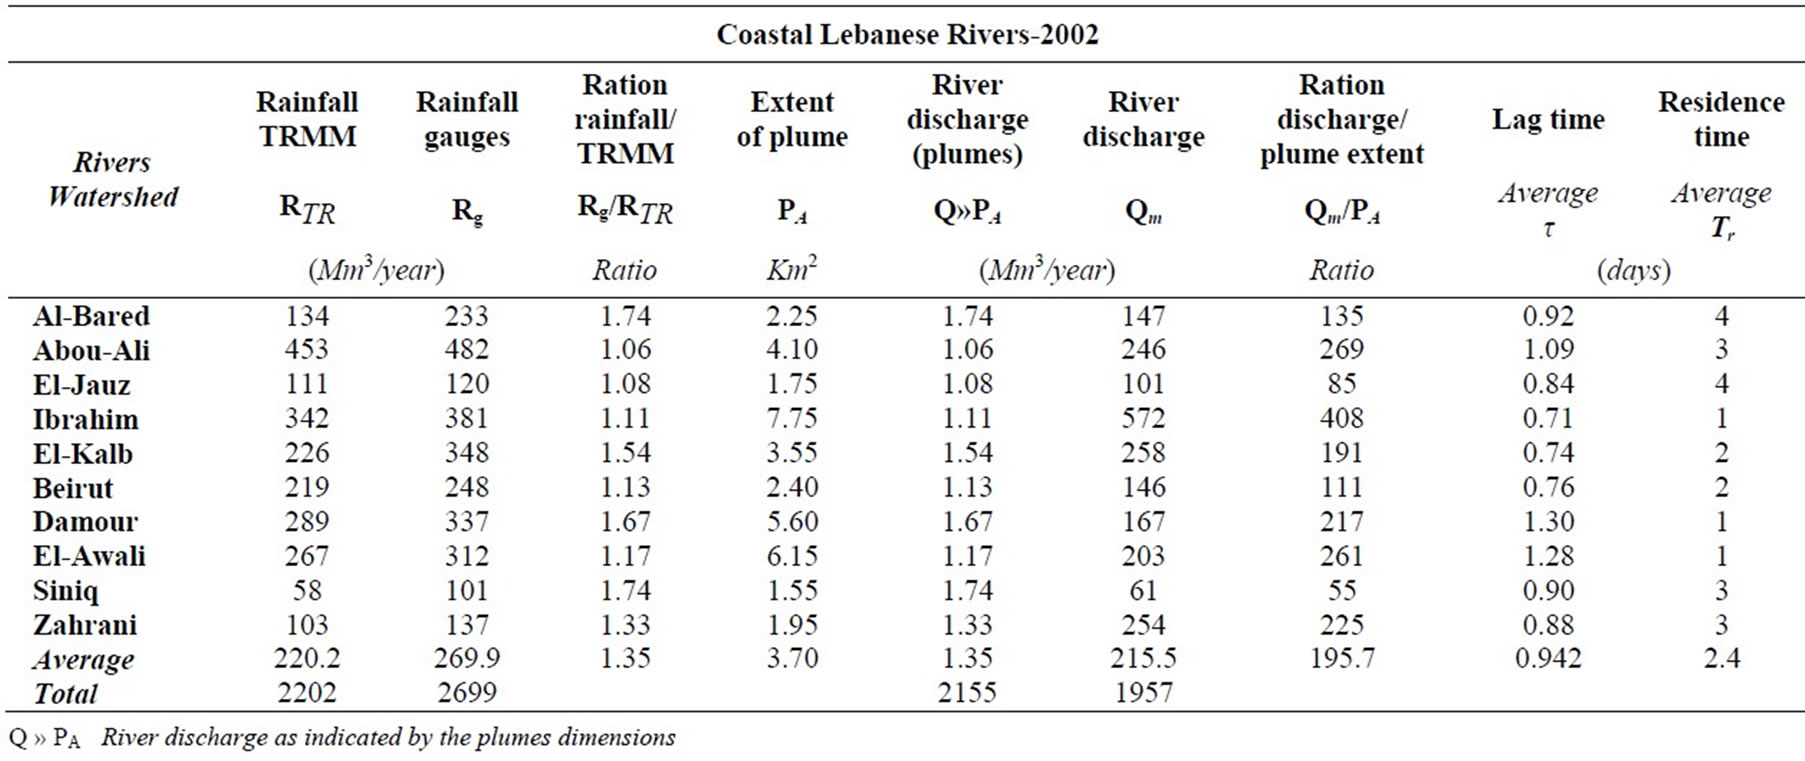
Table 2. Major hydrologic components as obtained from TRMM, MODIS-Terra and field data for all 10 rivers investigated in this research.
Additionally, TRMM has been commonly used a data source, and utilized by many studies to support the ground recorded from gauging station [15,18]. The lack of sufficient gauging stations and the non-uniform geographic distribution is a major problem in data accuracy. Also, rainfall stations receive the amount of water that fall directly on the gauges, while TRMM estimates a comprehensive spatial cover. For this reason, in this study the average value was considered from both sources (Table 1).
3.2. Plumes Area (PA) and Rivers Discharge (Qm)
During dry seasons, water flow from rivers becomes low; consequently water plumes can not be well noticed due to their small-scale area. However, in normal climatic conditions, the flow the discharging from rivers become regular and this in turn gives enough time to the mixing between fresh and saltwater, hence water plumes are obviously seen. Therefore, the best observable plumes can be detected in regular conditions after rainfall slowdown. In this respect, some plumes along the Lebanese coast exceed an area of about 10km2, like the case of Ibrahim River.
Normally, the areal extent of a plume on sea surface has a direct proportion with rivers discharge. Thus, the spatial extent of a plume, as well as the time it needs to exist on sea surface differs from one river to another
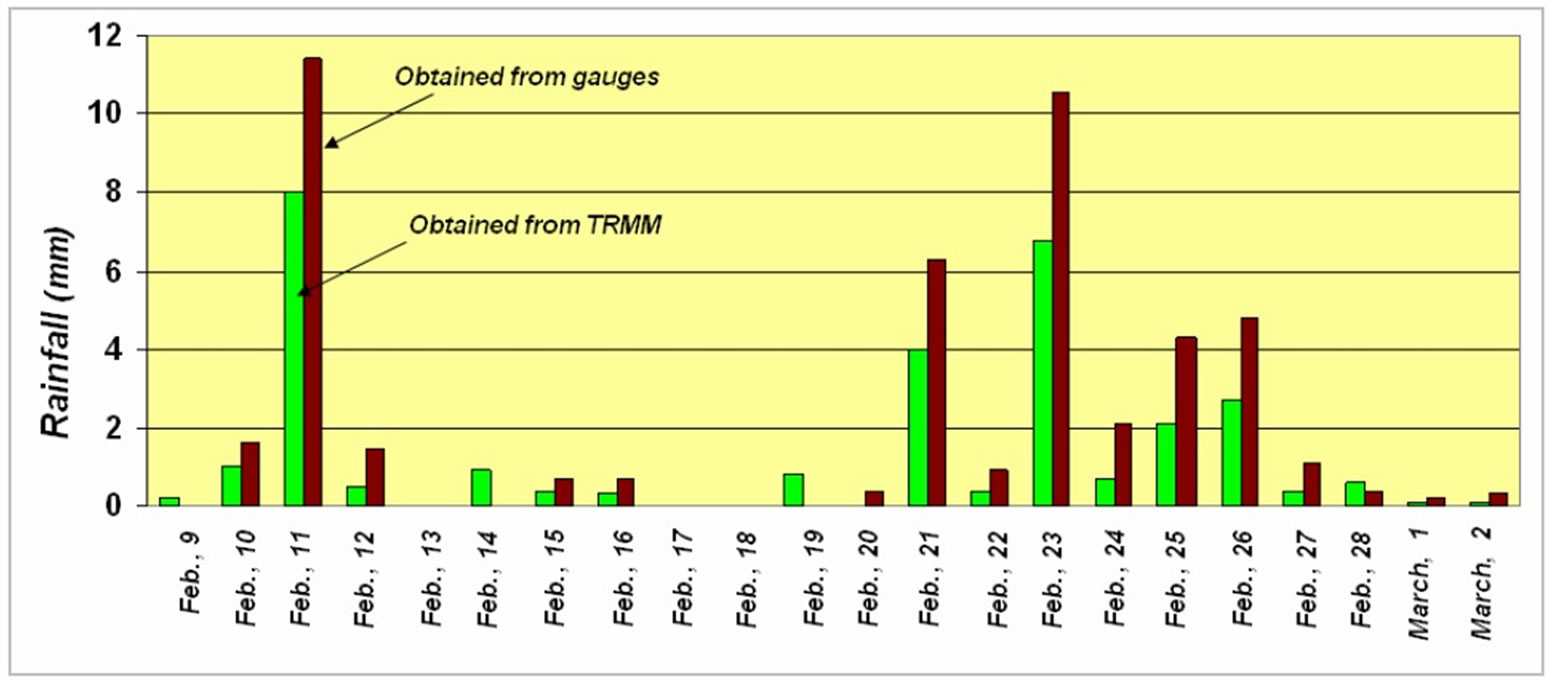
Figure 5. Example showing a comparison between ground rainfall data and TRMM-derived rainfall data for Abou Ali River. Both data follow the same rend (ascending & descending), but ground data (brown columns) show high values than TRMM Data (green columns).
depending on its flow regime. In this regard, interpolation approach was applied between plums area and rivers discharges. The resulting average ratio was found as 3:2. In other words, each one million m3 of discharge is represented by approximately 1.5 km2 of water plume on sea surface.
Figure 6 shows an example for this relationship, which was applied to Abou Ali River and for a selected period in the year 2002. The trend coincidence is obvious between the two measures, as well as the range in variance is often small and ranges between 0.1 and 0.4 as shown in the example (Figure 6). However, this variance is found to be larger in the rivers that located in the middle part of the region (from Ibrahim to El-Awali). This is attributed mainly to the higher altitudes of these river basins (>2500m), which results high precipitation rate and the dominant steep slopes.
3.3. Lag time (τ) and Residence Time (Tr)
As observed on TRMM data, after each rain event the time needed for a plume to appear on sea surface, i.e. lag time component (τ) could be estimated from MODIS image (example in Figure 7). The lag time (or flushing time as noted by Sheldon [19] is a function, in addition to rainfall intensity, of the catchment and river hydrologic characteristics. Nelson [20] stated that lag time depends on the amount of time over which the rain falls and the amount of infiltration and interception that takes place along the path to a stream. Thus, he concluded that:
- If the amount of rain is high over a short time period, lag time is short.
- If the amount of rain is high over a longer time period, lag time is longer.
- Lack of infiltration and interception reduce lag time.
In the study area, the lag time is characterized by big variance between different issuing rivers as a reflection of the diversity in the basin and river hydrologic characteristics. It ranges between 1 to 4 days, with an average of 2.5, which is short due to the small area of the located basins in coastal Lebanon (<500 km2).
Moreover, the located middle basins and their rivers show shorter lag time as a result of the steep slope (75-100 m/km). Of course, this was estimated to rainfall peaks occurred after a dry time. Whilst, if there are two close rainfall peaks, the lag time for the second one will be shorter and may reach few hours after the rain peak (example in Figure 7).
Accordingly, the residence time (Tr) is another hydrologic pillar that can be obtained from remote sensing. It represents the time that the plume remains in its maximum size on sea surface (example in Table1). However, some authors tackles this terminology for the average time the initially existing water parcels reside in the system before they are flushed out [21]. Residence time indicates the continuity of water flow, as well as the uniformity in drainage density within the catchment area [9].
For the Lebanese coastal rivers, the residence time of fresh water in the sea ranges between 1 to 4 days, and with an average of 2.4 days, as observed in the year 2002 (Table 2). The variation in mixing time is likely attributable to the influence of several factors, notably the physical contact between land and ocean [22]. In other words, the wideness of the continental shelf, depth of submarine canyons next to the river mouths and direction and energy of sea current, all influence the behavior of a plume. Accordingly, the Lebanese coastline is linear and measures approximately 225km long, with narrow continental shelf between 2 to 3 km, and a dominant current direction from south to north.

Figure 6. Comparison of plume area and water discharge for Abou Ali River. It shows the river’s discharge is about 2:1, that is, 2 km2 of water plume area.

Figure 7. Example showing the lag and the residence time of plumes and rainfall peaks for Abou Ali River.
4. Conclusion
Recently, remote sensing techniques have been utilized in many scientific disciplines. In hydrological studies, sometime data availability controls the approaches to be used. In a broad sense, the topic of this study requires two major measures. These are: rainfall records and behavior; and the discharge from rivers to the sea.
Remotely sensed data is can provide information for the two measures; therefore, MODIS-Terra and TRMM data, with their short retrieve time (daily) permit establishing a monitoring approach between both. This approach, if more improved, can replace ground instrumental techniques. In addition, it is characterized by low cost and can be achieved in a short time.
The coastal zone of Lebanon is typical area for such application, because it encompasses a number of issuing rivers and a variety of climatic conditions, meanwhile gauging stations and hydrographs are lacking/or insufficient. Rainfall in this zone is characterized by high frequency of peaks, and high rate. Therefore, surface flow regime (run-off) and infiltration of water into rocks must be understood.
In the study area, the steep sloping terrain (75-100 m/km) as well as the short the rivers length (almost < 50km) create high flow energy of water towards the sea, which is often less than 5 hours. This is reflected with low value of lag time (average τ=2.4 days). The high flow energy of running water from the coastal rivers is tempered by the existing fracture systems and karstic conduits, as well as the high meandering ratio of river courses. The huge loss of freshwater from rivers in the existing hydrologic regime, suggests proposing urgent implements for surface water harvesting in the region, and this can be implemented to all rivers tributaries in the coastal zone of Lebanon.
Based on the applied method in this study, which proved the reliability of remote sensing data and its powerful in the assessment of rivers hydrology, it is prudent to apply this method to all rivers in Lebanon separately and in details considering all influencing factors in rivers discharge. It can be modified to be as a monitoring system that could provide information to a strategic water management system in their pursuits.
5. Acknowledgement
Funding for this research was made possible through the Fulbright scholarship awarded to Dr. Amin Shaban (Lebanese National Council for Scientific Research). Remote sensing software used for some of this research is provided by PCI Geomatics. The authors would like to thank James Acker from NASA’s GSFC for his help related to the acquisition and use of MODIS ocean data.
REFERENCES
- R. El-Qareh, “The submarine springs of Chekka: Exploitation of a confined aquifer discharging in the sea,” Unpublished M. Sc. Thesis, American University of Beirut, Geology Department, pp. 80, 1967.
- FAO, “Projet de développement hydro-agricole du Sud du Liban: Thermométrie aéroportée par Infra-Rouge,” Programme des Nations Unies pour le Développement, HG, 110, pp. 15, 1973.
- S. Gomis, “Evaluating the potential of locating submarine springs in the Gulf of Oman using Landsat Thematic Mapper data,” Master’s thesis, Boston University, pp. 47, 1996.
- C. Travaglia, and O. Ammar, “Groundwater exploration by satellite remote sensing in the Syrain Arab Republic,” Technical Report, FAO. TCP/SYR/6611, pp. 33, 1998.
- K. Brink, R. Arnone, P. Coble, C. Flagg, B. Jones, J. kindle, C. Lee, D. Phinney, M. Wood, C. Yentsch and D. Young, “Monsoons boost biological productivity in Arabian Sea,” EOS. Vol. 79, NO. 13, pp. 233–253. 1998.
- W. Fielding and F. El-Baz, “Linear thermal anomaly offshore from Wadi Dayqah: A probable ground water seep along fracture zones,” International Conference on the Geology of Oman, 12-16 January 2001, Sultan Qaboos University, Muscat, Oman, Abstract 1, pp. 33, 2001.
- C. Robinson, A. Buynevich, F. El-Baz and A. Shaban, “Integrative remote sensing techniques to detect coastal fresh-water seeps,” Geological Society of America, Annual Meeting, Salt Lake City, Utah., pp. 16–19. October, 2005.
- A. Shaban, M. Khawlie, C. Abdallah, and G. Faour, “Geologic controls of submarine groundwater discharge: Application of remote sensing to north Lebanon,” Environmental Geology, Vol. 47, No. 4, pp. 512–522, 2005.
- A. Shaban, M. Khawlie, C. Abdallah and M. Awad, Hydrological and watershed characteristics of the El-Kabir River, North Lebanon, Lakes and Reservoirs: Research and Management, Vol. 10, No. 2, pp. 93–101, 2005.
- B. Hakim, “Contribution à la détection des sources sous-marines et littorales de la côte libanaise par thermogravimétrie infrarouge (secteur Beyrouth-Enfé),” DESS, Faculté des sciences, Montpellier, pp. 30, 1974.
- B. Hakim, “Recherches hydrologiques et hydrochimiques sur quelques karsts méditerranéens: Liban, Syrie et Maroc,” Publications de l’Université Libanaise, Section des études géographiques, tome II, pp. 701, 1985.
- NCRS, “TIR survey for freshwater sources in the marine environment,” National Center for Remote Sensing, Final Report, LNCSR. NCRS, pp. 103, 1999.
- M. Khawlie, A. Shaban, and C. Abdallah. “Evaluation of potentials of submarine springs: An unconventional groundwater source for the coastal area-Lebanon,” Expert Group Meeting on: Groundwater Rehabilitation for Water Resources Protection and Conservation. ESCWA, UNEP/ ROWA, BGR, MOWE, Beirut 14–17/11/2000.
- LRA-Litan River Authority, Unpublished Technical Report, pp. 29, 2001.
- A. Shaban and C. Robinson, “A systematic approach using MODIS and TRMM data to monitor rainfall peaks versus water flow from rivers,” CNRS. Regional Workshop on: Monitoring of coastal zones and legislation for the implementation of a national observatory on environment and development, pp. 24–25, May 2006.
- C. Scott, C. Thomas and L. Scott, “A comparison of TRMM to other basin-scale estimates of rainfall during the 1999 Hurricane Floyd flood,” Natural Hazards, Accepted online, 2007.
- Y. Ohsaki, A. Numata, T. Higashinwaatoko, Validation of rain/no-rain discrimination in the standard TRMM data products 1B21 and 1C21, IEEE 2, pp. 875–877, 2000.
- M. Nirala and A. Cracknell, “The determination of the three-dimensional distribution of rain from the Tropical Rainfall Measuring Mission (TRMM) Precipitation Radar,” International Journal of Remote Sensing, Vol. 23, No. 20, pp. 4263–4304, 2002.
- J. Sheldon and M. Alber, “A comparison of residence time calculations using simple compartment models of the Altamaha River Estuary,” Georgia, Estuaries. Vol. 2, No. 6, pp. 1304–1317, 2002.
- N. Nelson, River Flooding, Natural Disaster course, Tulane University, EENS 204, http://www.tulane.edu/~sane-lson/geol204/riverflooding.htm, 2004.
- W. Chi-Fang, H. Ming-His, K. Albert and K. Residence, “Time of the Danshuei River Estuary,” Taiwan, Coastal and Shelf Science, Vol. 60, No. 31, pp. 381-393, Chiu, L., Serafino, G. and Terg, W. (2001) Applications of Tropical Rainfall Measuring Mission (TRMM) data. IEEE 5, pp. 2118–2120, 204.
- W. Washington, “The community climate system model (CCSM) to simulate climate change on Earth,” The National Center for Atmospheric Research (NCAR), ISC 2003 Conference, Heidelberg, 25th June, 2003.