Journal of Software Engineering and Applications
Vol.11 No.02(2018), Article ID:82297,20 pages
10.4236/jsea.2018.112004
An Ensemble of Convolutional Neural Networks Using Wavelets for Image Classification
Travis Williams, Robert Li
Department of Electrical and Computer Engineering, North Carolina A&T State University, Greensboro, NC, USA
![]()
Copyright © 2018 by authors and Scientific Research Publishing Inc.
This work is licensed under the Creative Commons Attribution International License (CC BY 4.0).
http://creativecommons.org/licenses/by/4.0/


Received: December 24, 2017; Accepted: February 3, 2018; Published: February 6, 2018
ABSTRACT
Machine learning is an integral technology many people utilize in all areas of human life. It is pervasive in modern living worldwide, and has multiple usages. One application is image classification, embraced across many spheres of influence such as business, finance, medicine, etc. to enhance produces, causes, efficiency, etc. This need for more accurate, detail-oriented classification increases the need for modifications, adaptations, and innovations to Deep Learning Algorithms. This article used Convolutional Neural Networks (CNN) to classify scenes in the CIFAR-10 database, and detect emotions in the KDEF database. The proposed method converted the data to the wavelet domain to attain greater accuracy and comparable efficiency to the spatial domain processing. By dividing image data into subbands, important feature learning occurred over differing low to high frequencies. The combination of the learned low and high frequency features, and processing the fused feature mapping resulted in an advance in the detection accuracy. Comparing the proposed methods to spatial domain CNN and Stacked Denoising Autoencoder (SDA), experimental findings revealed a substantial increase in accuracy.
Keywords:
CNN, SDA, Neural Network, Deep Learning, Wavelet, Classification, Fusion, Machine Learning, Object Recognition

1. Introduction
Machine learning has become an integral part of everyday life for many people around the world. The discovery and implementation of algorithms allowing computers to learn and predict patterns opens up possibilities of computers interfacing and assisting humans globally [1] . The pervasiveness of this technology in modern living allows the solving of old problems in new, more efficient ways. A few applications of machine learning include fraud detection, image classification, information retrieval, medical diagnosis, etc.
One powerful utilization of machine learning is image classification. Image classification categorizes the pixels in an image into one of numerous classes, based on portrayals of the features of the image it gathers during extraction. Many spheres of influence such as business, finance, medicine, research, technology, etc. use image classification to enhance their products, causes, efficiency, etc. [2] . As more startup companies, established corporations, and universities invest in machine learning, the research and development of algorithms with greater accuracy, efficiency, and speed will occur. One of these types of algorithms is deep learning, which is a subset of machine learning.
Deep learning, using multiple layers of nonlinear information processing, trains computers to differentiate patterns in data. Each layer builds upon the next layer, and they represent new learned features of the data. At each depth, higher-level abstract features derive from the previous depth level. These revelations moreover allow for greater discerning between multiple classes the deeper it goes in the network. Concluding with the organization and classification of massive, messy, disorderly data in accelerated, more expedient times than the shallower, superficial forms of machine learning [3] [4] . We highlight Convolutional Neural Networks (CNN), a deep neural network whose structural form and weights distribution varies from other deep neural networks. CNN is ideal for two-dimensional data, such as images, videos, etc. We compare and contrast CNN to Stacked Denoising Autoencoders (SDA), which have a fully connected structure like most traditional neural networks [5] .
Normally, CNN, SDA, etc. perform image classification on the raw image pixels. In this case, in an effort to increase the image classification accuracy, we propose an algorithm that converts the data to the wavelet domain. The first-order subbands become inputs into their own CNNs, and they produce individual classification results. We combine each subband’s classification results with the OR operator, surpassing the classification accuracy of CNN on the spatial image data. We also implement our proposed algorithm on SDA and compare it with its spatial counterpart [6] . To further highlight our proposed method, we compare our OR fusion technique with Extreme Learning Machine (ELM) and multilayer perceptron (MLP). We perform all simulations in MATLAB R2016b. We use the natural scenes from the Canadian Institute for Advanced Research (CIFAR-10) [7] and human facial expressions of emotion from the Karolinska Directed Emotional Faces (KDEF) [8] classified by each deep learning approach.
We organize the rest of this article as follows: Section 2 gives the background; Section 3 describes the proposed methods; Section 4 discusses the experimental results; and Section 5 gives the summary and conclusion.
2. Background
2.1. Wavelets
Wavelets represent functions as simpler, fixed building blocks at different scales and positions. The Discrete Wavelet Transform (DWT) derives from and simplifies the continuous wavelet transform, representing a sequence of sampled numbers from a continuous function [9] [10] [11] . Applying the DWT to digital images, especially at multiple resolutions, produces a wide range of usages for preprocessing and improvement. This viable mathematical tool has an efficient, highly intuitive framework for characterization and storage of multiresolution images. It also provides powerful insight and into an image’s temporal and frequency characteristics.
Let an image f(x,y) have dimensions M × N. We define the two dimensional DWT transform pair as
(1)
(2)
We define the Inverse Discrete Wavelet Transform (IDWT) as
(3)
where are the approximation coefficients, are the detail coefficients, m & n are the subband dimensions, j is the resolution level, and i is the subband set {H,V,D}.
The Fast Wavelet Transform (FWT) can be expressed below:
(4)
(5)
where k is the parameter about the position. Equations (4) and (5) reveal the connection and usefulness between DWT coefficients of adjacent scales. This algorithm is “fast” because it efficiently computes the next level of approximation and detail coefficients interactively by convolving Wϕ(j + 1, n) with the time reversed scaling and wavelet vectors hϕ(−n) and h𝜓(−n), and sub-sampling the outcomes.
The two-dimensional FWT, like the one-dimensional FWT, filters the approximation coefficients at resolution level j + 1 to obtain approximation and details at the jth resolution level. Furthermore, for the two-dimensional case, the detail coefficient expands from one to three coefficients (horizontal, vertical, and diagonal) [12] [13] [14] [15] .
Figure 1 shows an example of a multiresolution wavelet decomposition at level 4. The subbands Low-High (LHj), High-Low (HLj), and High-High (HHj),

Figure 1. Level 4 wavelet decomposition example.
are detail coefficients, noted above, where j is the scale and J denotes the largest or coarsest scale in the decomposition [16] . The Low-Low (LLj) subband contains approximation coefficients.
The independent nature of the subbands allow image processing applications to perform optimally for each environment, if needful. After subband processing occurs, the IDWT reconstructs the image.
2.2. Stacked Denoising Autoencoders
A stacked denoising autoencoder (SDA) is a deep neural network containing multiple denoising autoencoders (DAs) whose outputs connect to the inputs of the next DA [17] . We add 20% of Bernoulli noise (dropout) to the input layer, and dropout 50% of all hidden layers [18] . We do not apply dropout during the fine-tuning stage.
Suppose an SDA has m layers. Designate l as the current layer. Let W(k,1), W(k,2), b(k,1), b(k,2) represent the weights and biases for the kth autoencoder. The SDA encodes by applying the following for each layer in a feedforward fashion [19] :
(6)
(7)
SDAs take in data, and by stacking multiple DAs in succession, they train and learn deeper features at each progressive layer. This process utilizes greedy-wise training for efficiency [19] . Figure 2 shows an example SDA architecture.
2.3. Convolutional Neural Networks
2.3.1. Convolutional Layer
Convolutional Neural Networks (CNN) follow the path of its predecessor Neocognitron in its shape, structure, and learning philosophy [20] . Traditionally, neural networks convert input data into a one-dimensional vector. A CNN structure morphs to the structure it captures, making it state-of-the-art for
![]()
Figure 2. Stacked denoising autoencoder.
classifying images, video, etc. [21] [22] . CNNs employ the same tactics for regularization and greater accuracy as traditional neural networks, i.e. backpropagation, dropout, gradient descent, non-linear activation functions, etc.
Additionally, the structural differences between them change how CNN learns and shares weights, and its dimensionality reduction at every layer.
Traditional neural networks have fully connected layers, where every node connects to each node in the subsequent layer. With CNNs, a region of nodes in the previous layer connect to one node in the subsequent layer. This region, better known as a local receptive field, operates like a sliding window function over the whole layer. Within the field, the connections each learn a weight value, and an overall bias value for the node in the subsequent hidden layer. Local receptive fields often take on a square shape of a predetermined size (i.e. 3 × 3, 5 × 5, etc.) [22] .
These fields and biases remain the same for each node in the hidden layer. Unlike traditional neural networks, CNNs employ weight and bias sharing throughout the entire input layer to hidden layer [22] . The local receptive field slides across the input layer like a window filter to calculate the activations for the subsequent layer. The “convolution” in the naming of CNN comes from these calculations, which are convolutions, and researchers refer to this layer as the convolutional layer. These processes happen to every feature map in this layer. Equation (8) shows a mathematical representation of this weight sharing filter:
(8)
where Wl,m represents the shared weights, b represents the bias, aj+l,k+m is the input activation at a certain position, and n is the window size of the convolution filter. Figure 3 gives an example illustration of a local receptive field and shared weights [22] .
2.3.2. Pooling Layer
CNNs adhere to a basic structure that takes after its forefather, Neocognitron, where the layers alternate between a convolutional layer and a pooling layer [20] [21] . This pattern ensues until the data dimensions become small enough to combine the feature maps into fully connected layers. These layer(s) connect to a softmax classifier, which predicts which class the image represents.
The pooling layer performs dimensionality reduction. This layer aids in keeping the computational costs lower than it would if learning occurs. The subsampling happens by condensing a neighborhood into one node value, and this process continues until it affects all nodes. Researchers primarily use max pooling and average pooling in this layer [23] . However, alternative forms of pooling exist, i.e. mixed [24] , stochastic [23] , etc. that enhance the strengths and improve upon the weaknesses of average and max pooling.
Average pooling calculates the average value of a region and uses it for the compressed feature map. Max pooling determines the maximum value of a region and uses it for the compressed feature map. Figure 4 gives an example of both methods [5] . Equations (9) and (10) express the average and max pooling calculations as
(9)
(10)
![]()
Figure 3. 5 × 5 local receptive field + shared weights.
In various arrangements, a complete CNN connects alternating convolutional layers to pooling layers. However, other auxiliary types of layers and processes exist to create more activations with robustness, regularize networks, etc. to achieve optimal performance. A sample of these layers of processing include dropout [18] , rectified linear units (RELU) [25] , batch normalization [26] , etc. Figure 5 shows an example CNN architecture.
3. Proposed Methods
Traditionally, for image classification researchers execute CNN on the raw image pixels. This process yields accurate results, but oftentimes the efficiency of the algorithm decreases. This decrease in efficiency comes from the complexity and dimensions of the images in the spatial domain. We seek to remedy this issue by converting the data into the wavelet domain. This conversion allows us to process the images at lower dimensions and achieve faster execution times.
By exploiting the characteristics of the wavelet domain, we apply multiple CNNs onto the various frequency and time representations. This ensemble of CNNs on various subbands increases the classification accuracy of the data sets.
![]()
Figure 4. Example of max & mean pooling with stride of 2.
![]()
Figure 5. Example CNN architecture.
We outline the main steps below:
1) Convert images from spatial to the wavelet domain;
2) Apply Z-score normalization on subbands [27] [28] ;
3) Normalize detail subbands [0, 1];
4) Perform CNN on subbands;
5) Combine subband results with the OR operator for final classification [29] .
We present our applications of this algorithm in two contrasting ways. The first approach (hereafter CNN-WAV2) combines the detail coefficients (LH, HL, HH) prior to processing the images as shown by this equation [27] :
(11)
where α, β, and γ are the weight parameters for each subband, whose values we calculate below [29] :
(12)
(13)
(14)
where TA is the test accuracy for each subband after CNN testing, defined in the Results. We show CNN-WAV2 in Figure 6 [5] . The other approach (hereafter CNN-WAV4) uses all of the first-level decomposition subbands, and we implement it according to the diagram in Figure 7 [5] . We discuss the trade-offs, efficiency vs. accuracy, in the Results section.
4. Results and Discussion
We use MatConvNet [30] for all CNN experiments. We modify MATLAB’s autoencoder example from the Neural Network Toolbox in MATLAB for all SDA experiments. For training, we use stochastic gradient descent [31] . We run all experiments on a 64-bit operating system, with an Intel® Core™ i7-6800k CPU @ 3.40 GHz processor, with 64.0 GB of RAM. We utilize two GeForce Titan X Pascal GPUs with 12 GB of video memory.
We use the Haar wavelet basis when implementing our proposed methods in CNN and SDA. We compare multiple bases (Table A1 and Table A2 in Appendix) to gather understanding of the effects of varying bases on the proposed. Equation (15) calculates test accuracy (TA) in this manner [27] :
(15)
To test the strength of our OR gate technique, we compare it to two differing neural network techniques. The first technique connects the outputs of the individual subband CNNs to a multilayer perceptron (MLP), which merges the features of each CNN-WAV into one network. The other approach fuses the

Figure 6. CNN-WAV2 method.

Figure 7. CNN-WAV4 method.
features using Extreme Learning Machine (ELM) [30] . These inputs come from the outputs of the penultimate layer of the network. We set up the CNN-MLP by dropping out 20% of the inputs, and 30% of the hidden layers. We apply batch normalization and ReLU functions after layers 1-3 accordingly: batch → drop → ReLU. Figure 8 conveys an example of our CNN-MLP structure, while Figure 9 gives a model of our CNN-ELM structure.
4.1. CIFAR-10
We base our CNN architecture on Zeiler’s stochastic pooling work [23] . We maintain the parameter values established in that work. We use stochastic gradient descent for all training [31] . Figure 10 shows the basic CNN structure we implement for the CIFAR-10 dataset [5] . For the SDA comparison, our traditional SDA has a structure of 2072-1024-512-10, while SDA-WAV2 and SDA-WAV4 use a structure of 1024-400-100-10. We maintain the parameter values set in the Neural Network Toolbox example.
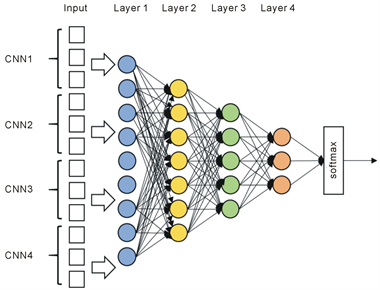
Figure 8. CNN-MLP method.

Figure 9. CNN-ELM example.

Figure 10. CIFAR-10 CNN structure block diagram.
The CIFAR-10 dataset contains natural scenes from ten classifications of images. It is a subset of the larger CIFAR-100 dataset. For this dataset, we use the full training set containing 50,000 images, and the full testing set containing 10,000 images. During training, the test set also serves as the validation set. Figure 11 gives a sample of the training and testing data [5] .
Our CNN-WAV4 method generates the greatest image classification accuracy out of all other approaches. The four individual subbands give this method a robust structure that corrects the errors in one or more subband results. Furthermore, each of the subbands in the ensemble detect a medium-to-high number of scenes on their own, and pick up unique detections that the other subbands miss.
Our CNN-WAV2 method underperforms in terms of accuracy. It detects a classification accuracy less than the traditional CNN method. However, it has the least expensive computational cost. This speedup results from the fusion of the detail coefficients into a new subband. This creates a two-subband ensemble that has a higher processing speed but loses accuracy due to the loss of information from the fusion.
The LL subband contributes the most towards the classification score of the whole network. The reason stems from the fact that this subband has the most similarity to the original image. Table 1 details the performance and efficiency of each network. Every CNN method outperforms every SDA method. Table 1 shows the vast difference in the ability of each to train two-dimensional data. Our CNN-WAV2 method, the weakest CNN method, still outperforms SDA-WAV4, the strongest SDA method. All CNN methods prove the robustness of the local receptive field, as well as its conformity to the shape of its inputs. The SDA methods show that the vector approach of traditional neural networks has flaws, mainly in that it diminishes the relevance of local image data, and color schemes [22] .
Our proposed ensemble methods bring the different results together from each subband network using an OR gate. We purposely construct it this way to

Figure 11. CIFAR-10 training and testing data samples.
maximize the unique detections of each subband network. Due to the variation of representation of each subband, each one will achieve varying results in detection of scenes. By combining the results of the networks after individual classification rather than prior to classification, our approach achieves a greater accuracy than others do.
We compare our method to two approaches, which combine the subbands in training. This approach diminishes the accuracy, and effectiveness of the unique detections. Table 2 shows how the two methods, CNN-MLP and CNN-ELM, perform poorly in comparison to our proposed methods and traditional CNN. We attribute this performance drop to the stronger subband data merging with the weaker subband data. This merging dilutes the strength of the overall predictions because the more stable subbands take on the errors of the unstable subbands.
We further explore the effectiveness of our proposed methods and their advantage regarding unique detections per subband network. The nature of our ensemble allows each subband network to act as an error corrector for the others. Since each network performs its own classifications prior to the OR logic, we know whether a subband’s decision passes or not. Conversely, we also know which one(s) predict the correct scenes. Therefore, we permit the network(s) who predicts the ground truth correctly to trump the incorrect decisions of the

Table 1. CIFAR-10 detection & efficiency of CNN and SDA methods.
Table 2. CIFAR-10 performance of CNN fusion methods.
others. This fact allows an ensemble to have all but one of the subband networks incorrect and still report a correct detection. It emphasizes the importance of multiple subband representations being a part of the network. It also explains why the CNN-WAV4 method outperforms the CNN-WAV2 method. Figure 12 and Figure 13 display the unique subband detections for CNN-WAV2 and CNN-WAV4.
The unique detections for each subband network show the strength of each subband. Not surprisingly, for both methods, the LL subband has the most unique detections. This subband has the most resemblance to the spatial images, and therefore has the most information to extract for features. The rest of the results trend downward, as the number of detections decrease for every subband.

Figure 12. Unique scenes detected per subband (CNN-WAV2).

Figure 13. Unique scenes detected per subband (CNN-WAV4).
The HH subband for both methods records the least number of unique detections, as it contains mainly edge details, and very little information concerning texture, details, etc. As a whole, the CNN-WAV2 method detects 2991 unique scenes, and the CNN-WAV4 method detects 1723 unique scenes.
4.2. KDEF
Like the CIFAR-10 dataset, our network architecture for KDEF draws from Zeiler’s stochastic pooling work [23] . We maintain all of the other parameters the same. We use stochastic gradient descent for all training [31] . Figure 14 shows the basic CNN structure. We construct SDA with a structure of 49,152-1,000-400-100-7, while SDA-WAV2 and SDA-WAV4 have a structure of 12,288-400-100-7. We also maintain the same parameters.
KDEF contains 4900 images of 35 people modeling seven basic emotions (afraid, angry, disgusted, happy, neutral, sad, and surprised) with their facial expressions. The models pose in five different directions (full left/right, half left/right, straight) for each emotion. Since KDEF does not specify a training or testing set, we randomly sort the images and select 3,900 as training data, and 1,000 as test data. Due to memory and time constraints, we resize the data to 128 by 128. Figure 15 gives a sample of the training and testing data.
The KDEF results follow a similar trend as the CIFAR-10 results concerning the proposed methods. According to Table 3, the CNN-WAV4 method outperforms all methods in both CNN and SDA formats. The multiple subband networks allow for the detection of more scenes and error correcting by one or more subbands. The CNN-WAV2 method responds to the KDEF dataset much better than the CIFAR-10, as it outperforms traditional CNN, as well as the alternative SDA proposed and traditional methods.
Table 3 also shows that the dual subband networks of CNN-WAV2 allow it to train with the lowest computational cost out of all of the other methods. CNN-WAV4 has almost double the computational cost due to the number of subband networks being greater. Furthermore, due to the fully connected nature of SDA, all of the SDA methods have computational costs higher than the CNN methods.

Figure 14. CNN KDEF structure block diagram.

Figure 15. KDEF training and testing data samples.
Table 3. CIFAR-10 detection & efficiency of CNN and SDA methods.
Like the CIFAR-10 results, when we compare our OR fusion method to other methods like MLP and ELM, ours prevails in classification accuracy. Our proposed method maximizes the strength of each subband network within the ensemble by summing up the unique detections towards the total classification accuracy. The other fusion methods combine the weaker outputs with the stronger outputs as they both become inputs into MLP and ELM. This combination dilutes the strength of the stronger activations, and thus leads to a less accurate classification. Table 4 emphasizes the distinction between our proposed methods’ strengths and the other methods’ weaknesses.
The unique detections contribute to the higher accuracies of the proposed methods versus their traditional counterparts. From analyzing the CNN proposed methods, we can discern the importance of multiple subband networks and their influence. The CNN-WAV4 ensemble network has the ability to error correct more effectively than the CNN-WAV2 ensemble network, leading to why it performs better. These unique detections serve to show the power in the diversity of each subband representation. Figure 16 and Figure 17 give the

Figure 16. Unique scenes detected per subband (CNN-WAV2).

Figure 17. Unique scenes detected per subband (CNN-WAV4).
Table 4. KDEF performance of CNN fusion methods.
unique detections for CNN-WAV2 and CNN-WAV4. Like the CIFAR-10 results, the unique detections trend downward, with the LL bands having the greatest number of unique detections, due to its similarity to the original spatial image.
5. Conclusions
The experiments and results solidify our initial claims that a wavelet-based ensemble network would perform at a greater accuracy and comparable to greater computational cost than traditional deep neural network methods. Even with the emphasis on our methods with CNN, the proposed methods, when we apply them to SDA, also follow the aforementioned trends.
We conclude that CNN-WAV2 has a smaller computational cost than the other methods, but sacrifices accuracy. This dilution in accuracy comes from the detail subbands combining prior to any learning. This causes much of the information and uniqueness of each detail subband to be lost.
We also conclude CNN-WAV4 has the greatest robustness, with its ability to correct the errors of other subbands, resulting in the greatest accuracy across all methods. However, due to all of the subbands contributing to the network, the computational cost is higher than the CNN-WAV2 method.
Even with the trade-off in accuracy vs. efficiency, the CNN-WAV4 method proves itself as superior to the traditional CNN and SDA methods. It performs better in both categories, and its higher accuracy and comparable efficiency prove its superiority over our CNN-WAV2 method.
Our proposed methods have limitations in its present structure. Firstly, our CNN network applications to each subband are not variable. Secondly, we perform each network sequentially, instead of in parallel. Thirdly, we recognize that there are operations that can be employed to further reduce the computational complexity of the methods in all phases of calculation (preprocessing, training, post-processing, etc.). Lastly, we utilize only one type of wavelet basis (Haar), when others possibly perform better.
This area and topic, particularly concerning the hybridization of wavelets and deep learning networks has much more growth and contributions by researchers. Using parallel computing with the aid of multiple GPUs can increase the computational efficiency of both proposed methods, especially the CNN-WAV4 method. Creating subband-specific networks also can improve the individual classification accuracies. Expanding the algorithm to multiple decomposition levels also can further prove to increase classification accuracy. Working with datasets with larger images also can strengthen the points of this article, especially concerning computational costs.
Acknowledgements
This research is supported by the Title III HBGI PhD Fellowship grant from the U.S. Department of Education.
Cite this paper
Williams, T. and Li, R. (2018) An Ensemble of Convolutional Neural Networks Using Wavelets for Image Classification. Journal of Software Engineering and Applications, 11, 69-88. https://doi.org/10.4236/jsea.2018.112004
References
- 1. Goodfellow, I., Bengio, Y. and Courville, A. (2016) Deep Learning. MIT Press, Cambridge.
- 2. Wernick, M.N., Yang, Y., Brankov, J.G., Yourganov, G. and Strother, S.C. (2010) Machine Learning in Medical Imaging. IEEE Signal Processing Magazine, 27, 25-38. https://doi.org/10.1109/MSP.2010.936730
- 3. Arel, I., Rose, D.C. and Karnowski, T.P. (2010) Deep Machine Learning—A New Frontier in Artificial Intelligence Research. Computational Intelligence Magazine, 5, 13-18. https://doi.org/10.1109/MCI.2010.938364
- 4. Deng, L. and Yu, D. (2014) Deep Learning: Methods and Applications. Foundations and Trends in Signal Processing, 7, 197-387.
- 5. Williams, T. and Li, R. (2016) Advanced Imaged Classification using Wavelets and Convolutional Neural Networks. 15th IEEE ICMLA, Anaheim, 18-20 December 2016, 233-239.
- 6. Williams, T. and Li, R. (2016) SDA-Based Neural Network Approach to Digit Classification. IEEE Southeast Conference Proceedings, Norfolk, 30 March-3 April 2016, 1-6. https://doi.org/10.1109/SECON.2016.7506768
- 7. Krizhevsky, A. (2009) Learning Multiple Layers of Features from Tiny Images. Technical Report TR-2009, University of Toronto, Toronto.
- 8. Lundqvist, D., Flykt, A. and Öhman, A. (1998) The Karolinska Directed Emotional Faces—KDEF. Department of Clinical Neuroscience, Psychology Section, Karolinska Institutet.
- 9. Chui, C.K. (1992) An Introduction to Wavelets. Academic Press, New York.
- 10. Strang, G. and Strela, V. (1995) Short Wavelets and Matrix Dilation Equations. IEEE Transactions on Signal Processing, 43, 108-115. https://doi.org/10.1109/78.365291
- 11. Rieder, P., Gotze, J. and Nossek, J.A. () Multiwavelet Transforms Based on Several Scaling Functions. Proceedings of the IEEE-SP International Symposium on Time-Frequency and Time-Scale Analysis, Philadelphia, 25-28 October 1994, 393-396. https://doi.org/10.1109/TFSA.1994.467330
- 12. Mallat, S.G. (1989) A Theory for Multiresolution Signal Decomposition: The Wavelet Representation. IEEE Transactions on Pattern Analysis and Machine Intelligence, 11, 674-693. https://doi.org/10.1109/34.192463
- 13. Nason, G.P. and Silverman, B.W. (1995) The Stationary Wavelet Transform and Some Statistical Applications. In: Antoniadis, A. and Oppenheim, G., Eds., Wavelets and Statistics, Lecture Notes in Statistics, Volume 103, 281-300.
- 14. Strang, G. and Nguyen, T. (1996) Wavelets and Filter Banks. Wellesley-Cambridge Press, Wellesley.
- 15. Burrus, C.S., Gonipath, R.A. and Guo, H. (1998) Introduction to Wavelets and Wavelet Transforms: A Primer. Prentice Hall, Englewood Cliffs.
- 16. Sihag, R., Sharma, R. and Setia, V. (2011) Wavelet Thresholding for Image De-Noising. International Conference on VLSI, Communication and Instrumentation, Kottayam, April 2011, 21-24.
- 17. Vincent, P., Larochelle, H., Lajoie, I., Bengio, Y. and Manzagol, P.-A. (2010) Stacked Denoising Autoencoders: Learning Useful Representations in a Deep Network with a Local Denoising Criterion. Journal of Machine Learning Research, 11, 3371-3408.
- 18. Srivastava, N. (2013) Improving Neural Networks with Dropout. Master’s Thesis, Univ. of Toronto, Toronto.
- 19. Ng, A. (2015) Stacked Autoencoders. http://ufldl.stanford.edu/wiki/index.php/Stacked_Autoencoders
- 20. Fukushima, K. (1980) Neocognitron: Neural Network Model for a Mechanism of Pattern Recognition Unaffected by Shift in Position. Biological Cybernetics, 36, 193-202.
- 21. Lecun, Y., Bottou, L., Bengio, Y. and Haffner, P. (1998) Gradient-Based Learning Applied to Document Recognition. Proceedings of the IEEE, 86, 2278-2324. https://doi.org/10.1109/5.726791
- 22. Nielsen, M. (2015) Neural Networks and Deep Learning. Determination Press.
- 23. Zeiler, M. and Fergus, R. (2013) Stochastic Pooling for Regularization of Deep Convolutional Neural Networks. Proceedings of International Conference on Learning Representations, Scottsdale, 2-4 May 2013, 1-9.
- 24. Yu, D., Wang, H., Chen, P. and Wei, Z. (2014) Mixed Pooling for Convolutional Neural Networks. In: Rough Sets and Knowledge Technology, 8818 of Lecture Notes in Computer Science, Springer International Publishing, Berlin, 364-375.
- 25. Zeiler, M., Ranzato, M., Monga, R., Mao, M., Yang, K., Le, Q., Nguyen, P., Senior, A., Vanhoucke, V., Dean, J. and Hinton, G. (2013) On Rectified Linear Units for Speech Processing. ICASSP, Vancouver, 26-31 May 2013, 3517-3521. https://doi.org/10.1109/ICASSP.2013.6638312
- 26. Ioffe, S. and Szegedy, C. (2015) Batch Normalization: Accelerating Deep Network Training by Reducing Internal Covariate Shift. Proceedings of the 32nd International Conference on Machine Learning, Lille, 6-11 July 2015, 448-456.
- 27. Tang, J., Deng, C., Huang, G.-B. and Zhao, B. (2015) Compressed-Domain Ship Detection on Spaceborne Optical Image using Deep Neural Network and Extreme Learning Machine. IEEE Transactions on Geoscience and Remote Sensing, 53, 1174-1185. https://doi.org/10.1109/TGRS.2014.2335751
- 28. Shalabi, L.A., Shaaban, Z. and Kasabeh, B. (2006) Data Mining: A Preprocessing Engine. Journal of Computer Science, 2, 735-739. https://doi.org/10.3844/jcssp.2006.735.739
- 29. Doukim, C., Dargham, J., Chekima, A. and Omatu, S. (2010) Combining Neural Networks for Skin Detection. Signal and Image Processing: An International Journal, 1, 1-11. https://doi.org/10.5121/sipij.2010.1201
- 30. Vedaldi, A. and Lenc, K. (2015) MatConvNet—Convolutional Neural Networks for MATLAB.
- 31. Bottou, L. (2010) Large-Scale Machine Learning with Stochastic Gradient Descent. International Conference on Computational Statistics, Paris, 22-27 August 2010, 177-187. https://doi.org/10.1007/978-3-7908-2604-3_16
Appendix
Table A1. CIFAR-10 wavelet basis comparison.
Table A2. KDEF wavelet basis comparison.