Journal of Software Engineering and Applications
Vol. 5 No. 12 (2012) , Article ID: 26195 , 12 pages DOI:10.4236/jsea.2012.512112
Multiperspective Representation of Internal Controls in Business Processes
![]()
Department of Software Engineering and Information Technologies, Ecole de Technologie Supérieure, Montreal, Canada.
Email: iheb.abdellatif.1@ens.etsmtl.ca, Alain.april@etsmtl.ca
Received October 1st, 2012; revised November 3rd, 2012; accepted November 12th, 2012
Keywords: Business Process Management (BPM); Internal Control; Multiperspective Control Representation; Internal Control Perspectives
ABSTRACT
The internal control process, which is designed to help an organization accomplish specific control objectives, is one of the most important processes, as it can determine whether or not the organization is in compliance with its internal or external requirements. Internal controls emerge from different perspectives. Currently, experts view and act on one control perspective at a time, which creates inefficiencies and duplication. This software engineering research is aimed at proposing a multiperspective framework for representing internal controls, in order to obtain a centralized and comprehensive view of all internal control mechanisms. To carry out this research, we also needed to represent the many different stakeholder perspectives of internal controls. Based on a literature review of mathematical and psychological analysis, we searched for the most suitable multiperspective representation of internal controls, and assessed the many representation options using the AHP (analytical hierarchical process) sensitivity analysis approach. This approach has been applied to a study group which has been called to answer to a questionnaire.
1. Introduction
The global economic environment continues to evolve and generate obligations and constraints for organizations, especially those that are publicly listed. At the organizational level, internal control objectives are related to the reliability of financial reporting, timely feedback on the achievement of operational and strategic goals, and compliance with laws and regulations. The establishment ofinternal controls is a process involving the stakeholders in the organization, each with their own particular perspective (i.e. general manager, accountant, information technology expert, internal auditor, security manager, etc.). That perspective determines the way in which the stakeholder will influence the selection of the internal controls for the organization’s business processes. In a typical organization, we can distinguish a number of perspectives, the most recognized of which are:
• management,
• security,
• IT auditing,
• compliance,
• quality assurance.
For each of these perspectives, internal control experts have proposed numerous national and international standards,as well as operating practice manuals, also known as best practice frameworks (for example, ISO 27000 for IT security, COSO for organizational governance, COBIT for IT governance, and SOX for accounting compliance) to help with their implementation. One of the many challenges in adopting internal controls in documented organizational processes is to meet the requirements of these many different perspectives in a structured way.
Despite awareness of the importance of internal controls and recent research proposals in the field of multiperspective business process analysis [1], there is currently no methodology that helps with the implementation of internal controls that consider more than one perspective in a business process representation. Today, internal control representation is often too specific and only oriented toward one perspective (e.g. IT, finance, or auditing). This often results in internal controls being duplicated within an organization, which gives rise to many different, often unrelated or conflicting, process representations and separately maintained business.
This may be exacerbated in large organizations that suffer from a lack of communication between departments or branches, or both.
This research proposes to develop a multiperspective framework (see research question 3 in Figure 1) for representing business process controls to be used by a corporate business process repository.

Figure 1. The four research questions addressed here.
This paper is organized as follows: We first present a summary of the various internal control representation approaches published in the literature, followed by a list of the framework alternatives and our choice of the proposal that best suits our requirements. We next describe a possible implementation of this representation with an initial prototype. Finally, and then we present the research activities we have planned, as well as future prospects to improve this initial proposal.
2. Internal Controls and Existing Approaches
Several approaches are presented in the literature to address the issue of representing internal controls in a business process [2-15]. These approaches currently consider only one stakeholder. Before summarizing these approaches, we introduce the concept of internal control and its related concepts.
2.1. Definition of Internal Control
In general, a control can be defined as a set of activities to ensure that a process is predictable, stable, and operating in a consistent manner, and is more or less acceptable to the stakeholders [16]. This definition presents a general notion of control which draws heavily on the production and engineering domains, where processes are, in most cases, measurable (with physical indicators such as temperature, pressure, load, etc.). Typically, these controls operate in real time [17].
In the business domain, internal controls are based on the same concept and are as important as they are in the production and engineering domains, except that they do not often measure in real time. This is mainly because, in the production and engineering domains, processes are of short duration and more strictly controlled in terms of time than processes in the business field. For example, in an assembly line (a manufacturing process in which parts are added to a product in a sequential manner to create a finished product), the controls must respond quickly and report any malfunction to the supervisor in real time. Otherwise, the organization can suffer huge losses. In contrast, the objective of an internal control in the business domain is to ensure that the business processes [15]:
• Align with the objectives and strategic visions of the organization
• Comply with internal policies, legislation, or other external constraints
• Are efficient and effective (ensuring a certain level of quality), and
• Are run in a secure manner, protecting corporate assets.
In the literature, internal controls are classified into three categories [3], depending on the business process level (strategic, organizational, or operational):
• Strategic controls ensure the application of the organization’s policies.
• Organizational controls operate within the framework of the strategic controls put in place; however, they are specific to a particular entity (project, product, function, responsibility center, etc.).
• Operational controls are derived from organizational controls, and ensure that the organization operates continuously (on a daily basis).
Strategic, organizational, and operational controls focus on two questions: 1) Is the strategy being implemented as planned? and 2) Are the results produced by the strategy those that were intended? [3].
Several control methodologies (COSO, COBIT, CMMI, etc.) apply the concept of internal control, especially after the financial scandals and frauds that occurred during 2000 (Enron, etc.) and the introduction of the SarbanesOxley law (SOX) [18]. These methodologies are all based on the realization that there is need for internal controls within an organization, as well as on the structure of these controls. In fact, these methodologies suggest that an internal control must specify:
• The objective to be achieved by implementing the internal control in question. This allows the link to be made between the internal controls and the organization’s business goals.
• The risk, in cases where the internal control is not established or respected. This makes it possible to gauge the importance of the internal control to be put in place and to justify its implementation cost.
• All the practices to follow to establish the internal control.
• If the internal control is specific to a given process, or generic for a set of processes.
• Who is responsible for ensuring that the internal control performs optimally?
• The business level at which the internal control is applied (strategic, organizational, or operational).
Control methodologies guide organizations in the process of establishing internal controls. However, they do not describe, technically, how to establish or adapt the internal controls to specific situations. They often provide guidelines that can be used as general directions for the process of implementing specific internal controls. It is up to each organization to select the internal controls that are appropriate for their needs, and to put them in place in their processes.
2.2. Existing Internal Control Approaches
In this section, we present the internal control perspectives that exist in the literature, and show how these perspectives are consolidated in the organization. We also show how the control’s objectives can differ from one perspective to another, and the characteristics that are common to the internal control approaches that exist in the literature.
As explained earlier, choosing a specific internal control is the responsibility of many different stakeholders. During the process of internal control definition, each of them (i.e. general manager, auditor, financial manager, security manager, etc.) tries to define, from his perspective, the specific controls that are necessary, and the manner in which they should be implemented in the organizational processes. This allows the organization to choose among the many control methodologies proposed, depending on their individual stakeholder perspective:
• management,
• security,
• IT auditing,
• compliance,
• quality assurance.
In general, organizations should try to consolidate all the available perspectives to better serve their customers and compete in their market. For each individual perspective, a list of internal controls is proposed, and these controls can overlap. As illustrated graphically by Radovanovic et al. [19] (see Figure 2), several perspectives are represented: COBIT for internal IT auditing, ITIL for IT services, ISO 9001 for quality assurance, and ISO 17799 for security.
However, the internal controls that co-exist in an organization have different objectives, which may differ from one perspective to another. For example, the main objective of the internal controls from the IT security perspective is to protect assets from fraud and inappropriate use. From the internal auditing perspective, the control’s main objective is to measure the degree of conformity through qualitative measures based on the results of scaled checklists [20], or even by associating scores with audit evidence and adjusting these scores according to the conformity of each element [21]. This arises from the nature of the audit activity itself, which is defined as a control and counseling activity conducted by a domain expert to improve the quality and conformity of the business process. For this purpose, an auditor needs to know what controls are implemented in a business process and the degree of compliance (or conformity). From a quality assurance perspective, organizations have other concerns related to the performance and quality of their
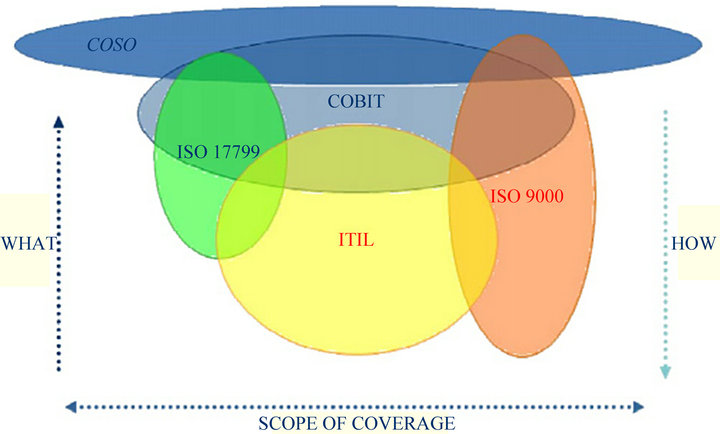
Figure 2. COBIT as a consolidated framework [19].
processes. Given the increasing competition between organizations and the growing complexity of processes and procedures, organizations are constantly looking to improve the quality of their products by adopting quality standards, such as ISO 9001 [22], best practice frameworks, such as CMMI [23], or quality approaches, such as Six Sigma (6σ) and Lean [24].
Looking at all these perspectives, we see that the majority of the process control approaches published in the literature are model-driven [2,6,14,15,25], i.e. process controls are defined when modeling the organization’s business process using graphical representation. Karimi, Wolter et al. [6,25] propose model-driven approaches aimed at the establishment of policies and security controls. These approaches propose modeling the security controls on the business process graphically, with annotations, in order to allow business and security experts to define the security controls collaboratively and at the same level of abstraction. Wolter et al. [25] reflect these controls by means of physical security constraints written in XACML (Extensible Access Control Markup Language) that define a declarative access control policy language implemented in XML and a processing model describing how to measure authorization requests according to the rules defined in policies.
Figure 3 gives an example of two different modeldriven approaches in which authors annotate the process activities depicted in business processes [2,11] (Figure 3(a)) or create special shapes [12] (Figure 3(b)) to graphically represent internal controls. These graphical representations are then later translated into an executable script that is ready to deploy on an application server (like Apache, JBoss, etc.). Once deployed, the script is verified using a model checking technique.
Regardless of the type of representation used, the internal control approaches found in the literature do not take into consideration the control’s perspectives. Every control is represented using the same annotation or shape. In a world where there are many competing perspectives, this makes it difficult to distinguish individual perspectives, and could lead to confusion among the stakeholders when they participate in the process of implementing internal controls in the organizational processes.
 (a) (b)
Figure 3. Examples of internal control representations [2, 12].
In the next part of this paper, we propose a solution to this problem in the form of a multiperspective graphical representation that combines as many different control perspectives as possible. The proposed approach builds on the concepts published by Monsalve, April, and Abran [1], who proposed a multiperspective BPM notation that identifies the specific BPM constructs preferred by stakeholders. Before describing the proposed multiperspective framework in more detail, a synthesis is required of the many different approaches currently used to graphically represent hierarchical information (such as internal controls).
3. Hierarchical Information Representation Approaches
Information visualization is a research domain that has been growing in popularity in recent years. It is defined as the study of interactive visual representations of abstract data to reinforce human cognition. The visualizetion of hierarchical information constitutes a specific research area, in which data are represented using tree structures. In this section, we present a synthesis of popular hierarchical frameworks, and compare the proposals in an attempt to answer the following question: Which hierarchical framework is best suited for visualizing a multiperspective representation of internal controls?
3.1. Tree Layout
In the literature, flowcharts are the form of hierarchical data representation most often used. In fact, the flowchart representation is a special case of the representational structure known as a “tree”. In the literature, we find several types of trees, the most popular being [26] the following:
• Vertical tree (flowchart) (Figure 4(A)): This is a typical tree layout in which the root node is at the top and the leaves are at the bottom.
• Horizontal tree (orientation from right to left, or left to right) (Figure 4(B)): This tree is identical to a conventional vertical tree, except that its root is on the left and its leaves are on the right.
• Icicle tree (Figure 4(C)): This is a tree in which nodes are represented by rectangles. Nodes of the same level are on the same line, beside one another. The root of the tree is represented by the biggest rectangle. Each leaf rectangle is placed below the rectangle of its parent. The size of the rectangle is proportional to the size of the node.
• Radial tree (Figure 4(D)): This is a tree in which the nodes are placed in concentric circles, and the center is the root of the tree.
• Concentric circles (Figure 4(E)): These are defined as the circular form of an icicle layout, in which the size of the nodes is proportional to the angle swept by each one.
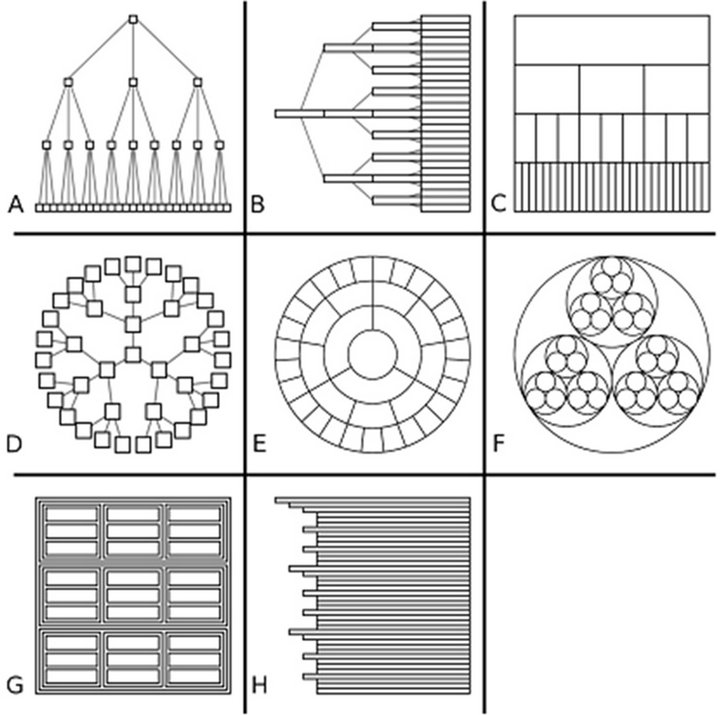
Figure 4. Tree layouts [26].
• Nested circles (Figure 4(F)): These forma tree lay out in which each node is represented by a circle. In each parent circle, we find the circles illustrating the descendant nodes.
• Treemap (Figure 4(G)): This layout is similar to the nested circles layout, except that in a Treemap, nodes are represented by rectangles rather than circles. In the Treemap, the display space is divided into rectangles (one for each node). Each parent rectangle includes the rectangles of its descendant nodes, and so on.
• Indented tree (Figure 4(H)): This tree is similar to the Windows Explorer tree, in which the nodes are listed one under the other. The parent node is at the top of this list.
All the tree layouts presented above are considered as two-dimensional representations. However, there are also three-dimensional representations. An example is the conical tree.
Plaisant, Grosjean, and Bederson [27] maintain that the three-dimensional representation approaches are more attractive than their two-dimensional counterparts; however, they do not currently manage space effectively, and they also increase the complexity of the representation for the user, in terms of both understanding and interaction. For these reasons, we have opted to restrict our research to the potential of two-dimensional tree layout techniques to solve our problem.
At this stage of our research, several questions can be asked: Of all these tree layouts, is there one that is better for visualizing multiperspective internal controls? If so, which criteria should be used to choose the tree layout?
In order to answer these two questions, we have conducted a literature review of the research conducted on this topic.
3.2. Comparison of Tree Layouts
Several publications compare tree layouts and attempt to determine which layout is the most suitable for representing structured data. In comparing tree layouts, these publications focus primarily on two criteria: 1) space management, and 2) usability.
McGuffin and Jean-Marc [26] compare the different representations of two dimensional trees mathematically, using the space management criterion. Their assumption is that the size of the node labels tends towards 0 when the tree size tends towards infinity. That study is aimed at comparing the performances of trees by studying the speed of the tendency of their labels to move towards 0. Their findings reveal that the Treemap is the layout that can ensure more efficient management of the representation space. This can be explained by the fact that the Treemap uses all the display space to represent its contents. However, the continual division of the triangles in the Treemap can cause thin and elongated triangles that become difficult for the user to select or compare. In order to remedy this problem, Bruls, Huizing, and Van Wijk [28] proposed an algorithm to approximate the ratio of the Treemap rectangles to 1. The resulting rectangles will be “squarified”, and therefore easier to select and compare.
Another limitation of the Treemap presented in the literature is that the structure of the tree is not clearly visualized, especially in the case of large or balanced trees (i.e. each parent has the same number of descendants, and all the descendants are the same size). In the case of balanced trees, Treemaps will be similar to regular grids, and so it will be difficult to determine their structures (differentiating the parents from the descendants).
The limitations of the Treemap are related more to the usability criterion than to the space management criterion. In effect, allow a clear perception of the tree structure and facilitate the selection of the rectangles are considered as to be usability criteria that ensure better use of the Treemap. Usability is defined by ISO 9241-11 [29] as “the degree to which a product can be used by specified users to achieve specified goals effectively, efficiently, and ensuring a certain level of user satisfaction.” So, in addition to the effectiveness and efficiency of an interface, user preference (or user satisfaction)is a major criterion in determining the degree of usability of an interface. Applying this definition in the context of trees, Barlow and Neville [30] attempt to decompose the usability criterion into 3 subcriteria: 1) ease of interpretation; 2) node magnitude; and 3) user preference.
In the literature, usability is measured mainly by conducting experiments with the help of users, asking them to execute a specific task (such as “select the deepest leaf in the tree” or “select the immediate ancestor of two nodes”, etc.) and measuring their performance (time, success rate, eye-tracking, etc.) [30-32]. Other approaches to measure the usabitity of tree layouts are based on mathematical models, such as the Hickman model (used to estimate the reaction time of the user), and the Fitts model (used to estimate the movement time of the user). Finally, experimental approaches are considered the most effective way to measure the usablity of tree layouts [26]. However, these approaches do not lead to the same findings in terms of which tree layout is the most suitable for visualizing structured information. In fact, the tasks on which the user performance measures are based differ from one approach to another, and depend mainly on the application domain (i.e. datamining, business, IT, etc.) and on what researchers expect from these layouts. For these reasons, we have found contradictions between the approaches and their findings. For example, in [33], the horizontal tree layout is recommended, with the nodes displayed on multiple columns (see Figure 5). According to [32], the horizontal tree, even when it is oriented from left to right (normal reading direction in Latin languages), is not as efficient as, for example, the vertical layout (with the root at the top and the leaves at the bottom). This is explained by the fact that, in the case of the horizontal tree, the distance would be greater than for the vertical tree, as the nodes travel horizontally, and it would be much worse if the nodes with the same parent were displayed in multiple columns, one beside the other, as they are in [33]. By contrast, in the case of vertical trees, the nodes travel vertically, and so the travel distance would

Figure 5. Multi-column tree [33].
be shorter. Some researchers [32] are aware of this difference in the findings, and claim that their results and conclusions are valid only for the tasks and the domain they are evaluating. For this reason, it is difficult to determine which tree layout is better in terms of usability. Nevertheless, it is possible to determine which layout is better for a set of tasks, or for a particular domain (bounded by these tasks).
Developing an exhaustive task list is not the only difficulty in measuring the usability criterion. In the approach proposed by Barlow and Neville [30], for example, despite the fact that they have compiled an extensive list of tasks to evaluate several types of trees (i.e. organizational chart, nested circles, Icicle, and Treemap), the authors could not definitively identify the most usable layout. This could be explained by the fact that there are better interface layouts for some tasks, but not for all of them).
After conducting this literature review, we can say that the Treemap is the preferred option in terms of space management, and that there is no clear consensus on usability. In fact, usability is difficult to measure. In the next section, we propose ways to address these issues, in order to select the most appropriate tree layout for the visualization of multiperspective internal control.
4. Illustration of the Proposed Solution
In this section, we use the analytical hierarchy process (AHP) to identify the most appropriate tree layout for the multiperspective representation of internal controls. Based on the AHP results, we developed a prototype using the representation we selected for multiperspective internal control.
4.1. Modeling the Decision Problem with AHP
The problem of selecting the most appropriate tree layout to represent a multiperspective internal control can be summarized as a multicriteria analysis problem. Such problems can be resolved using approaches like AHP, which is a structured technique for organizing and analyzing complex decisions, based on mathematical and psychological analysis. The decision to use the AHP technique is based on its ability to:
• decompose a complex problem into simpler modules,
• define a priority order for each criterion,
• provide a means for checking the consistency of judgments made on the criteria.
An AHP problem is composed of criteria and their alternatives. In our case, the alternatives consist of the various tree layouts taken from the literature, namely:
• Vertical trees,
• Horizontal trees,
• Radial trees,
• Indented trees.
Once the alternatives are defined, we need to define the criteria on which we will base our choice. The first level criteria are as follows:
• space management,
• usability.
As recommended by ISO 9241-11 [29], we will decompose the usability criterion into three subcriteria, namely:
• effectiveness,
• efficiency,
• users preference.
Figure 6 illustrates the multicriteria problem modeled in AHP. This model consist of four levels: The objective (level 0), the first criterion (level 1), the second criterion (level 2), and the various possible alternatives (level 3).
Once we’ve formalized the problem in AHP (as represented in Figure 6), we need to assign a weight to the criteria at each level. Then, for each of these criteria, we define the order of tree layouts according to their performance with respect to these criteria. In this step, the ideal approach is to define a list of tasks to measure the performance of the tree layouts with respect to this criterion. However, this would require the development of an interface for each type of tree, and consequently a great deal of effort. For this reason, and to limit the number of interfaces to be developed, we perform one iteration to identify weights for the alternatives, based on: 1) the opinion of 15 experts in the internal control analysis field, and 2) the results of similar experiments published in the literature; and a second iteration (which will be the subject of a future paper), based on our results from the first iteration. We then develop an interface for the two preferred alternatives, and conduct experimental case studies in which we invite users to execute some predefined tasks and measure their performances.
The first experimental case study has been completed. The experts were asked, by email, to fill out an online questionnaire (using a tool named Expert Choice [34]) in which they had to compare criteria at the same level, two by two (Figure 7(A)), as well as the tree layouts for each criterion (Figures 7(A) and (B)) shows a completed questionnaire in which an expert found the tree layout to be more usable than space efficient. Figure 7(B) shows the weighting of the various tree alternatives for the space management criterion. The judgments illustrated in Figure 7(B) are specified based on the work of McGuffin and Jean-Marc (2010).
Figure 8 illustrates the results once the weights had been set. Based on these results (28.23% for the vertical tree), we can conclude that vertical trees were preferred by the experts and seem to be best suited to represent multiperspective internal controls.
However, the results for the radial tree are only slightly
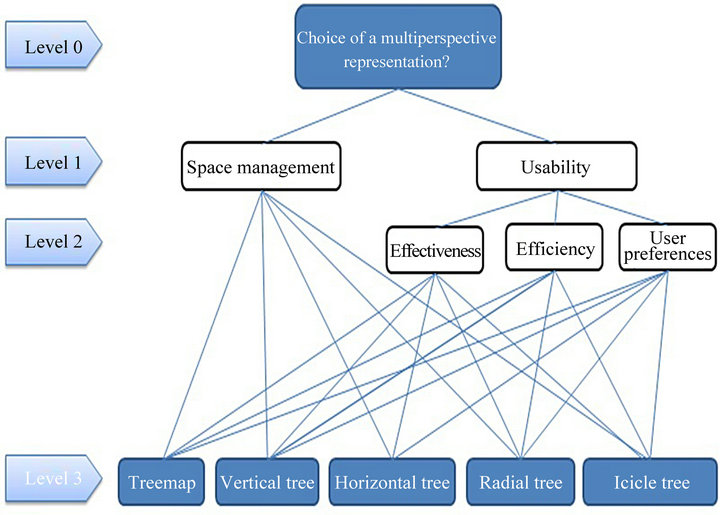
Figure 6. Modeling the decision problem using AHP.
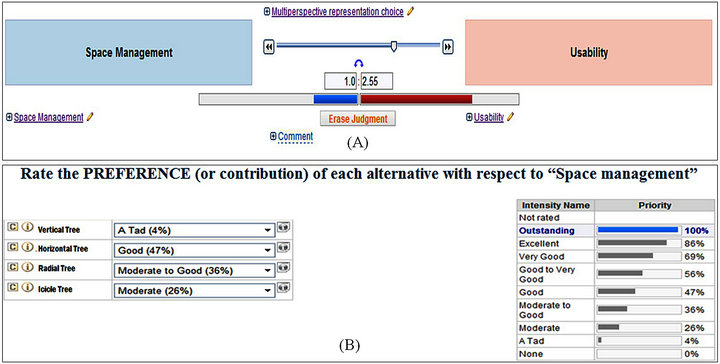
Figure 7. Example of the first case study questionnaire.
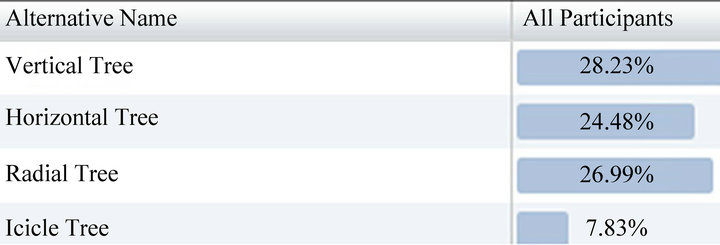
Figure 8. Weighted alternatives vector.
different, at 26.99%.
The AHP technique suggests that a sensitivity analysis be performed to validate these results, by varying the weights of the various criteria and assessing the impact of this variation on the order of the alternatives (Figure 9).
The findings of the sensitivity analysis confirm that the results obtained are fairly robust and reliable. The vertical tree layout is considered the best alternative, with a variation of 15% for the usability criterion relative to the space management criterion. In other words, the order of the alternatives remains the same, on condition that the experts do not change their mind and favor the space management criterion over the usability criterion. Even if this variation occurs, it must not exceed the 15% margin of the current weighting. If it does, the radial tree becomes
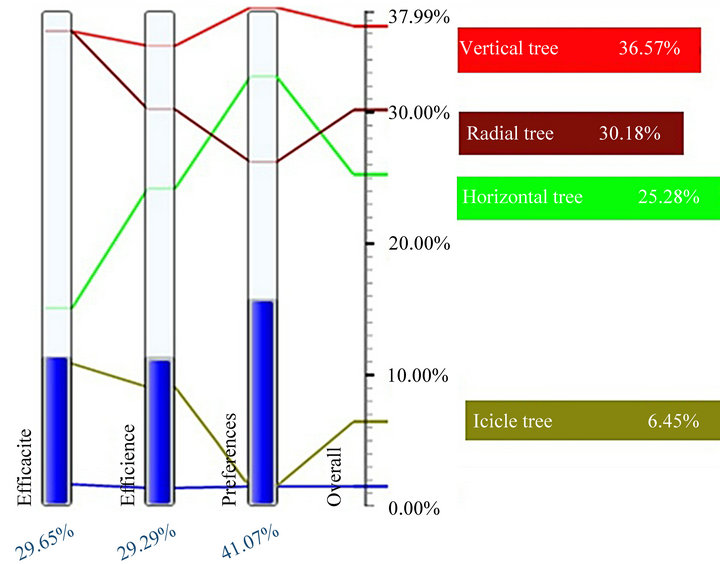
Figure 9. AHP sensitivity analysis.
the most appropriate framework for respresenting the internal controls, according to the experts.
Although 15% is a fairly reassuring margin, we have chosen to provide the user with two additional opportunities to represent the multiperspective internal controls: vertical trees and radial trees. The prototypes of these two representations are presented below.
4.2. Proposed Multiperspective Representation of Internal Controls
In this section, we present a prototype interface of the proposed multipespective representation of internal controls using the vertical and radial tree layouts. The actual prototypes will be developed and tested by users in a future case study.
The proposed prototype will offer four hierarchical representation levels, namely:
• Level 1: objectives of the controls,
• Level 2: business level (strategic, organizational, operational),
• Level 3: internal controls,
• Level 4: business processes.
The proposed interface will present these levels by highlighting the internal controls, along with their multiperspective aspects. The interface has been designed to offer vertical and radial trees to represent structured internal controls. The user interface invites the user to select one of the internal control objectives that the organization aims to achieve (an example of the user interface is provided in Figure 10).
Once a control objective has been selected, the interface changes the display to a multiperspective view of that internal control. Based on the user preference, the internal control will be presented in either a radial tree representation (Figure 11) or a vertical tree representation. Due to space limitations, we present only the radial
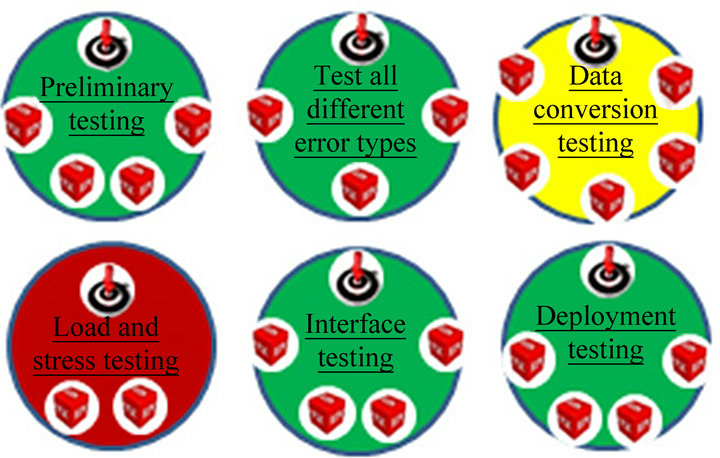
Figure 10. Internal control objectives of the organization.
tree representation here. Our proposed vertical tree representation is similar to the classic flowchart, and we use the same icons and data as in the radial representation (only the layout changes).
In Figure 11 below:
• The business levels are illustrated by the icons ,
,  , and
, and  to indicate levels 1, 2, and 3 respectively.
• The perspectives are represented by the icons  ,
,  , and
, and  to indicate(in this case) COBIT, CMMI, and COSO respectively.
• The internal controls are represented by circles labeled with unique identifiers. Note that the label orientation remains the same (left to right), regardless of the location of the internal control node in the circle (right or left semicircle). The circle colors change from green to yellow to red, according to the conformity of the internal control (Green = Conforming, Yellow = Partially conforming, red = Non-conforming). The control color is determined as in [21], and is explained in another publication.
• The business processes are represented by blue circles, with an identifier for each of them, as for the internal controls.
In a radial representation, the user can choose to focus on just one of the displayed nodes, in this case selecting the node in question and clicking on it. The selected node is then displayed on the whole screen, including the details of the branches for which it is a parent. For example, when a user selects one of the business level nodes (i.e. strategic, tactical, or operational), the interface will interactively adapt to the desired view, and the selected level will appear in the center of the screen with all the control perspectives (Figure 12(a)). The user can also select one of the perspectives, for example COBIT, to see which COBIT controls have been implemented, in which of the organization’s business processes, their level of conformity, etc. (Figure 12(b)).
By double clicking one of process nodes, the selected process is displayed, showing the location of the parent control (Figure 13).
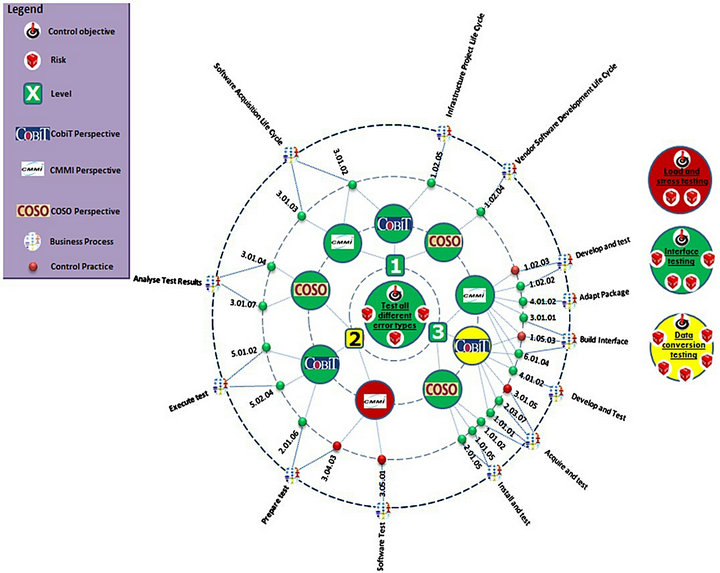
Figure 11. Multiperspective representation of internal controls.
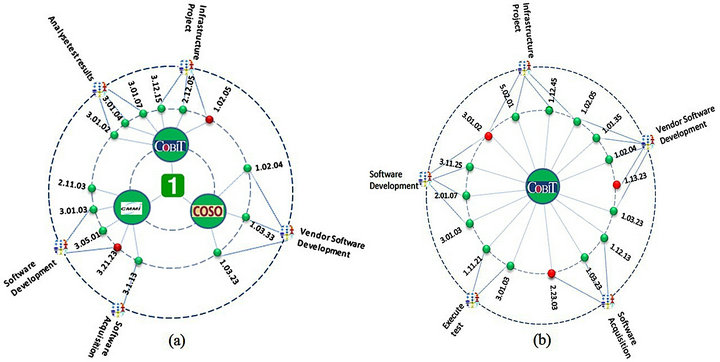
Figure 12. Multiperspective views of internal controls.
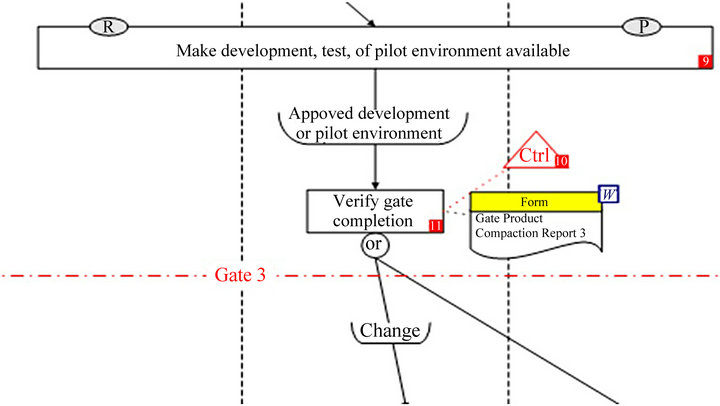
Figure 13. Example of the internal controls in a business process.
5. Discussion, Conclusion, and Research Outlook
Internal control is one of the most important processes in the business process management lifecycle. The business process must conform to internal controls issued from a number of perspectives. However, not only are current representation approaches monoperspective, current BPM notations do not consider the many control perspectives involved in modeling business processes (the internal controls are modeled using simple annotations, and the same annotation is used for all the controls).
The proposed approach is promising, because of its ability to enable the user to move from a global view of the internal controls (Figure 11) to a very detailed view, which enables the user to see when the internal control was implemented, and where (Figure 13). The move from the global view to the detailed view is achieved by providing the user with a multiperspective view of the control objectives. This means that stakeholders with different perspectives (management, IT, security, internal auditing, compliance, quality assurance, etc.) can share the same BPM organizational repository, and the same vision and understanding of the controls implemented.
Our continuing research will involve the further development of the prototype and more case studies, using industrial settings. In this case study, we invited users to execute specific tasks and measure their performance to determine which representation layout (vertical or radial) to select as the most appropriate for representing a multiperspective view of the internal controls in BPM. We also began working on the three research questions presented in Figure 1.
REFERENCES
- C. Monsalve, A. April and A. Abran, “Representing Unique Stakeholder Perspectives in BPM Notations,” Proceedings 8th ACIS International Conference on Software Engineering Research, Management and Applications (SERA), Montreal, 24-26 May 2010, pp. 42-49. doi:10.1109/SERA.2010.16
- S. Sadiq, G. Governatori and K. Niamiri, “Modeling Control Objectives for Business Process Compliance,” 5th International Conference on Business Process Management, Vol. 4714, 2007, pp. 149-164. doi:10.1007/978-3-540-75183-0_12
- J. E. Gamble and A. A. Thompson Jr., “Essentials of Strategic Management: The Quest for Competitive Advantage,” 3rd Edition, McGraw-Hill Inc., New York, 2012.
- C. Stefansen and S. E. Borch, “Using Soft Constraints to Guide Users in Flexible Business Process Management Systems,” International Journal of Business Process Integration and Management, Vol. 3, No. 1, 2008, pp. 26-35. doi:10.1504/IJBPIM.2008.019345
- L. Turner and A. Weickgenannt, “Accounting Information Systems: Controls and Processes,” 2nd Edition, Wiley, San Francisco, 2012.
- V. R. Karimi, “Formal Analysis of Access Control Policies for Pattern-Based Business Processes,” 2009 World Congress on Privacy, Security, Trust and the Management of E-Business, Saint John, 25-27 August 2009, pp. 239-242. doi:10.1109/CONGRESS.2009.18
- R. K. Vahid, “Verification of Access Control Policies for REA Business Processes,” Computer Software and Applications Conference, Vol. 2, 2009, pp. 422-427. doi:10.1109/COMPSAC.2009.170
- C. Ramaswamy, “Business Process Driven Framework for Defining an Access Control Service Based on Roles and Rules,” 23rd National Information Systems Security Conference, Baltimore, 16-19 October 2000.
- S. Huang, H. M. Cai and B. Y. Xu, “A Resource StateBased Business Process Control Mechanism for BPM,” International Conference on Progress in Informatics and Computing (PIC), Piscataway, 10-12 December 2010, pp. 1157-1161. doi:10.1109/PIC.2010.5687985
- Y. C. Ren, T. Xing, D. Y. Jiang and P. Zhu, “Research on Software Quality Control Method Based on Control Chart,” IEEE 2nd International Conference on Computing, Control and Industrial Engineering (CCIE), Jinzhou, 20-21 August 2011, pp. 274-277.
- B. B. Anderson, J. V. Hansen, P. B. Lowry and S. L. Summers, “Model Checking for E-Business Control and Assurance,” IEEE Transactions on Systems, Man, and Cybernetics, Part C: Applications and Reviews, Vol. 35, No. 3, 2005, pp. 445-450. doi:10.1109/TSMCC.2004.843181
- G. Succi, L. Benedicenti, S. de Panfilis and T. Vernazza, “Activity-Based OO Business Modeling and Control,” IT Professional, Vol. 2, No. 3, 2000, pp. 45-50. doi:10.1109/6294.846211
- I. Oditis and J. Bicevski, “The Concept of Automated Process Control,” Computer Science and Information Technologies, Vol. 756, 2010, pp. 193-203. http://www.lu.lv/materiali/apgads/raksti/756_pp_193-203.pdf
- M. Kehlenbeck, T. Sandner and M. H. Breitner, “Managing Internal Control in Changing Organizations through Business Process Intelligence—A Service Oriented Architecture for the XACML Based Monitoring of Supporting Systems,” 43rd Hawaii International Conference on System Sciences (HICSS), Honolulu, 5-8 January 2010, pp. 1-10. doi:10.1109/HICSS.2010.262
- I. Bider and A. Striy, “Controlling Business Process Instance Flexibility via Rules of Planning,” International Journal of Business Process Integration and Management, Vol. 3, No. 1, 2008, pp. 15-25. doi:10.1504/IJBPIM.2008.019344
- Business Dictionary, “Process Control,” 2011. http://www.businessdictionary.com/definition/businessprocess.html
- A. Zakarian, P. Wickett and Y. Siradeghyan, “Quantitative Model for Evaluating the Quality of an Automotive Business Process,” International Journal of Production Research, Vol. 44, No. 6, 2006, pp. 1055-1074. doi:10.1080/00207540500371949
- Addison-Hewitt, “Sarbanes-Oxley Act,” 2012. http://www.soxlaw.com/
- D. Radovanovic, T. Radojevic, D. Lucic and M. Sarac, “IT Audit in Accordance with COBIT Standard,” MIPRO, Proceedings of the 33rd International Convention, Opatija, 24-28 May 2010, pp. 1137-1141.
- A. April, A. Abran and E. Merlo, “Process Assurance Audits: Lessons learned,” Proceedings of the International Conference on Software Engineering, Kyoto, 19- 25 April 1998, pp. 482-485. doi:10.1109/ICSE.1998.671611
- R. Ouanouki and A. April, “IT Process Conformance Measurement: A Sarbanes-Oxley Requirement,” Proceedings of the IWSM, Mensura, Palma de Mallorca, 5-8 November 2007, pp. 26-37.
- D. Hoyle, “ISO 9000 Quality Systems Handbook,” 5th Edition, Butterworth-Heinemann, Amsterdam, 2006.
- T. Kasse, “Practical Insight into CMMI,” 2nd Edition, Artech House, Boston, 2008.
- T. T. Allen, “Introduction to Engineering Statistics and Six Sigma: Statistical Quality Control and Design of Experiments and Systems,” Springer, London, 2006.
- C. Wolter, M. Menzel, A. Schaad, P. Miseldine and C. Meinel, “Model-Driven Business Process Security Requirement Specification,” Journal of System Architecture, Vol. 55, No. 4, 2009, pp. 211-223. doi:10.1016/j.sysarc.2008.10.002
- M. McGuffin and R. Jean-Marc, “Quantifying the SpaceEfficiency of 2D Graphical Representations of Trees,” Information Visualization Journal, Vol. 9, No. 2, 2010, pp. 115-140.
- C. Plaisant, J. Grosjean and B. B. Bederson, “Space Tree: Supporting Exploration in Large Node Link Tree, Design Evolution and Empirical Evaluation,” IEEE Symposium on Information Visualization (INFOVIS), 29 January 2003, pp. 57-64. doi:10.1109/INFVIS.2002.1173148
- M. Bruls, K. Huizing and J. J. Van Wijk, “Squarified Treemaps,” Proceedings of the Joint EUROGRAPHICS and IEEE TCVG Symposium on Data Visualization, Vienna, 29-31 May 2000, pp. 33-42.
- International Organization for Standardization, “ISO 9241-11 Ergonomic Requirements for Office Work with Visual Display Terminals (VDTS)—Part 11: Guidance on Usability,” International Organization for Standardization, Genova, 1998. http://www.iso.org/iso/catalogue_detail.htm?csnumber=16883
- T. Barlow and P. Neville, “A Comparison of 2-D Visualizations of Hierarchies,” IEEE Symposium on Information Visualization INFOVIS, 2001, pp. 131-138.
- J. Stasko, R. Catrambone, M. Guzdial and K. McDonald, “An Evaluation of Space-Filling Information Visualizations for Depicting Hierarchical Structures,” International Journal of Human-Computer Studies, Vol. 53, 2000, pp. 663-694. doi:10.1006/ijhc.2000.0420
- M. Burch, N. Konevtsova, J. Heinrich, M. Hoeferlin and D. Weiskopf, “Evaluation of Traditional, Orthogonal, and Radial Tree Diagrams by an Eye Tracking Study,” IEEE Transactions on Visualization and Computer Graphics, Vol. 17, No. 12, 2011, pp. 2440-2448. doi:10.1109/TVCG.2011.193
- S. Hyunjoo, K. Bohyoung, L. Bongshin and S. Jinwook, “A Comparative Evaluation on Tree Visualization Methods for Hierarchical Structures with Large Fan-Outs,” 28th International Conference on Human Factors in Computing Systems, Atlanta, 2010. doi:10.1145/1753326.1753359
- Expert Choice, “Expert Choice Software,” 2012. http://www.expertchoice.com/