Journal of Service Science and Management
Vol.6 No.5A(2013), Article ID:41338,11 pages DOI:10.4236/jssm.2013.65A001
Using Critical Incidents to Validate the Direct Measurement of Attribute Importance and Performance When Analyzing Services
![]()
Brandenburg University of Technology Cottbus, Senftenberg, Germany.
Email: Stephanie.loeffler@tu-cottbus.de
Copyright © 2013 Stephanie Löffler, Daniel Baier. This is an open access article distributed under the Creative Commons Attribution License, which permits unrestricted use, distribution, and reproduction in any medium, provided the original work is properly cited. In accordance of the Creative Commons Attribution License all Copyrights © 2013 are reserved for SCIRP and the owner of the intellectual property Stephanie Löffler, Daniel Baier. All Copyright © 2013 are guarded by law and by SCIRP as a guardian.
Received October 2nd, 2013; revised November 4th, 2013; accepted November 29th, 2013
Keywords: Importance-Performance Analysis; Critical Incident Technique; Validation
ABSTRACT
Since its introduction into the marketing literature by Martilla and James, the Importance-Performance Analysis has proven multiple times to be a cost-effective technique for measuring attribute importance and performance of services for the customer. Additionally, it gives managers valuable hints in order to improve their products and services. However, despite a long list of successful applications overtime one critical aspect remains—the validation of the importance values by direct measurement. Besides the limitations and critics that accompanied with stated importance techniques, a lot of research results show that it is better to use direct methods in place of indirect measures. Some researchers suggest measuring the customers’ priority structure to compensate the critical points within the direct questioning. This study shows how the critical incident technique can be helpful for the validation of such results.
1. Introduction
Customer satisfaction is the central concept in marketing policy. It can be seen as the engine for the purchase volume and as release button for repurchases [1]. There is no consistent definition of the key elements of the customer satisfaction concept [2]. Churchill and Surprenant 1982 [1], for example, stated that customer satisfaction is the result of using or buying a product or service that is based on the customers’ comparison of the products or services revenue and costs in relation to the expected consequences. Other researchers stated that success in selling products or services depends on their design and features. Therefore, the impact of single product or service attributes needs to be studied [3-5]. But detecting these decisive and important attributes is not enough, because researchers and practitioners need to know which attributes determine the purchase decision [6]. Therefore, this paper uses the definition of customer satisfaction by Myers and Alpert from 1968 [7], who defined customer satisfaction as a function of expectations concerning important attributes of products and services and the evaluation of the compliance to these expectations or in other words-the attribute satisfaction or performance.
In 1977, as a tool to measure the attribute importance and performance, Martilla and James [8] introduced the so-called Importance-Performance Analysis (IPA) into the marketing literature. IPA, a cost-effective technique that has been in practical use now for more than 35 years and is highly accepted [9]. The idea behind this technique is the development of a comprehensive list of attributes that define a product or service and to ask a sample of customers to rate these attributes on an importance and a performance scale. The results can be displayed on a two dimensional grid where the attributes are positioned according to their average importance on the y-axis and the average performance on the x-axis. Using averages on both axes, the grid can be divided into four quadrants (from low importance/low performance to high performance/high importance) and—according to their position—the attributes receive one of four different normative strategies and recommendations for action [8]. The advantages can be seen in the simplicity [8,10] and as Lovelock, Patterson and Walker [11] suggested, it shows the areas in which investments for improving the performance has the most impact on the increase of customer satisfaction. Applications can be found for objects like travel quest [12], student’s choice of universities [13], meeting destinations in China [14], higher education sector [15], adult education programs [16], Tanzanian national parks [17], service quality [18] and hospitals [19]. But besides the intensive usage of IPA in service theory and practice, there remains a critical issue within the technique has not been sufficiently answered up till now: the question of whether the direct measurement of attribute importance is valid [6,9,10,20]).
2. Direct Importance Measurement-Problems and Advantages
The majority of IPA studies use direct methods when measuring the importance of product or service attributes [21]. The techniques used in research and practice can be seen in Figure 1.
Other researchers prefer indirect measurement of importance ratings [22]. In these studies the respondents are not asked directly for their purchase criteria. The importance ratings are gathered by qualitative research techniques and statistical methods like discriminant analysis, multiple regressions, or conjoint analysis [6,10,23]. Researchers use these techniques to avoid the problems which come along with the direct measurement methods.
As Gustafsson and Johnson [20] suggest, in direct questionnaires the respondent needs to know what is meant by importance, and they need to be clear about their own preference structure. Thus one problem stated by Azzopardi and Nash [22] is the missing predictive validity of the direct measurement. The reason why the validity is missing, is based on the multidimensional concept of importance [21,24,25], as can be seen in the paper by Myers and Alpert [7].
As Jaccard, Brinberg and Ackerman [4] suggest, the concept of importance within the customers decision consist of five different dimensions that need to be considered during the measurement. This means that the researcher should be aware of the importance dimension which needs to be measured and which technique is the best for the focused dimension [25].
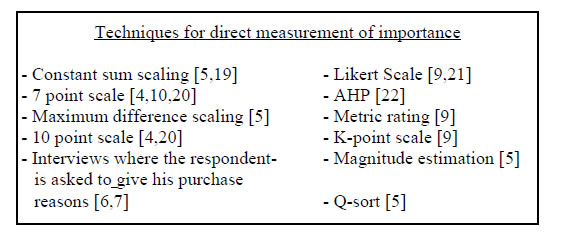
Figure 1. Methods for direct importance measurement.
A problematic trend is the fact that in a lot of IPA studies the importance rates are getting evaluated extremely high with the consequence that they are positioned in the both upper areas of the IPA grid [9,10,22]. The reason for this can be seen in the fact that the importance rating are directly measured and humans tend to present themselves in the best possible way [26]: The majority will not reveal things that are not desirable in society [27], thus the danger of creating an unrealistic picture of the importance of product or service attributes because of social desirability is higher in direct questionnaires [20,26,28]. Another source of the problem can be seen by Martilla and James [8] who suggest that the first step in conducting an IPA should be to determine the most decisive aspects for the customer’s choice of a product or service by using focus groups interviews or personal interviews [8,9]. According to Wade and Eagle [17] the high importance rating for all attributes are not surprising, because the most important aspects have been conducted before. Other problems can be the respondent’s unfamiliarity with the service or product of interest [29] or the participants’ mental overload, when questionnaires are too long or too complex [10,30].
Nevertheless, IPA has not been constructed for an absolute Importance-Performance measurement [8,9,24] and the research in this field shows that the direct measurement is practicable. As Bottomly, Doyle and Green [31] note the direct measurement is the preferred one by the respondents and should be used for that reason rather than indirect methods. Additionally, they found that the direct measurement results are more solid concerning estimated weights and more stable in a test-retest situation. Bacon [10] stated that the underlining assumption of IPA cannot be met with statistically indirect methods. Alpert [6] also identified the direct questioning as a more effective predictive model.
Coming back to the problem, that the importance ratings are pointless, because they are concentrating in only one area of the Importance-Performance grid, priorities should be measured simultaneously. This would help to know which attributes need to be imperatively improved [32]. Bacon [10] recommends validating the results of an IPA with other methods for direct questioning to reveal these priority structures.
To prevent the same problems that have been discussed within the direct questioning an indirect measurement has been used to validate the results - the Critical Incident Technique.
3. The Critical Incident Technique (CIT)
The Critical Incident Technique is a qualitative analysis technique [33,34], which allows a stepwise analysis of complex human action in special situations [35]. It was introduced into the psychological literature in 1954 by John C. Flanagan, who developed this method for the evaluation of effective or ineffective patterns in the workflow [36] within the US Air Force [37].
The popularity of using CIT for marketing relevant problem formulations was stimulated through a paper by Mary Jo Bitner, Bernard H. Booms and Mary Stanfield Tetreault [36] who used CIT for analyzing critical incidents in different service branches with focus on the employee-customer contact situations [38]. Since that study more than 130 papers had been published using CIT by 2003 in the marketing literature [36]. Regarding the publications from 2004 till 2013, we found additional 71 papers in the marketing literature. Applications can be found in various research subjects, for example in health care [39,40], restaurants [41], education [42], job behavior [43] and tourism [44,45].
As Flanagan [37] explained, a CIT study should consist of 5 main steps as can be seen in Figure 2, ranging from the problem definition over the data collection to the analysis and interpretation of the results. The main idea is to ask a sample of respondents to address important aspects that they liked, and did not like, during the service production. By categorizing these so-called critical incidents and counting them out across the sample, the analyst obtains a list of important categories/attributes and - over the relation between positive and negative comments in these attributes a performance evaluation.
Despite the popularity of the method some critical points have been discussed. Chell [33] doubts the validity and reliability, but Ronan and Latham [46] for example used different measures for reliability and validity and found satisfactory results. The interpretation of the results and the analysis was criticized for example by Edvardson [47]. However, Anderson and Nilsson [48] studied the same aspects with special concentration to the
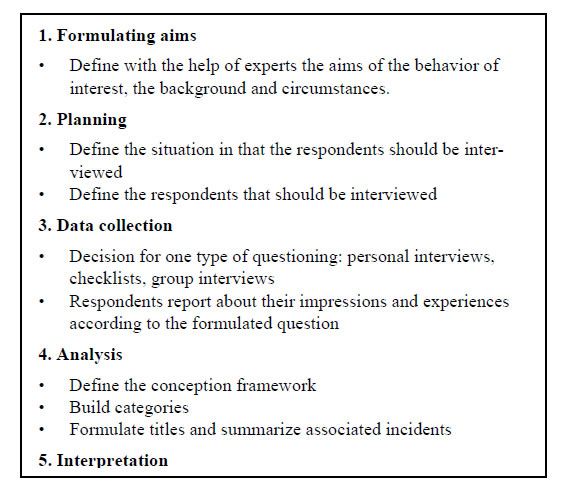
Figure 2. The CIT process source: [37].
formulation of categories and found satisfactory results. Another problem can be the influence of the interviewer or misunderstood questions. Hence, Flanagan [37] suggests to formulate the questions as precise as possible and not to comment the respondent’s answers.
Despite the presented critical aspects, just a few applications have been made within the technique. Stauss and Weinlich [49] for example formed the Sequential Incident Technique, which determine all incidents in the service process using the CIT.
Keaveney [50] developed the Switching Path Analysis Technique, a method that studies the negative critical incidents which lead to switching behavior.
The Criticality Critical Incident Technique (CCIT) presented by Edvardson and Roos [51] should also be mentioned. The researchers developed this method on the basis that the CIT technique and the two mentioned applications depend on remembered incidents of the respondents.
Finally the positive aspects of the CIT are significant. The method is flexible [37] and therefore, applicable for a lot of study objectives, as the research examples mentioned showed. It gives a comprehensive view inside the customer perception [47] and show how they really think [52]. Some more advantages can be seen by Gremler [36]. For the usage in this study the suggestion made by Bitner, Booms and Tetreault [38] “Hence, not all service incidents were classified, only those that customers found memorable because they were particularly satisfying or dissatisfying. Examining such memorable critical incidents is likely to afford insight into the fundamentally necessary factors leading to customers’ dis/satisfactory evaluations.” and Gremlers [36] notion “there is no a priori determination of what will be important.” compensate the problem discussed in the direct questioning section.
However, some researchers proofed the usefulness of incident based methods in comparison to attribute based methods and found some interesting aspects, which underline the relevance of this study, too.
Stauss and Hentschel [53] studied the applicability of attribute - and incident based methods for measuring service quality measurement. They concluded that both techniques lead to different results. Some other researchers have discussed this problem as well. Stauss [54] and Stauss and Weinlich [49] presented the same problems. They analyzed the SERVQUAL Method - a technique for determining the customer’s perception of the service quality [55] and criticized that methods like these are not able to detect all the critical and decisive factors that influence the customers purchase decision. Therefore, the CIT mentioned as alternative measurement, because of the advantages mentioned above. Matzler and Sauerwein [55] also discuss the problem that IPA does not distinguish between basic, performance, or excitement factors. Nor does IPA adequately address the respondents’ interpretation of the importance of these factors. As a result, IPA can result in faulty marketing strategies.
They concentrated on the CIT as well and mentioned the same problem, but argued that most of the CIT studies were conducted to determine the factors that influence the customers’ satisfaction. They conclude that it is vague to define if the mentioned attributes whether evaluated as important or not, do really have influence on the satisfaction of the customer. However, according to Martilla and James [8], every IPA should determine the decisive importance and performance aspects and use customer or professional interviews during its establishment. However, it can not be expected that the factors that lead to dissatisfaction, when they are not sufficiently met, were not determined.
4. Methodology
4.1. Research Instruments
Two studies, one in the sauna area of a giant indoor waterpark in Germany, done by personal interviews with 100 randomly selected respondents, and another one with 194 randomly selected visitors of a German Bundesliga soccer stadium interviewed while they left the stadium, were conducted. The questionnaires had been developed on the basis of the relevant literature in this field and as Martilla and James [8] specified, expert interviews have taken place. Furthermore, for both services service blueprints were created, a methodology for visualizing the complete service process [56] and to receive a better understanding for the dynamics and critical points [57]. For the first questionnaire 17 items for the satisfaction part were identified along with 14 items for the importance section. The scales were constructed from 1—(“very satisfied”) to 7—(“very dissatisfied”) and from 1— (“very important”) to 7—(“absolutely unimportant”). Using 7—point scale can be seen by other studies [12,58] as well. For the second study, 26 items for both sections have been developed. This scale ranged from 1— (“un-important”) till 5—(“very important”) and from 1— (“awfully bad”) till 1—(“awfully well”) [13,14,16,59]. In the first questionnaire the respondents answered the satisfaction area first, and afterwards the importance statement to avoid order effects as was recommended by Martilla and James [8]. In the other questionnaire the respondents needed to answer the importance questions first and then the performance for each attribute with the background, to see if there are differences. To ask first for the importance and then for the performance is in line with other studies [16,18]. After the importance and performance section, CIT was used. In the first study the visitors were asked: “What aspects or situations do you remember were very positive or very negative during your stay?” In the second study the respondents have been asked to write down the first positive and negative aspect they remember happened during their stay. As discussed in the next section, the first remembered incident is the most important one [60]. To avoid before mentioned interviewer bias, the interviewer did not comment on any answer or urged the respondents to answer if they could not remember any positive or negative aspect.
4.2. Data Analysis
As Figure 1 shows, direct importance can be measured with different methods, however within the IPA means based on simple ratings [8] or Likert scales are used [12,17,61]. Therefore, for IPA, means and significances using SPSS were computed, using the scales mentioned above. Researchers well discussed the dimensions of the IPA grid and presented some new approaches. Slack [32] presented an alternative design of the quadrants. He developed a system which separated the quadrants diagonal for an improved understanding of the relationship between the customer’s behavior and their expectations. Another modification was the using of the dimensions “current effect on performance” and “scope of improvement” instead of performance vs. importance, comes from Easingwood and Arnott [62]. Another presentation of the grid can be seen in Abalo, Varela and Manzano [9] who used both, the diagonal and the quadrant model. The problem can be seen by Oh [24] who demonstrated that the results changed when another type of scaling is used. However, the focus of this study is the demonstration of using an indirect measurement for the validation of the direct importance and performance measurement and not a discussion of the exact grid and for that reason the traditional quadrant visualization is used, which is the presented method in tourism studies [22] and both study subjects can be seen as branches of tourism. A problem within the grid discussion is the design of the axes and their point of intersection. Martilla and James [8] suggested that the middle position of both axes is sound. Because of the strength of the IPA, the identification of relative performance, and importance evaluations, the mean values as well as the median can be used. Researchers can use the scale means as in the study by Hawes and Rao [63] or the actual means from their data, see for example Alberty and Mihalik [16], but the results can be quite dissimilar, with the result that the interpretation must be exact, because they influence the managers decision [24]. In this study the data centered method using the means of the importance and performance evaluations [10] are used.
Figure 2 shows the analyzed results of the CIT. The negative and positive aspects have been sorted in the order they have been mentioned by each respondent. In the second step their appearances have been counted. This technique is in line with the suggestions Swan and Rao [60] made “The importance of past events to people can be roughly estimated by assuming that the more important events will be recalled and mentioned before less important events. Since different numbers of C.I.s were mentioned by different respondents, whether or not one was mentioned first may be meaningful; the other positions have less meaning.” As a consequence the measured mean importance within IPA should be mirrored by the frequency and order of the aspects mentioned by the respondents.
5. Results
5.1. Results of the Demographics and the Attend Ants’ Behavior
The first study consisted of 40% male and 60% female respondents. To make sure that all the respondents are familiar with the branch and service, and to improve the validity of the results they have been asked how often visit a sauna on a regular basis. The majority visit such a service repeatedly during the year. Only 7% stated to use it the first time. Therefore, the problem of the inexperience as factor for poor data as mentioned by Gustaffson and Johnson [20] has been prevented. In the second study, 158 men and 36 women participated. This imbalance is in line with other studies [64]. To prove the familiarity with the branch the respondents were asked to state to which kind of fan they would count themselves. Based on this the intensity of the visit can be applied [65]. The majority of the persons asked, stated to be enthusiastic, faithful fans. Just 8.76% of the respondents stated to watch soccer games in stadiums only occasionally.
5.2. Results of the Importance-Performance Analysis
Tables 1 and 2 show the data-centered results in the first study and the second study concerning the means of the importance and performance of the defined items. Figures 3 and 4 show the transferred data in the grid.
5.3. Results of the Critical Incident Technique
One of the critical aspects mentioned by Oh [24] is that the developed Importance-Performance grid influences the managers’ decision concerning the modification of the worst performing items. For that reason, evidences for the importance structures needed, to make sure that the right aspects are getting improved. The method presented here is the CIT. The results, which have been analyzed according to Swan and Raos [60] suggestions, can be seen for the first study in Table 3 and for the second study from Table 4 in the column “frequency mentioned at first”.
The incidents mentioned have been counted and sorted concerning the order the respondents stated. For the first study 181 critical incidents have been analyzed.
In the second study 95 critical incidents have been reported. The relative small number of reported incidents could be the result of the limitation explained in section 4.1.
5.4. Comparison of Both Results
In both studies x-axis presents the mean values of the performance scale. The y-axis represents the mean values of the importance evaluations for each defined item. To build the four quadrants in both studies the points of interactions represents the mean values of all items. For the
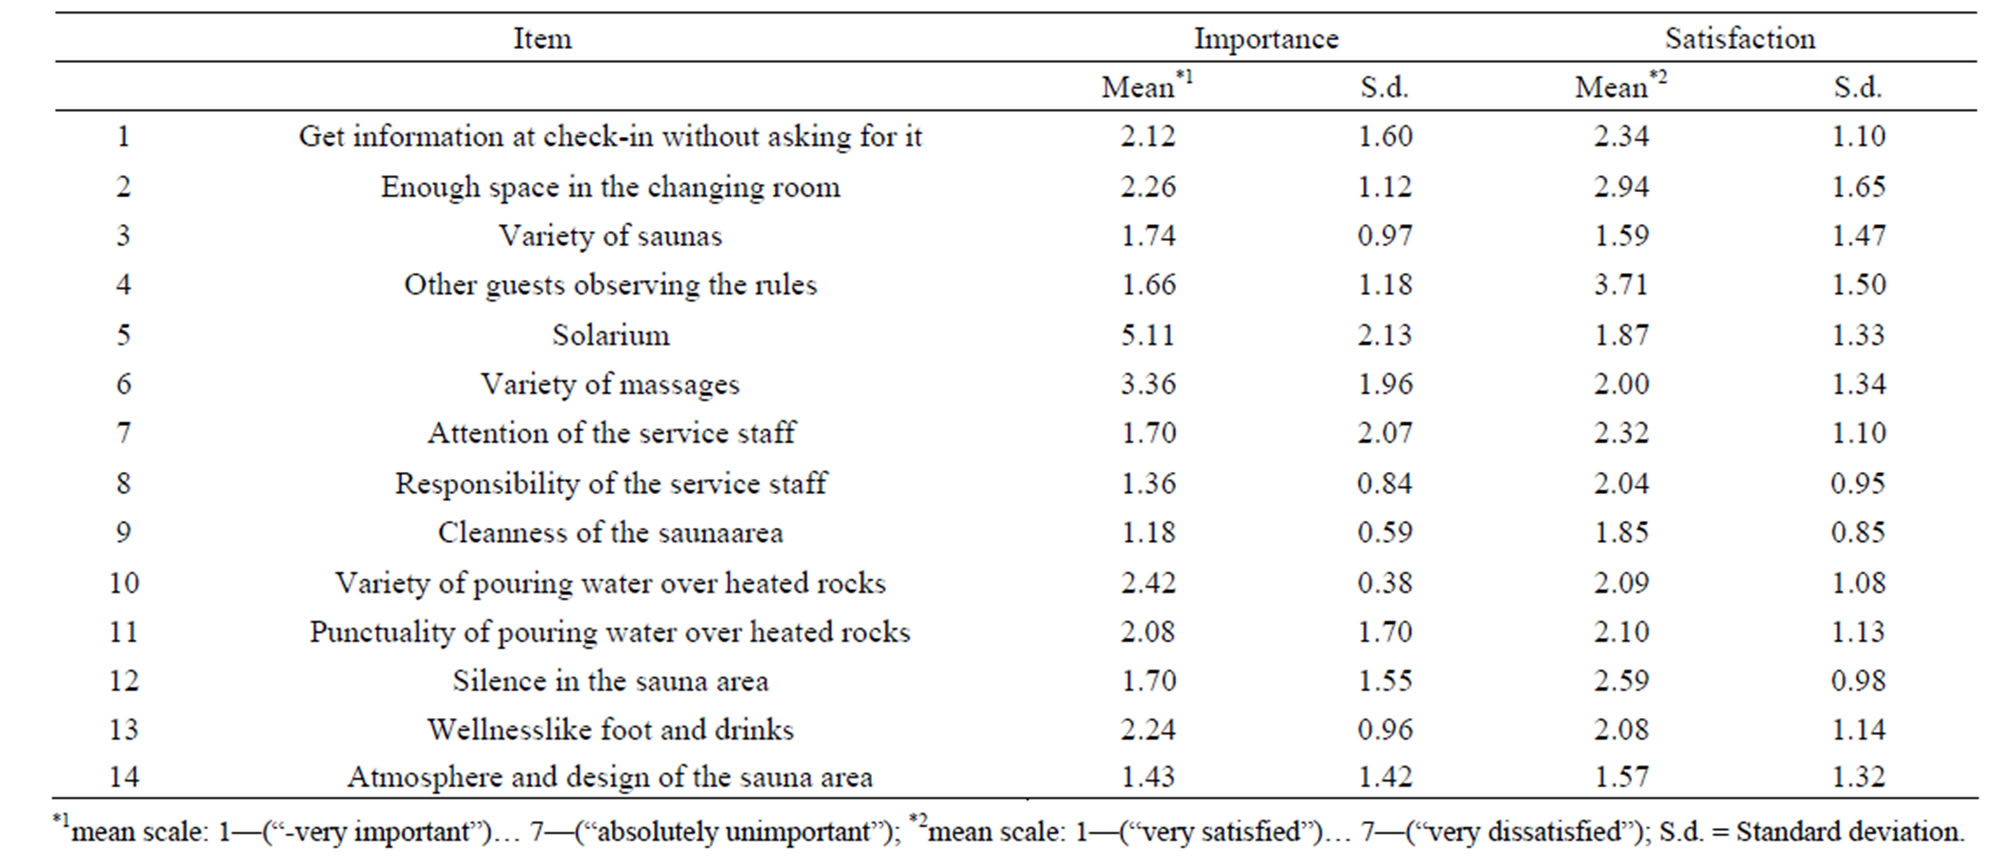
Table 1. IPA results for the first study.
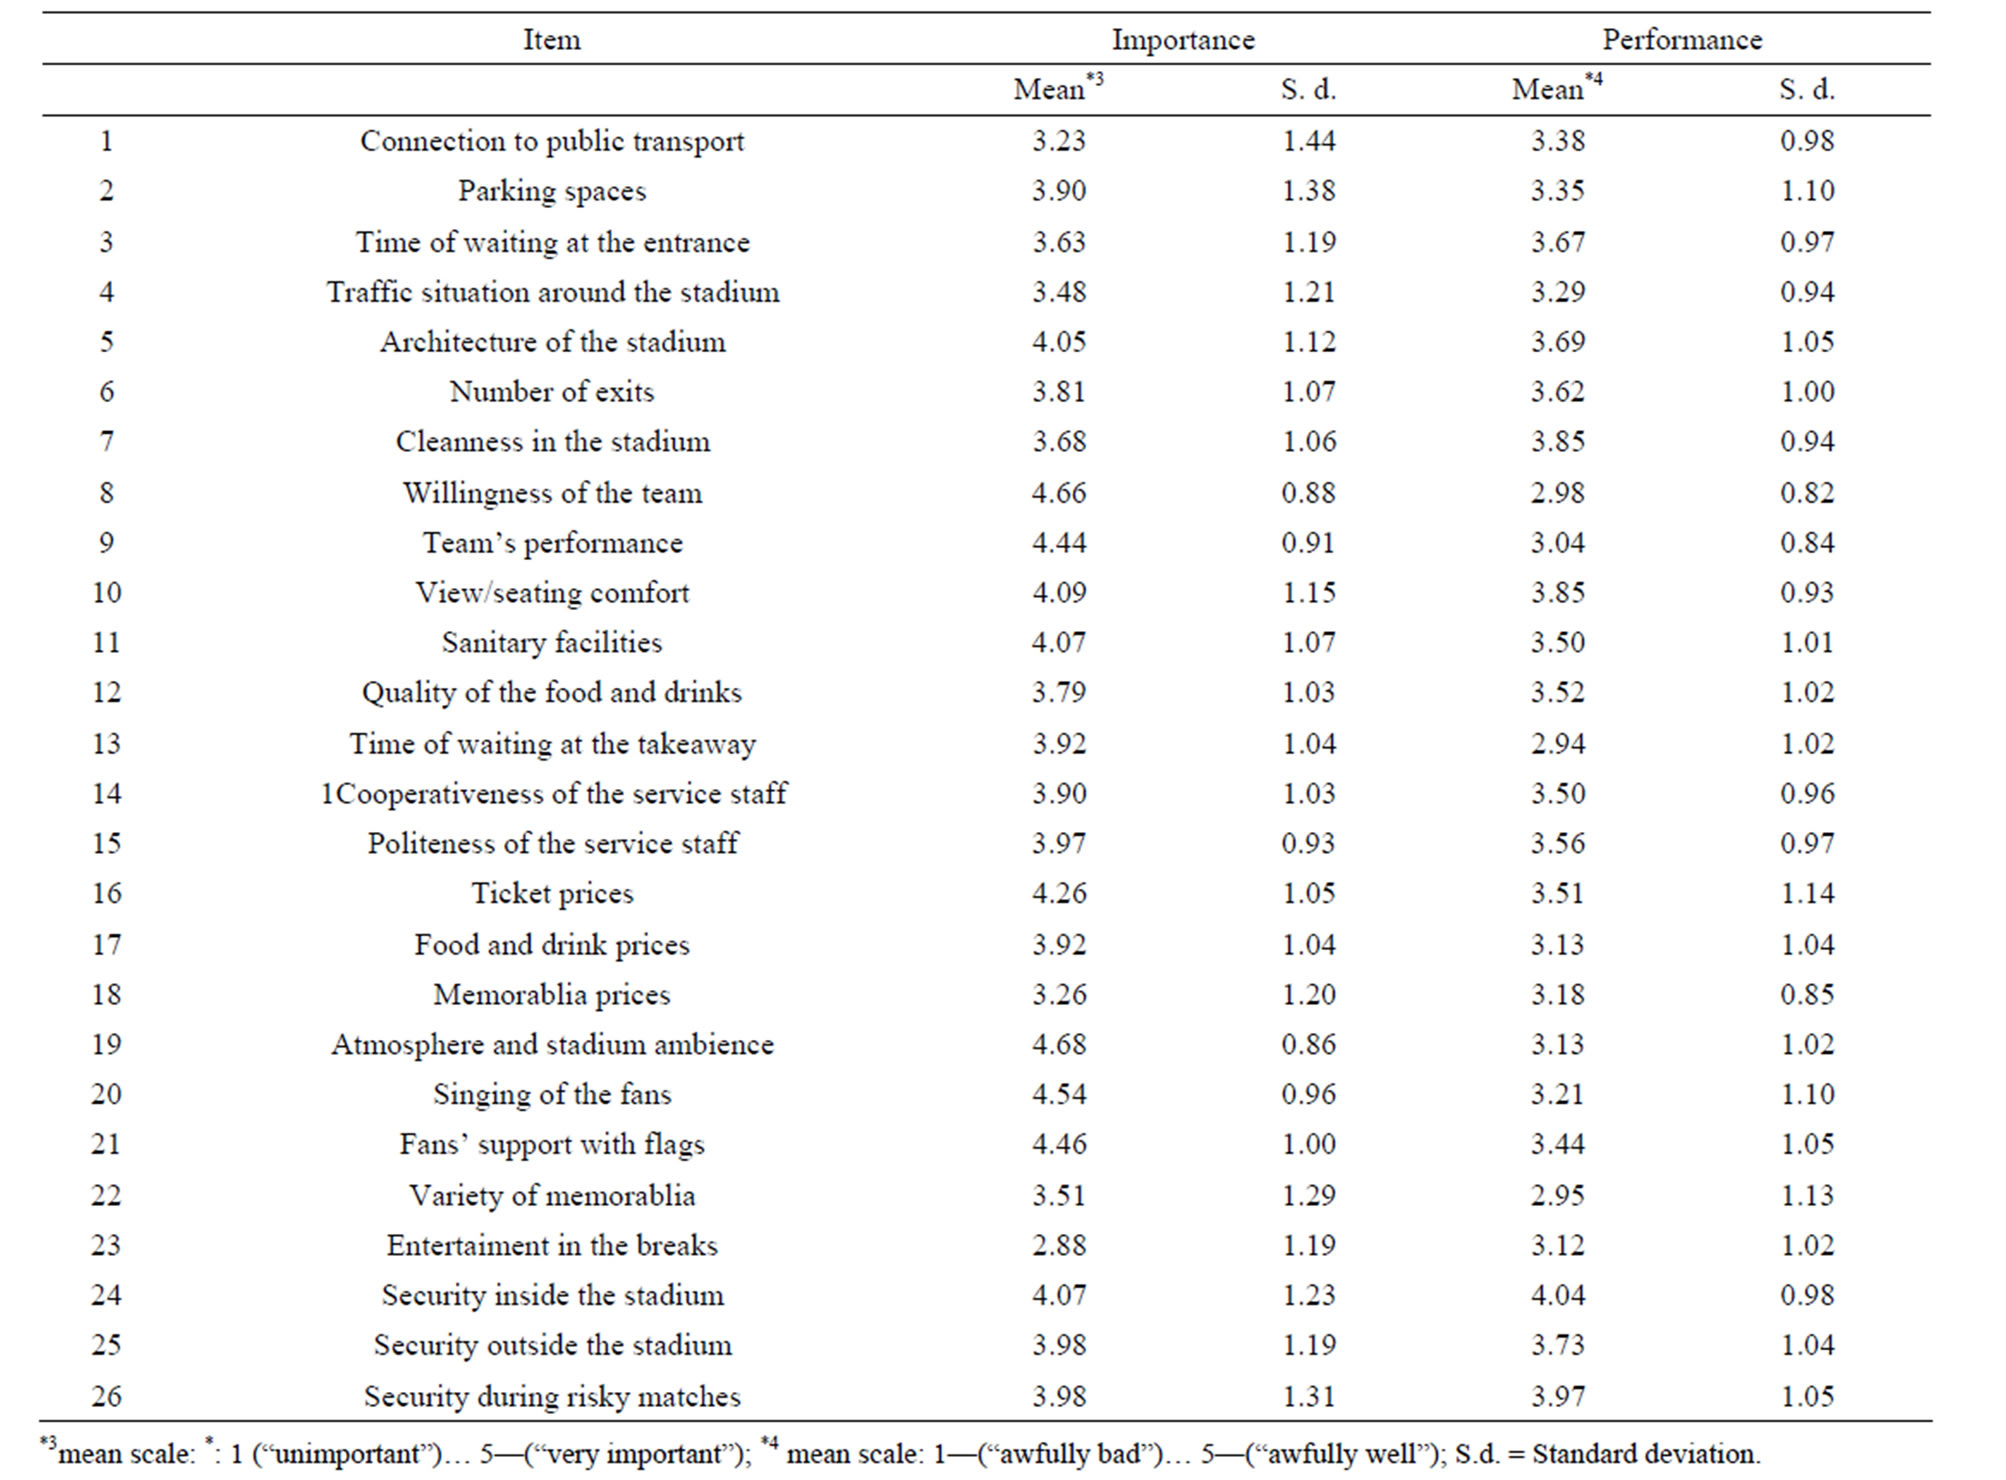
Table 2. IPA results for the second study.
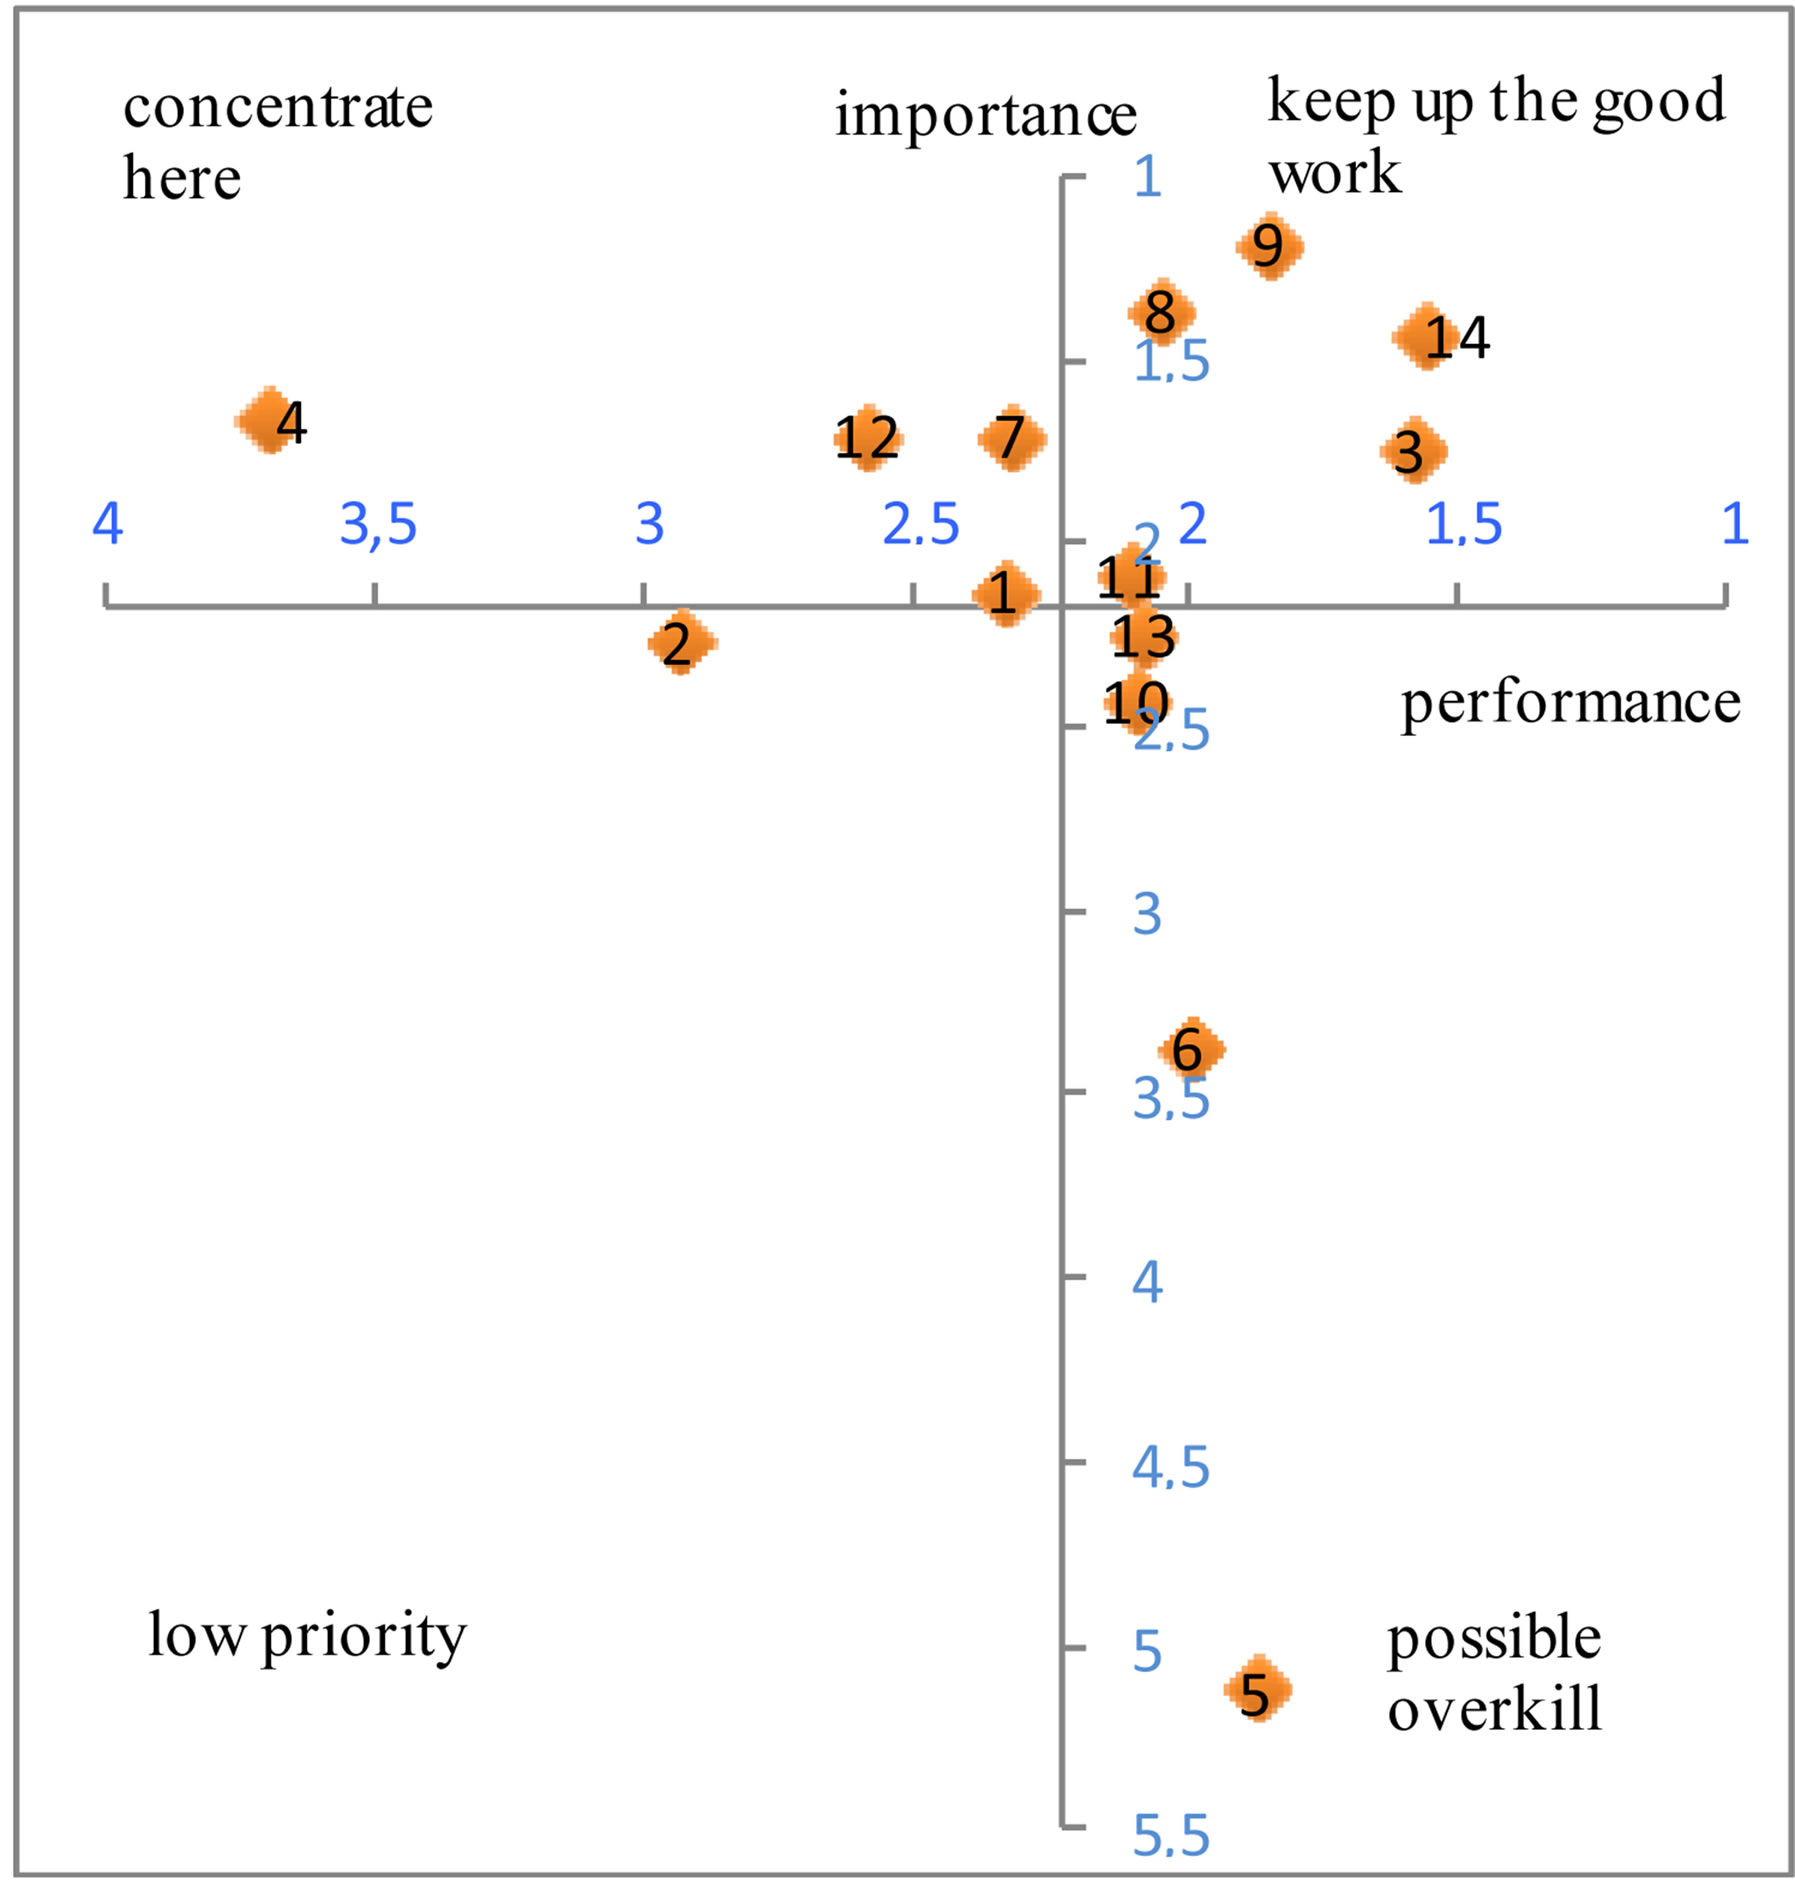
Figure 3. The importance-performance grid for the first study.
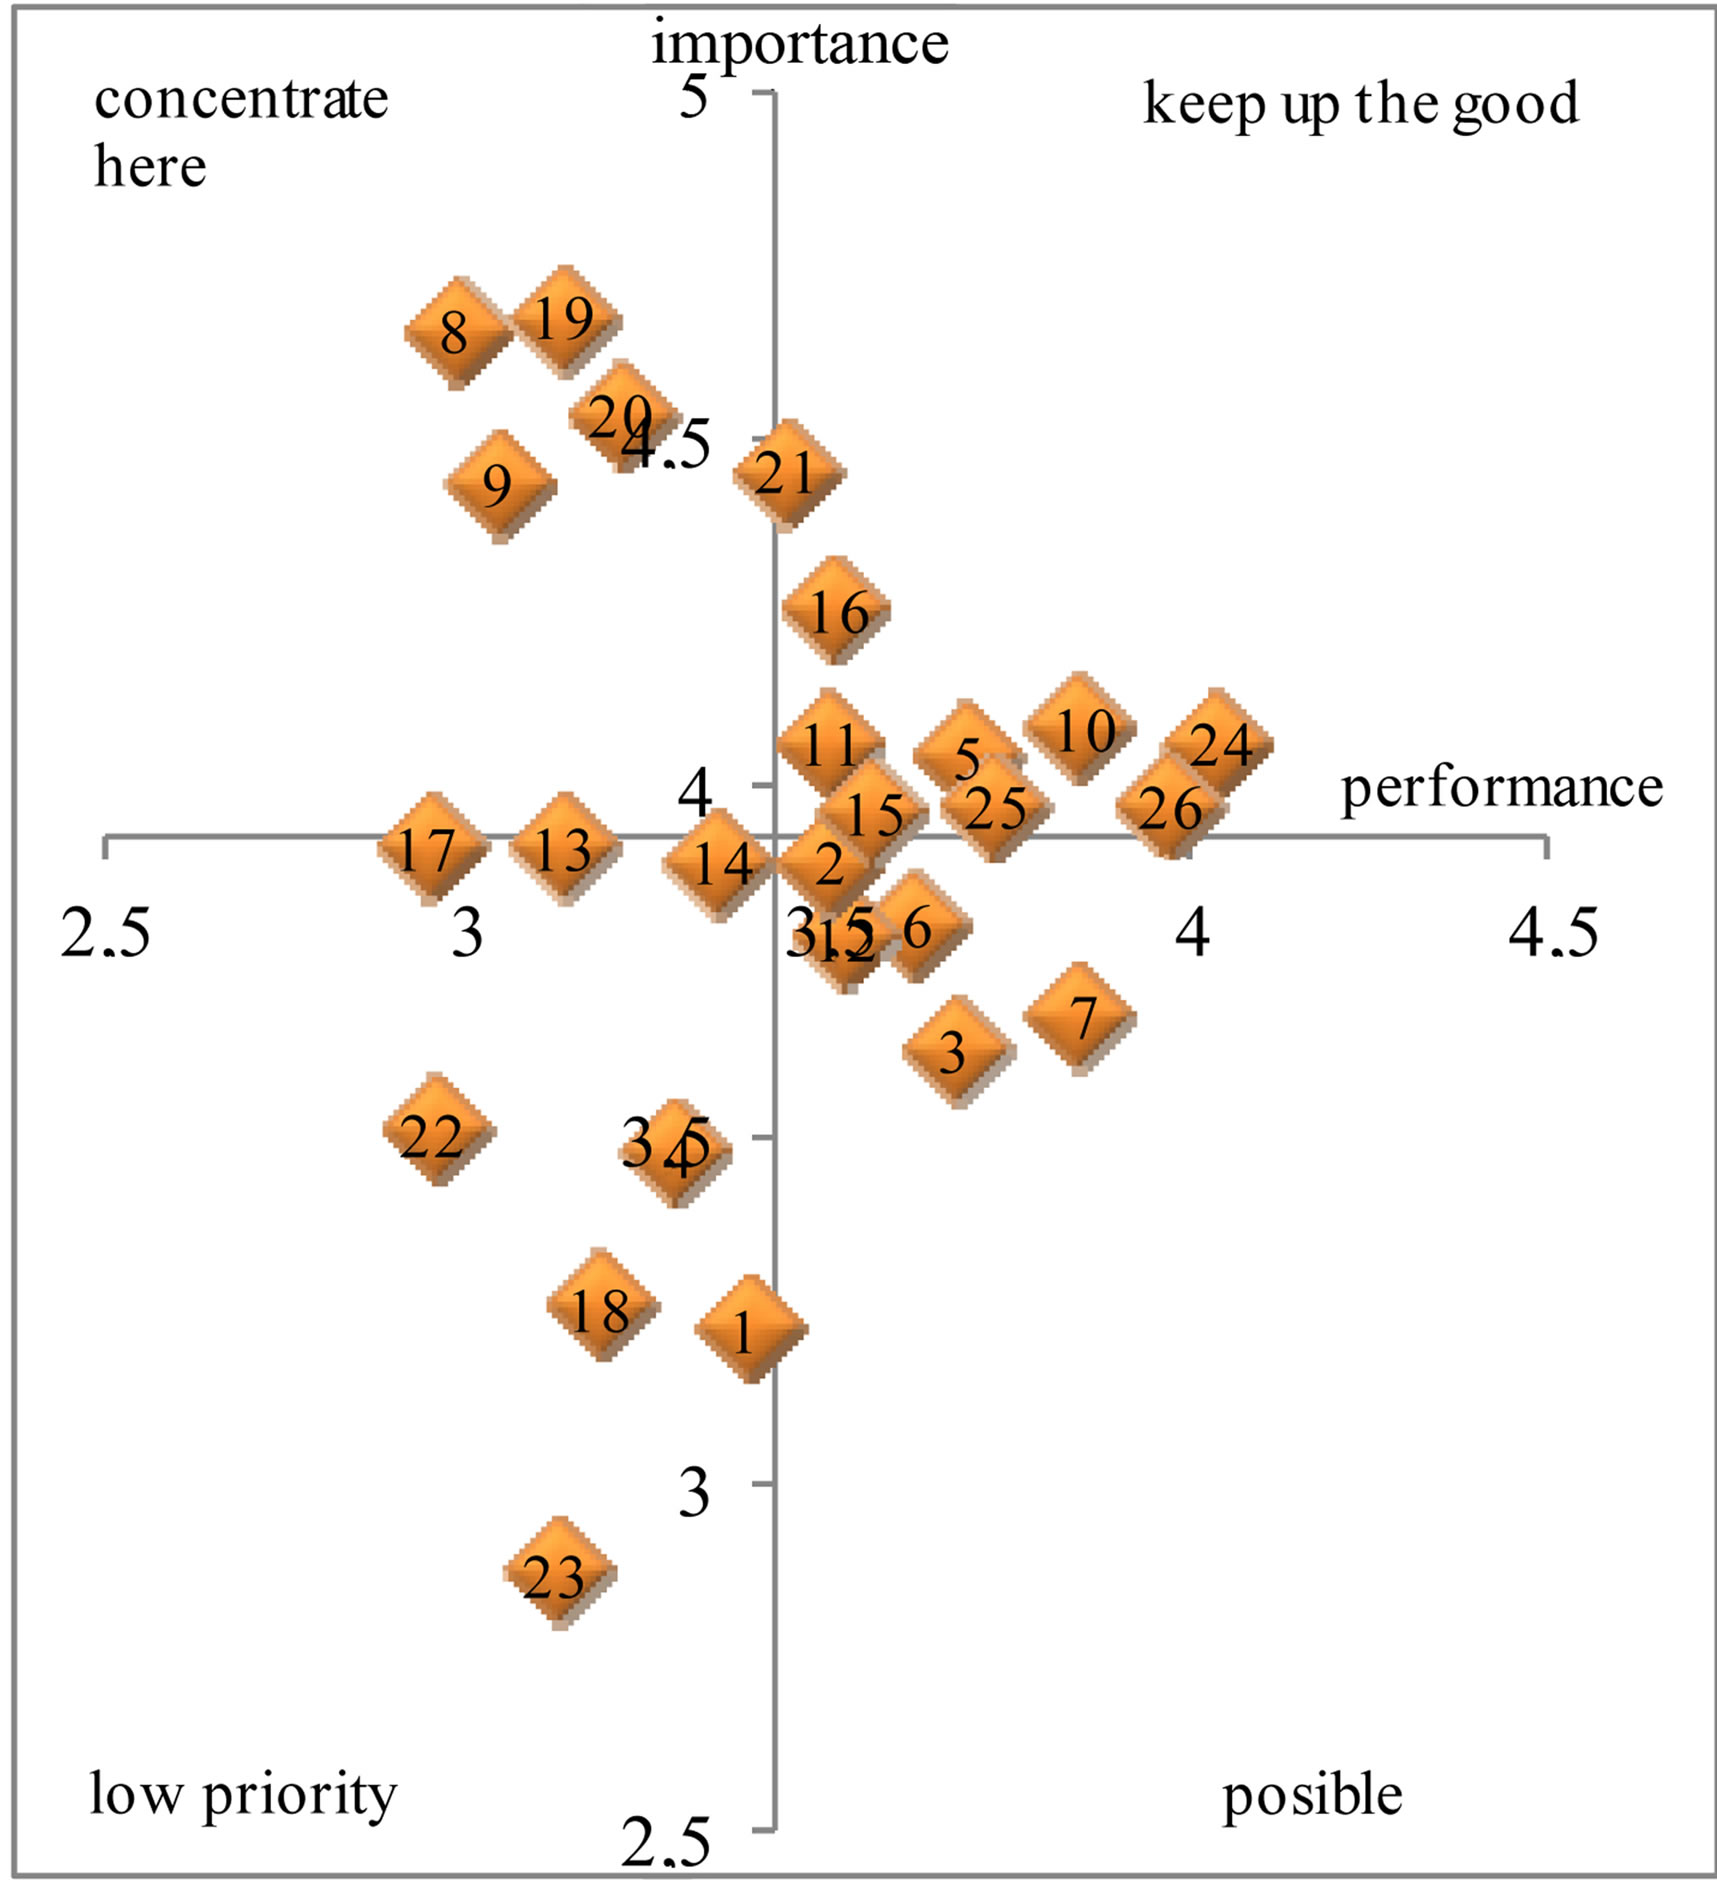
Figure 4. The importance-performance grid for the second study.

Table 3. CIT results for first study.
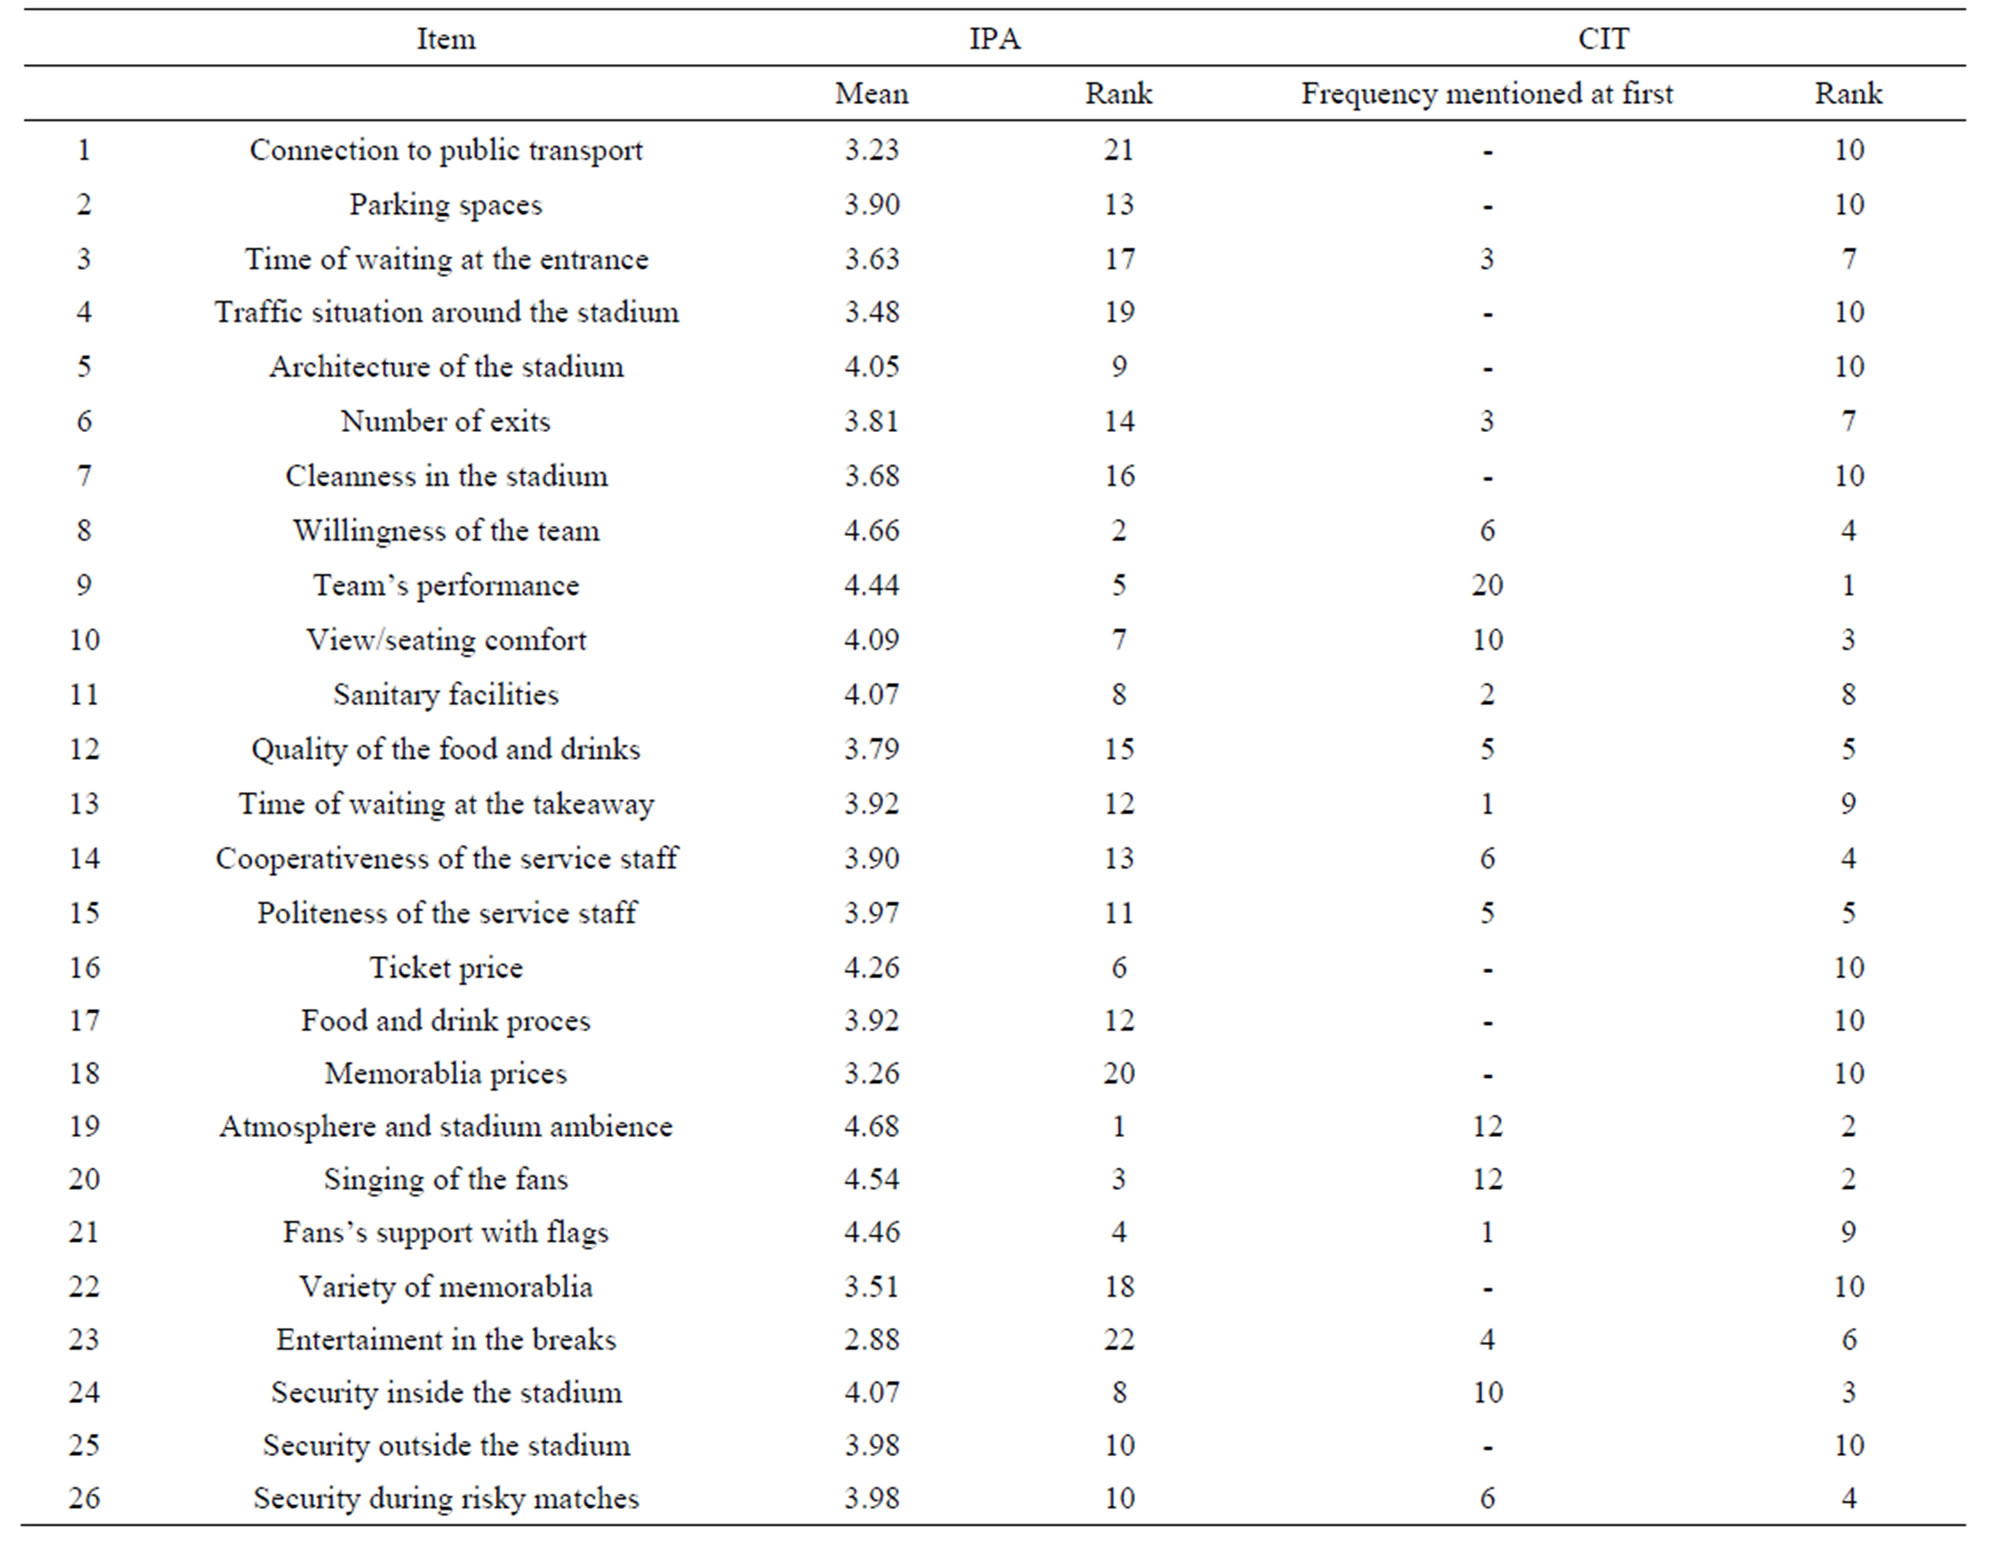
Table 4. Comparison of the IPA and CIT results for the second study.
first study the mean value of the performance ratings is 2.223 and for the y-axis it is 2.168. In the case of the second study the mean value for the x-axis is 3.428 and the point of interaction with the y-axis is 3.929.
The most important area is the concentrate here area, because the items situated here mean that the enterprise fails to meet the customers’ expectations. Because these aspects are quite important for the customer, an intensified effort should be taken to improve the service there. For this reason, policy changes and strategy adaption should get concentrated to these factors [22]. To proof the acuteness of the intervention and to be sure that the priorities of the customers are represented well by the Importance-Performance grid, the results compared with the order and frequency of the critical incidents as can be taken from Table 5. The data has been ordered, taking into consideration their relative ranks to see if they are similar evaluated.
For items 1 and 4 the results of both analyses are similar. There is just a difference of one rank up and down. The item “Attention of the service staff” was ranked as fifth most important aspect in both analyses. Interventions for the improvement of these factors should be paid according to their acuteness within the ranking.
However, there is a difference for item 12. According to the IPA this aspect is the fifth most important attribute and in line with the item 7. In the critical incident analysis it is the second most important aspect. This study was conducted during the start of the winter holiday season in Germany.
A lot of people visited the “saunapark” with their children and therefore, the normally quiet environment was disturbed. In this situation the capacities of the enterprise have been exhausted and the visitors noticed it, which could be the reason for this result.
As consequence the policy of the enterprise should be changed in the holiday seasons. This means that the capacity boundary should be recognized to keep the visitors satisfied.
In Figure 4 the items 8, 9, 19 and 20 are positioned in the concentrate here area and therefore, special attention to these aspects should be paid.
To support the results mathematical too, the spearman rank coefficient was computed with a value of 0.706. This means that there is an obvious relationship between both measurements and supports the hypotheses that the CIT and IPA should be measured simultaneously to underline the results.
In Table 4 the ranks of the importance evaluations have been compared with the results of the critical incidents of the second study in the same way, it was done for the first study.
Items 19 and 20 are similar in the evaluation of both methods. Differences can be seen for the aspects 8 and 9. The “quality of the team’s performance” is the most important one concerning the CIT, but just the fifth most important one according to the Importance-Performance results. The “willingness of the team” is the second most important attribute in the IPA, but just the fourth most important in the CIT. The problem could be the differentiation and interpretation on both factors on the one side for the fans, and on the other side by the researcher. This problem is in line with other results [47]. Despite the differences, the results of the CIT support the items position in the Importance-Performance grid, because independent from the ranking, both analyses filtered the same 5 or 4 most important attributes. That means the management should invest in improvements of these attributes before giving attention to the other ones.
The spearman rank coefficient for this study is 0.517-
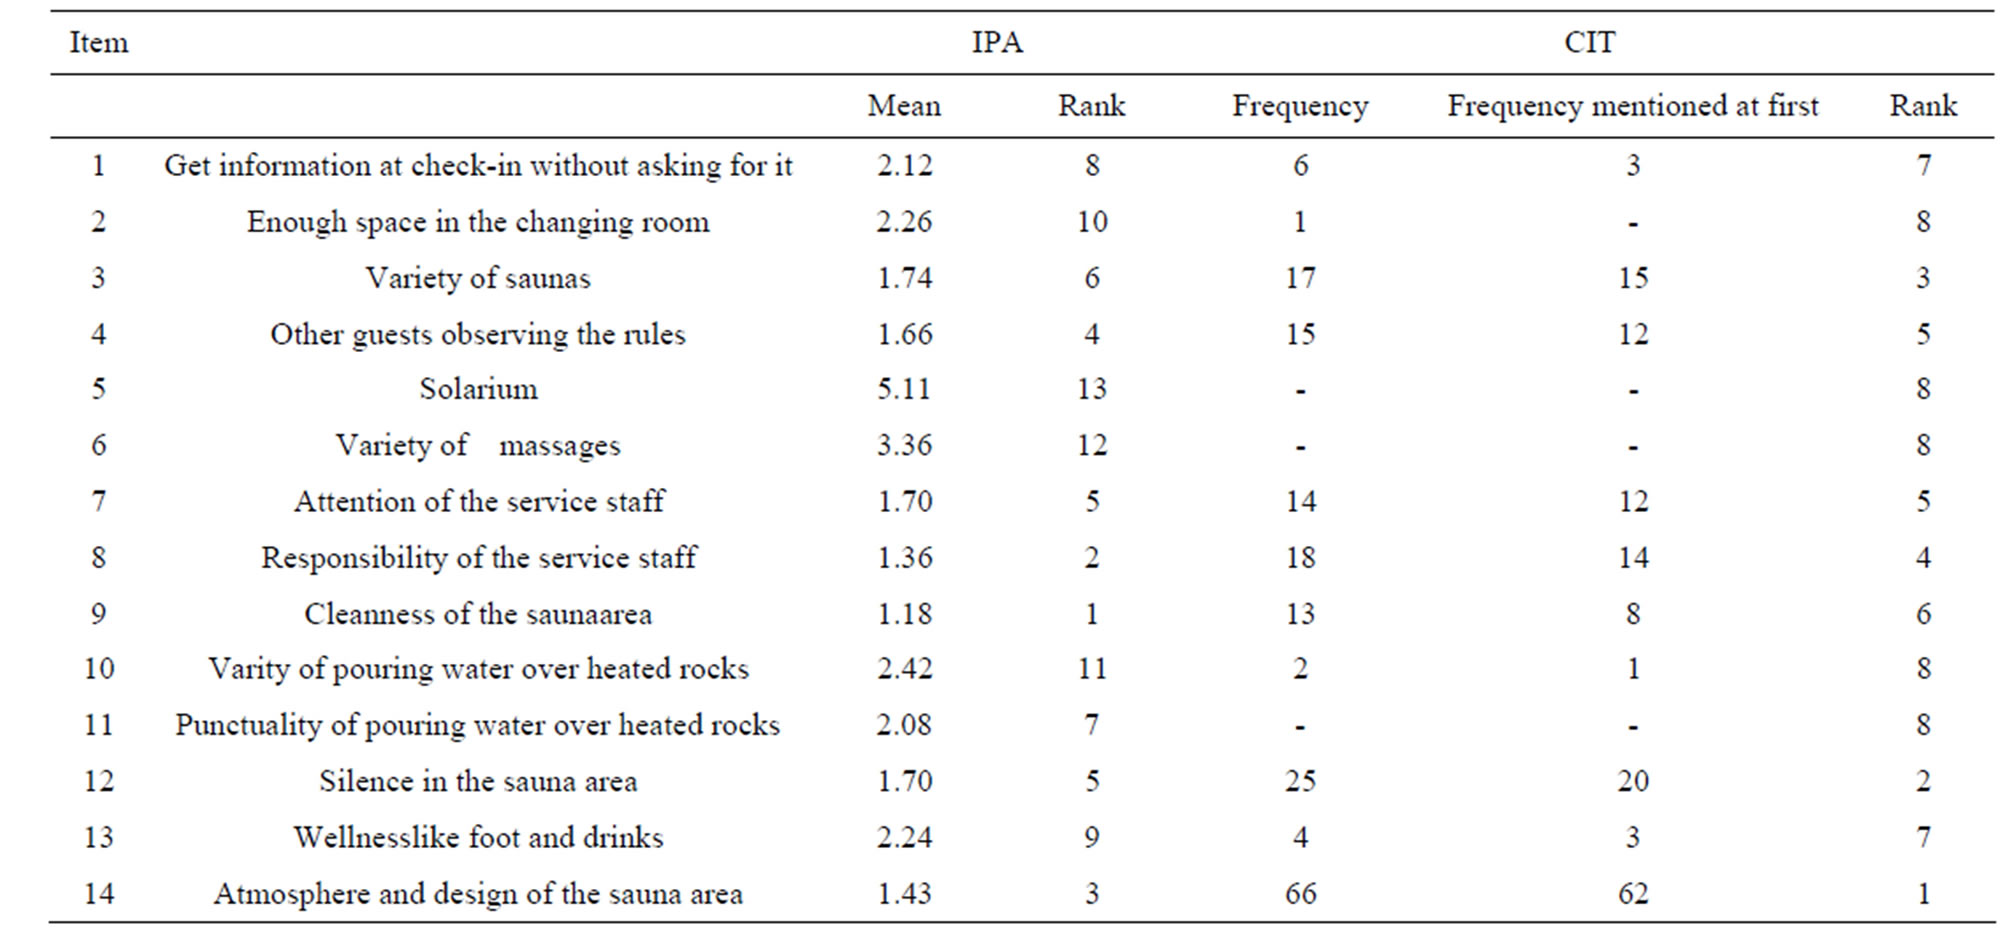
Table 5. Comparison of the IPA and CIT results for the first study.
a value which supports the result as well.
6. Conclusion
As Chrazan and Golovashkina [5] stated, the simple importance and performance rating is easy to handle, especially for the respondent but on the other hand it is inferior when considering its validity. One critical point is that the CIT is quite costly and the usability of the results depends on the respondents’ attendance, as shown in both studies. However, the presented technique proved that the CIT is a good instrument to test the validity of results steamed by an IPA. As presented, for this methodology, it does not matter whether the importance and performance is measured simultaneous or in sequences. Further tests could examine if the results still fit when the alternative grids for the IPA are used. Other methods like the conjoint analysis could be used as test of priorities as well.
REFERENCES
- G. A. Churchill and C. Surprenant, “An Investigation into the Determinants of Customer Satisfaction,” Journal of Marketing Research, Vol. 19, No. 4, 1982, pp. 491-504. http://dx.doi.org/10.2307/3151722
- R. L. Oliver and W. S. DeSarbo, “Response Determinants in Satisfaction Judgments,” Journal of Consumer Research, Vol. 14, No. 4, 1988, pp. 495-507. http://dx.doi.org/10.1086/209131
- S. A. Neslin, “Linking Product Features to Perceptions: Self-Stated versus Statistically Revealed Importance Weights,” Journal of Marketing Research, Vol. 18, No. 1, 1981, pp. 80-86. http://dx.doi.org/10.2307/3151316
- J. Jaccard, D. Brinberg and L. J. Ackerman, “Assessing Attribute Importance: A Comparison of Six Methods,” Journal of Consumer Research, Vol. 12, No. 4, 1986, pp. 463-468. http://dx.doi.org/10.1086/208530
- K. Chrzan and N. Golovashkina, “An Empirical Test of Six Stated Importance Measures,” International Journal of Market Research, Vol. 48, No. 6, 2006, pp. 717-740.
- M. I. Alpert, “Identification of Determinant Attributes: A Comparison of Methods,” Journal of Marketing Research, Vol. 8, No. 2, 1971, pp. 184-191. http://dx.doi.org/10.2307/3149759
- J. H. Myers and M. I. Alpert, “Determinant Buying Attitudes: Meaning and Measurement,” Journal of Marketing, Vol. 32, No. 4, 1968, pp. 13-20. http://dx.doi.org/10.2307/1249332
- J. A. Martilla and J. C. James, “Importance-Performance Analysis,” Journal of Marketing, Vol. 41, No. 1, 1977, pp. 77-79. http://dx.doi.org/10.2307/1250495
- J. Abalo, J. Varela and V. Manzano, “Importance Values for Importance-Performance Analysis: A Formula for Spreading out Values Derived from Preference Rankings,” Journal of Business Research, Vol. 60, No. 2, 2007, pp. 115-121. http://dx.doi.org/10.1016/j.jbusres.2006.10.009
- D. R. Bacon, “A Comparison of Approaches to Importance-Performance Analysis,” International Journal of Market Research, Vol. 45, No. 1, 2003, pp. 55-71.
- C. Lovelock, P.G. Patterson and R. H. Walker, “Services Marketing”, Prentice Hall, Sydney, 1998.
- R. K. S. Chu and T. Choi, “An Importance-Performance Analysis of Hotel Selection Factors in the Hong Kong Hotel Industry: A Comparison of Business and Leisure Travelers,” Tourism Management, Vol. 21, No. 4, 2000, pp. 363-377. http://dx.doi.org/10.1016/S0261-5177(99)00070-9
- J. B. Ford, M. Joseph and B. Joseph, “Importance-Performance Analysis as a Strategic Tool for Service Marketers: The Case of Service Quality Perceptions of Business Students in New Zealand and the USA,” Journal of Services Marketing, Vol. 13, No. 2, 1999, pp. 171-186. http://dx.doi.org/10.1108/08876049910266068
- F. M. Go and W. Zhang, “Applying Importance-Performance Analysis to Beijing as an International Meeting Destination,” Journal of Travel Research, Vol. 35, No. 4, 1997, pp. 42-49.
- M. A. O’Neill and A. Palmer, “Importance-Performance Analysis: A Useful Tool for Directing Continuous Quality Improvement in Higher Education,” Quality Assurance in Education, Vol. 12, No. 1, 2004, pp. 39-52. http://dx.doi.org/10.1108/09684880410517423
- S. Alberty and B. J. Mihalik, “The Use of ImportancePerformance Analysis as an Evaluative Technique in Adult Education,” Evaluation Review, Vol. 13, No. 1, 1989, pp. 33-44. http://dx.doi.org/10.1177/0193841X8901300103
- D. J. Wade and P. F. Eagles, “The Use of ImportancePerformance Analysis and Market Segmentation for Tourism Management in Parks and Protected Areas: An Application to Tanzania’s National Parks,” Journal of Ecotourism, Vol. 2, No. 3, 2003, pp. 196-212. http://dx.doi.org/10.1177/0193841X8901300103
- C. T. Ennew, G. V. Reed and M. R Binks, “ImportancePerformance Analysis and the Measurement of Service Quality,” European Journal of Marketing, Vol. 27, No. 2, 1993, pp. 59-70. http://dx.doi.org/10.1108/03090569310026402
- U. Yavas and D. J. Shemwell, “Modified ImportancePerformance Analysis: An Application to Hospitals,” International Journal of Health Care Quality Assurance, Vol. 14, No. 3, 2001, pp. 104-110. http://dx.doi.org/10.1108/09526860110391568
- A. Gustafsson and M. D. Johnson, “Determining Attribute Importance in a Service Satisfaction Model,” Journal of Service Research, Vol. 7, No. 2, 2004, pp. 124-141. http://dx.doi.org/10.1177/1094670504268453
- R. L. Oliver, “Satisfaction: A Behavioural Perspective on the Consumer,” McGraw Hill, New York, 1997.
- E. Azzopardi and R. Nash, “A Critical Evaluation of Importance-Performance Analysis,” Tourism Management, Vol. 35, 2013, pp. 222-233.
- K. Matzler, F. Bailom, H. H. Hinterhuber, B. Renzl and J. Pichler, “The Asymmetric Relationship between Attribute-Level Performance and Overall Customer Satisfaction: A Reconsideration of the Importance-Performance Analysis,” Industrial Marketing Management, Vol. 33, No. 4, 2004, pp. 271-277. http://dx.doi.org/10.1016/S0019-8501(03)00055-5
- H. Oh, “Revisiting Importance-Performance Analysis,” Tourism Management, Vol. 22, No. 6, 2001, pp. 617-627.
- Van Ittersum, J. M. Pennings, B. Wansink and H. Van Trijp, “The Validity of Attribute-Importance Measurement: A Review,” Journal of Business Research, Vol. 60, No. 11, 2007, pp. 1177-1190. http://dx.doi.org/10.1016/j.jbusres.2007.04.001
- R. J. Fisher, “Social Desirability Bias and the Validity of Indirect Questioning,” Journal of Consumer Research, Vol. 20, No. 2, 1993, pp. 303-315. http://dx.doi.org/10.1086/209351
- M. W. Lowenstein, “Customer Retention: An Integrated Process for Keeping Your Best Customers,” ASQC Quality Press, Milwaukee, 1995.
- H. J. Arnold and D. C. Feldman, “Social Desirability Response Bias in Self-Report Choice Situations,” The Academy of Management Journal, Vol. 24, No. 2, 1981, pp. 377-385. http://dx.doi.org/10.2307/255848
- D. N. Sambonmatsu, F. R. Kardes, D. C. Houghton, E. A. Ho and S. S. Posavac, “Overestimating the Importance of the Given Estimation in Multiattribute Consumer Judgment,” Journal of Consumer Psychology, Vol. 13, No. 3, 2003, pp. 289-300. http://dx.doi.org/10.1207/S15327663JCP1303_10
- H. Oh and S. C. Parks, “Evaluating the Role of Attribute Importance as a Multiplicative Weighting Variable in the Study of Hospitality Consumer Decision-Making,” Journal of Hospitality & Tourism Research, Vol. 21, No. 3, 1998, pp. 61-80. http://dx.doi.org/10.1177/109634809802100305
- P. A. Bottomley, J. R. Doyle and R. H. Green, “Testing the Reliability of Weight Elicitation Methods: Direct Rating versus Point Allocation,” Journal of Marketing Research, Vol. 37, No. 4, 2000, pp. 508-513.
- N. Slack, “The Importance-Performance Matrix as a Determinant of Improvement Priority,” International Journal of Operations & Production Management, Vol. 14, No. 5, 1994, pp. 59-75. http://dx.doi.org/10.1108/01443579410056803
- E. Chell, “Critical Incident Technique,” In: G. Symon and C. Cassell, Eds., Qualitative Methods and Analysis in Organizational Research: A Practical Guide, Sage, London, pp. 51-72.
- L. K. Woolsey, “The Critical Incident Technique: An Innovative Qualitative Method of Research,” Canadian Journal of Counselling, Vol. 20, No. 4, 1986, pp. 242- 254.
- H. Hughes, “Critical Incident Technique,” In: S. Lipu, K. Williamson and A. Lloyd, Eds., Exploring Methods in Information Literacy Research, Wagga Wagga, 2007, pp. 49-66.
- D. D. Gremler, “The Critical Incident Technique in Service Research”, Journal of Service Research, Vol. 7, No. 1, 2004, pp. 65-89. http://dx.doi.org/10.1177/1094670504266138
- J. C. Flanagan, “The Critical Incident Technique,” Psychological Bulletin, Vol. 51, No. 4, 1954, pp. 327-359. http://dx.doi.org/10.1037/h0061470
- M. J. Bitner, B. H. Booms and M. S. Tetreault, “The Service Encounter: Diagnosing Favorable and Unfavorable Incidents,” The Journal of Marketing, Vol. 54, No. 1, 1990, pp. 71-84. http://dx.doi.org/10.2307/1252174
- J. Norman, S. J. Redfern, D. A. Tomalin and S. Oliver, “Developing Flanagan’s Critical Incident Technique to Elicit Indicators of High and Low Quality Nursing Care from Patients and Their Nurses,” Journal of Advanced Nursing, Vol. 17, No. 5, 1992, pp. 590-600. http://dx.doi.org/10.1111/j.1365-2648.1992.tb02837.x
- J. K. Kemppainen, “The Critical Incident Technique and Nursing Care Quality Research,” Journal of Advanced Nursing, Vol. 32, No. 5, 2000, pp. 1264-1271. http://dx.doi.org/10.1046/j.1365-2648.2000.01597.x
- E. Chell and L. Pittaway, “A Study of Entrepreneurship in the Restaurant and Café Industry: Exploratory Work Using the Critical Incident Technique as a Methodology,” International Journal of Hospitality Management, Vol. 17, No. 1, 1998, pp. 23-32. http://dx.doi.org/10.1016/S0278-4319(98)00006-1
- K. Z. Victoroff and S. Hogan, “Students’ Perceptions of Effective Learning Experiences in Dental School: A Qualitative Study Using A Critical Incident Technique,” Journal of Dental Education, Vol. 70, No. 2, 2006, pp. 124-132.
- W. L. Stitt-Gohdes, J. J. Lambrecht and D. H. Redmann, “The Critical-Incident Technique in Job Behavior Research,” Journal of Vocational Education Research, Vol. 25, No. 1, 2000, pp. 63-77. http://dx.doi.org/10.5328/JVER25.1.63
- J. F. Petrick, C. Tonner and C. Quinn, “The Utilization of Critical Incident Technique to Examine Cruise Passengers’ Repurchase Intentions,” Journal of Travel Research, Vol. 44, No. 3, 2006, pp. 273-280. http://dx.doi.org/10.1177/0047287505282944
- R. J. Callan, “The Critical Incident Technique in Hospitality Research: An Illustration from the UK Lodge Sector,” Tourism Management, Vol. 19, No. 1, 1998, pp. 93-98. http://dx.doi.org/10.1016/S0261-5177(97)00078-2
- W. W. Ronan and G. P. Latham, “The Reliability and Validity of the Critical Incident Technique: A Closer Look,” Studies in Personnel Psychology, Vol. 6, No. 1, 1974, pp. 53-64.
- B. Edvardsson, “Service Breakdowns: A Study Of Critical Incidents in an Airline,” International Journal of Service Industry Management, Vol. 3, No. 4, 1992, pp. 17-29. http://dx.doi.org/10.1108/09564239210019450
- B. E. Andersson and S. G. Nilsson, “Studies in the Reliability and Validity of the Critical Incident Technique,” Journal of Applied Psychology, Vol. 48, No. 6, 1964, pp. 398-403. http://dx.doi.org/10.1037/h0042025
- B. Stauss and B. Weinlich, “Process-Oriented Measurement of Service Quality: Applying the Sequential Incident Technique,” European Journal of Marketing, Vol. 31, No. 1, 1997, pp. 33-55. http://dx.doi.org/10.1108/03090569710157025
- S. M. Keaveney, “Customer Switching Behavior in Service Industries: An Exploratory Study,” The Journal of Marketing, Vol. 59, No. 2, 1995, pp. 71-82. http://dx.doi.org/10.2307/1252074
- B. Edvardsson and I. Roos, “Critical Incident Techniques: Towards a Framework for Analysing the Criticality of Critical Incidents,” International Journal of Service Industry Management, Vol. 12, No. 3, 2001, pp. 251-268. http://dx.doi.org/10.1108/EUM0000000005520
- B. Stauss, “Service Problem Deployment: Transformation of Problem Information into Problem Prevention Activities,” International Journal of Service Industry Management, Vol. 4, No. 2, 1993, pp. 41-62. http://dx.doi.org/10.1108/09564239310037927
- B. Stauss and B. Hentschel, “Attribute-Based Versus Incident-Based Measurement of Service Quality: Results of an Empirical Study within the German Car Service Industry,” In: P. Kunst and J. Lemmink, Eds., Quality Management in Service, Van Gorcum, Assen/Maastricht, 1992, pp. 59-78.
- A. Parasuraman, V. A. Zeithaml and L. L. Berry, “SERVQ UAL: A Multiple-Item Scale for Measuring Consumer Perceptions of Service Quality,” Journal of Retailing, Vol. 64, No. 1, 1988, pp. 12-40.
- K. Matzler and E. Sauerwein, “The Factor Structure of Customer Satisfaction: An Empirical Test of the Importance Grid and the Penalty-Reward-Contrast Analysis,” International Journal of Service Industry Management, Vol. 13, No. 4, 2002, pp. 314-332. http://dx.doi.org/10.1108/09564230210445078
- G. L. Shostack, “How to Design A Service,” European Journal of Marketing, Vol. 16, No. 1, 1982, pp. 49-63. http://dx.doi.org/10.1108/EUM0000000004799
- M. J. Bitner, A. L. Ostrom and F. N. Morgan, “Service Blueprinting: A Practical Technique for Service Innovation,” California Management Review, Vol. 50, No. 3, 2008, pp. 66-94. http://dx.doi.org/10.2307/41166446
- M. R. Evans and K. S. Chon, “Formulating and Evaluating Tourism Policy Using Importance-Performance Analysis,” Journal of Hospitality & Tourism Research, Vol. 13, No. 3, 1989, pp. 203-213. http://dx.doi.org/10.1177/109634808901300320
- Y. C. Chen and S. Lin, “Applying Importance-Performance Analysis for Improving Internal Marketing of Hospital Management in Taiwan,” International Business Research, Vol. 6, No. 4, 2013, pp. 45-54. http://dx.doi.org/10.5539/ibr.v6n4p45
- [61] J. E. Swan and C. P. Rao, “The Critical Incident Technique: A Flexible Method for the Identification of Salient Product Attributes,” Journal of the Academy of Marketing Science, Vol. 3, No. 3-4, 1975, pp. 296-308. http://dx.doi.org/10.1007/BF02729290
- [62] H. Q. Zhang and I. Chow, “Application of ImportancePerformance Model in Tour Guides’ Performance: Evidence from Mainland Chinese Outbound Visitors in Hong Kong,” Tourism Management, Vol. 25, No. 1, 2004, pp. 81-91. http://dx.doi.org/10.1016/S0261-5177(03)00064-5
- [63] C. J. Easingwood and D. C. Arnott, “Priorities in Services Marketing,” International Journal of Service Industry Management, Vol. 2, No. 2, 1991, pp. 20-37. http://dx.doi.org/10.1108/09564239110136839
- [64] J. M. Hawes, and C. P. Rao, “Using Importance-Performance Analysis to Develop Health Care Marketing Strategies,” Journal of Health Care Marketing, Vol. 5, No. 4, 1985, pp. 19-25.
- [65] R. T. Gencer, “The Relationship between Team Identification and Service Quality Perceptions in Professional Football,” African Journal of Business Management, Vol. 5. No. 6, 2010, pp. 2140-2150.
- [66] K. A. Hunt, T. Bristol and R. E. Bashaw, “A Conceptual Approach to Classifying Sports Fans,” Journal of Services Marketing, Vol. 13, No. 6, 1999, pp. 439-452. http://dx.doi.org/10.1108/08876049910298720