Journal of Biomedical Science and Engineering
Vol.7 No.11(2014), Article ID:49055,9 pages
DOI:10.4236/jbise.2014.711085
Delineation of Biological Tumor Volume from Positron Emission Tomography Images in Nasopharyngeal Carcinoma
Ka-Wai Wong1*, Dora Lai-Wan Kwong2*, Pek-Lan Khong3, Victor Ho-Fun Lee2, Sherry Chor-Yi Ng4, Martin Wai-Ming Law5
1The Department of Clinical Oncology, Queen Mary Hospital, Hong Kong, China
2The Department of Clinical Oncology, The University of Hong Kong, Hong Kong, China
3The Department of Diagnostic Radiology, The University of Hong Kong, Hong Kong, China
4The Department of Clinical Oncology, Queen Elizabeth Hospital, Hong Kong, China
5The Department of Diagnostic Radiology, Queen Mary Hospital, Hong Kong, China
Email: *garykwwong@yahoo.com, *dlwkwong@hkucc.hku.hk
Copyright © 2014 by authors and Scientific Research Publishing Inc.
This work is licensed under the Creative Commons Attribution International License (CC BY).
http://creativecommons.org/licenses/by/4.0/


Received 22 June 2014; revised 7 August 2014; accepted 22 August 2014
Abstract
Objective: To develop an auto-segmentation method for delineating the biological tumor volume of nasopharyngeal carcinoma from positron emission tomography images. Methods: A phantom consisting of a water tank with fixed background fluorodeoxyglucose [18F-FDG] activity and spheres with diameters ranging from 2.1 to 5 cm with varying activities of FDG were used to simulate tumors of different sizes and FDG uptake. The phantom was scanned with a PET/CT scan at different sphere to background intensity ratios. An optimum fixed percentage threshold (FT) approach and a signal-to-background ratio (SBR) approach were developed to estimate the true size of the spheres from the PET images. Both approaches were further evaluated in patient images for validation. Twenty-two patients with NPC from stage T1 to T4 were included. The PET based biological tumor volumes (BTV) were delineated with both FT (BTVFT) and SBR (BTVSBR) approaches and compared with the gross tumor volume localized from MRI (GTVMR). The mean volumes of BTVFT and BTVSBR were compared and the degree of overlap between GTVMR and both BTVs was evaluated. Paired t-tests were used for statistical analysis. Results: The optimal FT value was 36.5% of maximal intensity, and SBR approach was represented by an inverse linear regression model. The estimated volume of spheres segmented by both approaches shows no significant difference from the true volume of spheres (p > 0.05), but the average absolute errors were smaller from SBR approach than FT approach (p = 0.008). GTVMR was larger than both BTVFT (p = 0.003) and BTVSBR (p < 0.009). The overlapping volume of BTVSBR with GTVMR is significantly larger than with BTVFT (0.52 and 0.42 respectively, p < 0.0005). Conclusions: SBR approach is more feasible than FT approach to localize the BTV of NPC from FDG-PET image, and BTV might help to modify the extent of GTVMR for radiotherapy planning purpose.
Keywords:Segmentation Approach, SBR, Fixed Threshold, NPC, PET

1. Introduction
Intensity-modulated radiotherapy (IMRT) is the state of the art treatment for head and neck cancers. The critical first step to implement IMRT requires an accurate delineation of the gross tumor volume (GTV). Anatomical information from computed tomography (CT) and magnetic resonance imaging (MRI) is widely used for tumour localization. The introduction of 18F-fluorodeoxyglucose (FDG) positron emission tomography (PET) illustrates the biological activity of the tumor. This will add another dimension showing the biological activity within the anatomical extent of infiltration of tumor as defined by computed tomography (CT) and magnetic resonance imaging (MRI). However, the resolution of PET scan is poor and the exact boundaries of the tumor on PET images are difficult to define.
In the past decade, different segmentation methods such as visual interpretation, thresholding methods, variational approaches, and other software-based approaches were developed to localize the biological tumor volume (BTV) from FDG-PET [1] , and many studies had illustrated that the incorporation of this biological information in radiotherapy planning procedure would often lead to a change in the local extent of anatomical based GTV [2] -[6] . However, there is still no consensus on which segmentation method would best localize the primary tumour [1] [7] . Among all, fixed threshold approach and adaptative threshold approach are most commonly applied in most of the tumours in the head and neck region, but as yet, it has not been applied in nasopharyngeal carcinoma (NPC).
In this study, two phantom-based segmentation approaches including the optimum fixed percentage threshold (FT) approach and the signal-to-background ratio (SBR) approach were developed. The accuracy and feasibility of both approaches were evaluated based on the phantom studies and further validated in the patients’ images. Unlike other head and neck cancers, we cannot have actual measurement of the tumor since nasopharyngeal carcinoma is not treated surgically with resection. MRI shows the most accurate anatomical extent of the primary tumor and the gross tumor volume in nasopharynx as delineated on MRI (GTVMR) was used as the standard for comparison. The BTVs as delineated by fixed threshold (BTVFT) and SBR (BTVSBR) were compared with GTVMR for their difference in volumes and degree of overlap in anatomical position.
2. Methods
2.1. Phantom Study
Two in-house produced phantoms (Phantom 1 and Phantom 2), consisting of 2 water tanks with width × length × height = 23 × 20 × 23 cm3, together with 7 difference sizes of glass spheres (5.2, 9.3, 16.0, 23.7, 37.4, 52.6 and 68.1 cm3) with internal diameter ranged from 2.1 cm to 5 cm were developed. Each sphere was made with a single-end opening, and with wall thickness of 2.5 - 3.0 mm. All the spheres were sealed with 18F-FDG solution at an activity concentration of 108 kBq/ml (±5%). They were immersed in the phantom pool which contained 18F-FDG solution at a constant activity of 3.145 kBq/ml (±5%) (Figure 1). The spheres simulated tumor with different sizes and FDG uptake. While the activity of 18F-FDG inside the spheres decayed, PET/CT images were acquired at 9 different sets of sphere to background intensity ratios (33, 24, 16, 12, 8.5, 6, 5, 4 and 2). A combined PET/CT helical mode scanner (Discovery VCT; GE Medical Systems) was used to acquire the images. PET/CT images were reconstructed at 0.625 mm intervals. The reconstructed field of view (FOV) is 35 cm, with 512 × 512 matrix size. The images were transferred to MIMcontouring Advanced—MIMTM 5 (MIM Software Inc.) for analysis.
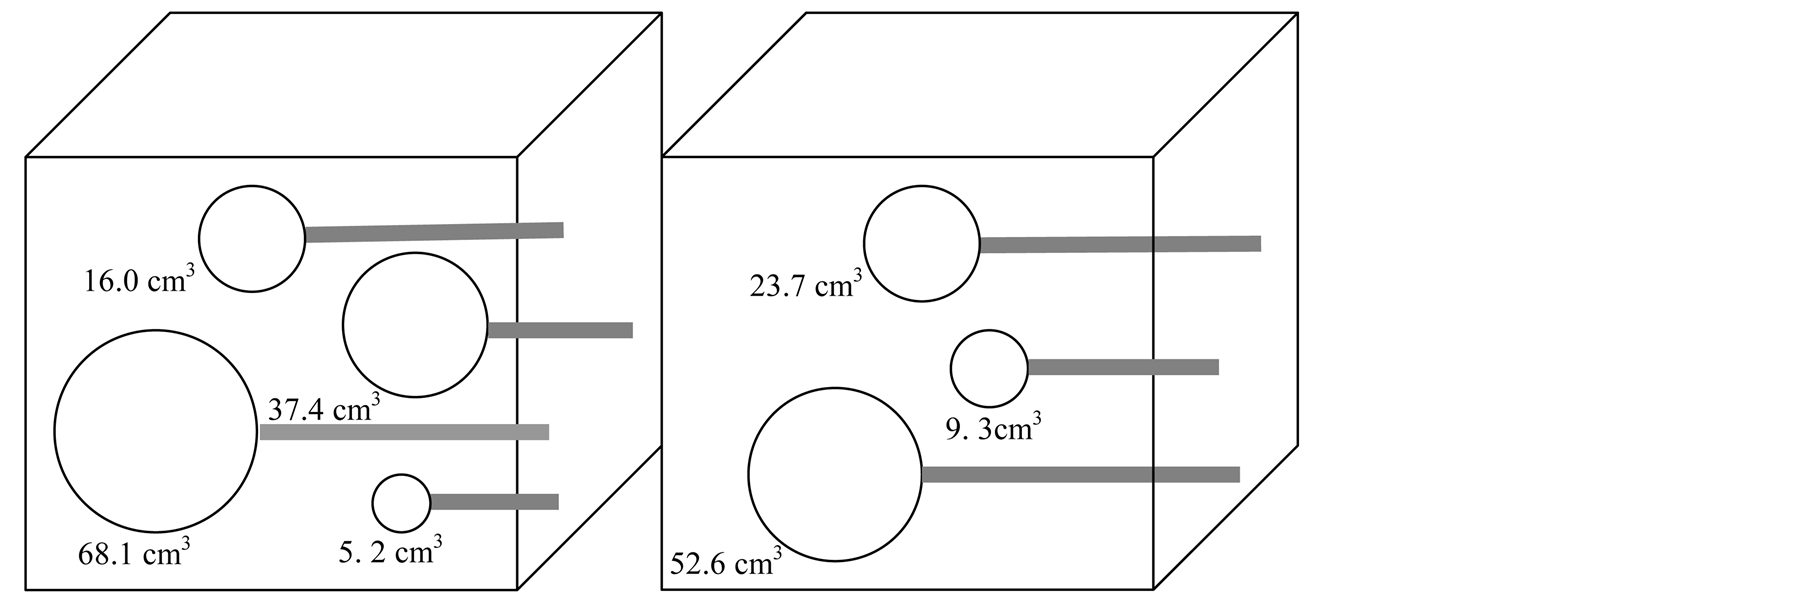
Figure 1. The diagram shows different sizes of glass spheres placed inside phantom 1 & 2. They are positioned with at least 4 cm apart from each other inside the phantom.
2.2. Fixed Threshold Approach
Threshold of 38% maximal standardized uptake value (SUV) was first selected for estimation of the volume of sphere as derived from the PET images. This value was iteratively tested for less than 6 times with step size equal 0.5% until the resultant volume of sphere has the least square difference with the true volume of sphere. The true volume of each sphere was calculated from the volume as outlined from CT images. After all, the measured values from all spheres were averaged to get the optimum fixed percentage threshold value.
2.3. Signal to Background Approach
A varying threshold value which relies on the relationship between the percentage threshold values and the measured sphere to background intensity ratios were derived to aid lesion segmentation. In this model, the percentage threshold value was determined as a percentage of the maximal activity within the spheres located from PET images. The maximum radioactivity of the sphere was the hottest area (16 mm diameter) drawn on the transverse slice of the PET image. The average background activity was measured from the 18F-FGD activity in each set of phantom pool. Four circles with 20 mm diameter were drawn across each slice with 1 cm apart from the sphere, and without overlapping with each other. The average background activity was then collected from a total of 112 circles drawn at each phantom pool. When both the maximum activity and the mean background activity were collected, the intensity ratios for each couple of sphere to background were obtained. The measured SBR and the resultant threshold are fitted by a regression function to yield the best regression parameters for the equation.
After both approaches were developed, they were first used to re-segment the spheres. The estimated volumes derived from both approaches were validated with the true volume of spheres. Paired t-test using SPSS® (version 17.0) was applied for statistical analysis.
2.4. Validation in Patients’ PET Images
After the phantom studies, both approaches were validated with patients’ images. A cohort of 22 nasopharyngeal carcinoma patients, 16 male and 6 female, who had PET/CT and MRI scan performed in treatment position for IMRT planning during 2008-2009 were included. The group included 8 patients each with stage T1 and T3, and 3 patients each with T2 and T4 respectively. All patients had their planning PET/CT, and MRI done not more than one week apart. The scanning parameters for PET/CT were 140 kV, auto mA (150 - 350 mA), with slice interval at 2.5 mm. Reconstructed FOV was 35 cm, with 512 × 512 matrix sizes. For PET scan, the FOV was 70 cm, with 128 × 128 matrix sizes. The slice was reconstructed at 3.25 mm interval. The coverage of both PET and CT scans begins from 1 cm above the vertex to 1/3 of upper thigh. MRI was performed using 3T MRI (Philips Achieva 3.0 system). Images were acquired from vertex to clavicle region. FOV was 50 cm, with 560 × 560 matrix sizes. The slice thickness was reconstructed at 3 mm interval.
Patient’s position during PET/CT and MRI were the same. Each patient was lying on a headrest, and cast was used to immobilize the patient only in PET/CT. All the images were fused manually based on some prominent anatomical position, such as the divergence of basilar artery, lens and dens etc., before radiotherapy planning. In this study, a clinical oncologist was asked to localize the GTVMR without looking at the tumour from the PET/ CT. Meanwhile, the BTVs were outlined by an experienced radiation therapist using the FT and SBR segmentation approaches as derived from the phantom study. The mean volume of GTVMR and both BTVs, BTVFT and BTVSBR, as well as the overlapping and non-overlapping fraction between GTVMR and BTVs were compared as shown in Figure 2. This includes the fraction of GTVMR enclosed within the BTV relative to GTVMR (OFMR), the fraction of BTV enclosed within the GTVMR relative to BTV (OFPET), the fraction of GTVMR excluded outside the BTV relative to GTVMR (1-OFMR), and also the fraction of BTV excluded outside the GTVMR relative to BTV (1-OFPET). Paired t-test and confidence interval was used for statistical analysis.
3. Results
55 out of 63 couples of sphere to background intensity ratio were measured. When the sphere to background intensity ratio was less than 4, the lesions could not be differentiated from its background and the percentage threshold value could not be measured. Thus, 8 measurements could not be obtained and excluded from study. From the FT approach, the trend of the percentage threshold values appeared quite constant (Figure 3) between the spherical volume from 5.2 cm3 to 68.1 cm3 and within the sphere to background intensity ratio from 4 to 33. The threshold values varied from 31.8% to 41.5% (SD = 2.4%) with an average value equal to 36.5% of maximal intensity uptake.
For SBR approach, an inverse function was found between the threshold values and the SBR. The regression model was defined as
 with the regression parameters a = 31.79 and b =
36.54 (R2 = 0.735) best fitted the experimental results (Figure 4). The plots were valid with spherical volume ranges
from 5.2 cm3 to 68.1 cm3, and with the measured sphere to
background intensity ratio from 2.6 to 31.3.
with the regression parameters a = 31.79 and b =
36.54 (R2 = 0.735) best fitted the experimental results (Figure 4). The plots were valid with spherical volume ranges
from 5.2 cm3 to 68.1 cm3, and with the measured sphere to
background intensity ratio from 2.6 to 31.3.
From the phantom’s images analysis, the estimated BTV derived from FT approach (BTVFT) and SBR approach (BTVSBR) were of no significant difference from the true volume of spheres (FT: p = 0.088; SBR: p = 0.714). The true volume of spheres, which are the actual volume contain in each sphere, has less than 1% deviation from the volume as outlined from CT images. However, the absolute differences between the estimated volume and the true volume of spheres derived from SBR approach was significantly less than that derived by FT approach (p = 0.008). A larger absolute error was commonly found in the smallest size (5.2 cm3) of sphere (Figure 5), the difference was 13.3% and 8.5% respectively for FT and SBR approach.
From the patients’ images analysis, 18 out of 22 patients were available for validation. Four patients with stage T1 disease were excluded because both segmentation approaches failed to differentiate the edge of tumour from its background tissues. Their GTVMR ranged from 0.52 cm3 to 5.11 cm3 with an average volume equal to 1.71 cm3. Two patients with T4 disease has the GTVMR 1.4 and 2.5 times greater than the largest size of our

Figure 2. A schematic diagram describing the volume analysis between the overlapping fraction and non-overlapping fraction of GTVMR and BTV.
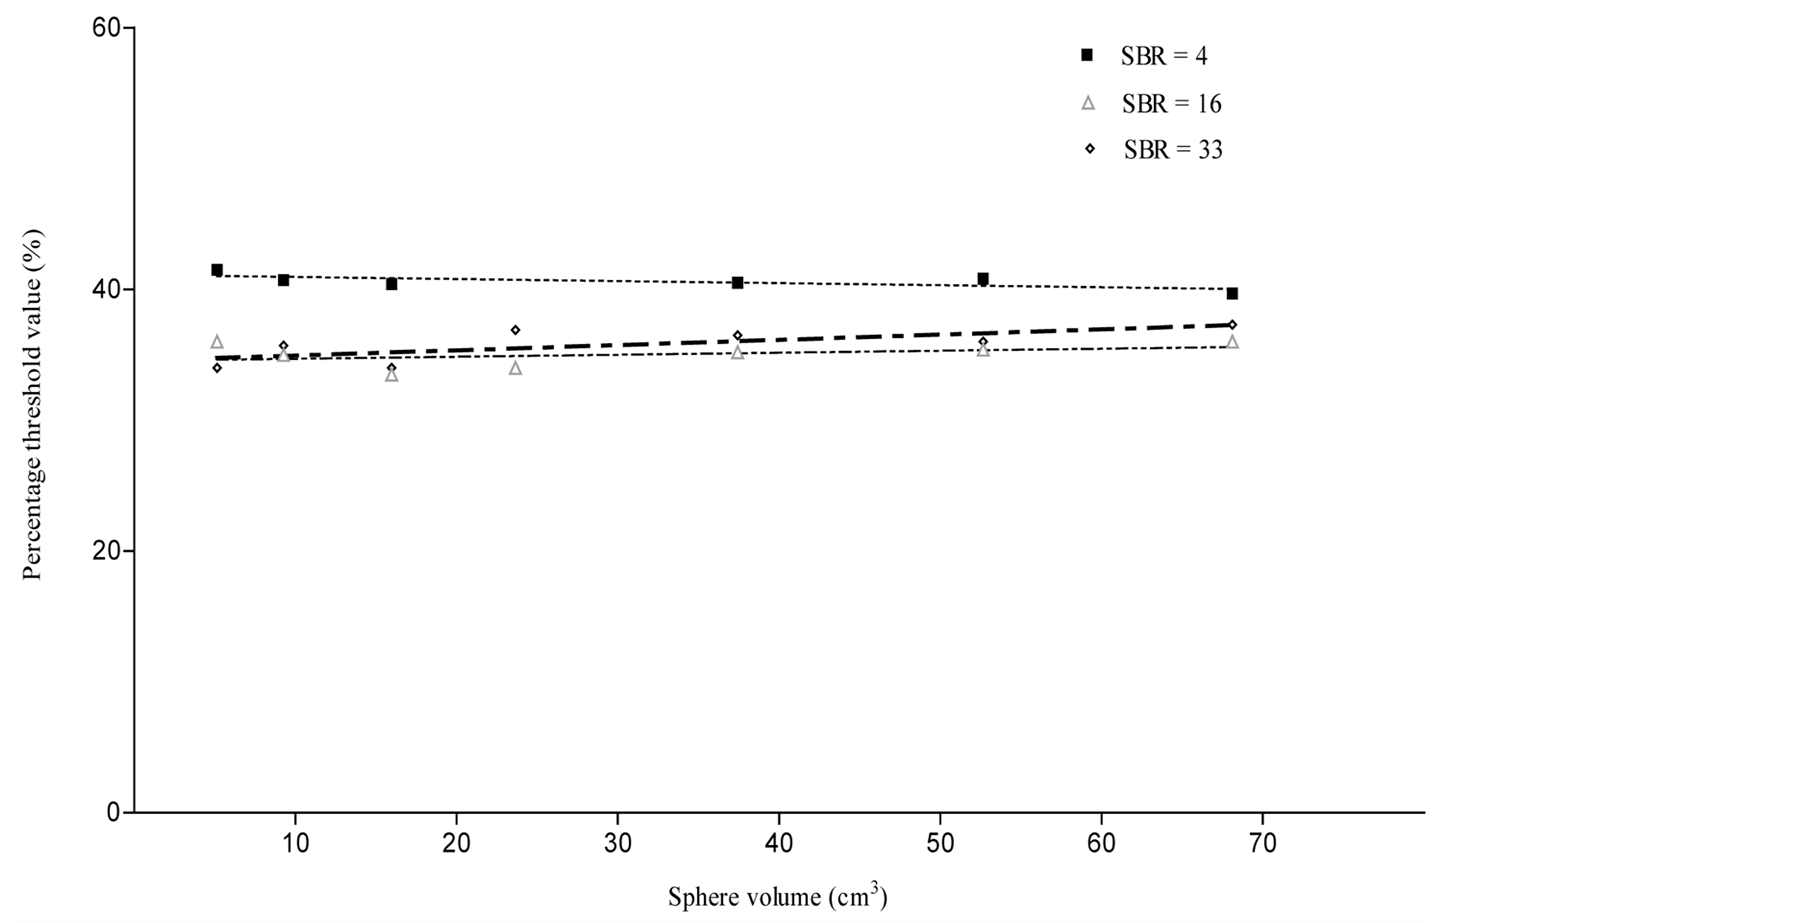
Figure 3. A schematic diagram describing the volume analysis between the overlapping fraction and non-overlapping fraction of GTVMR and BTV.
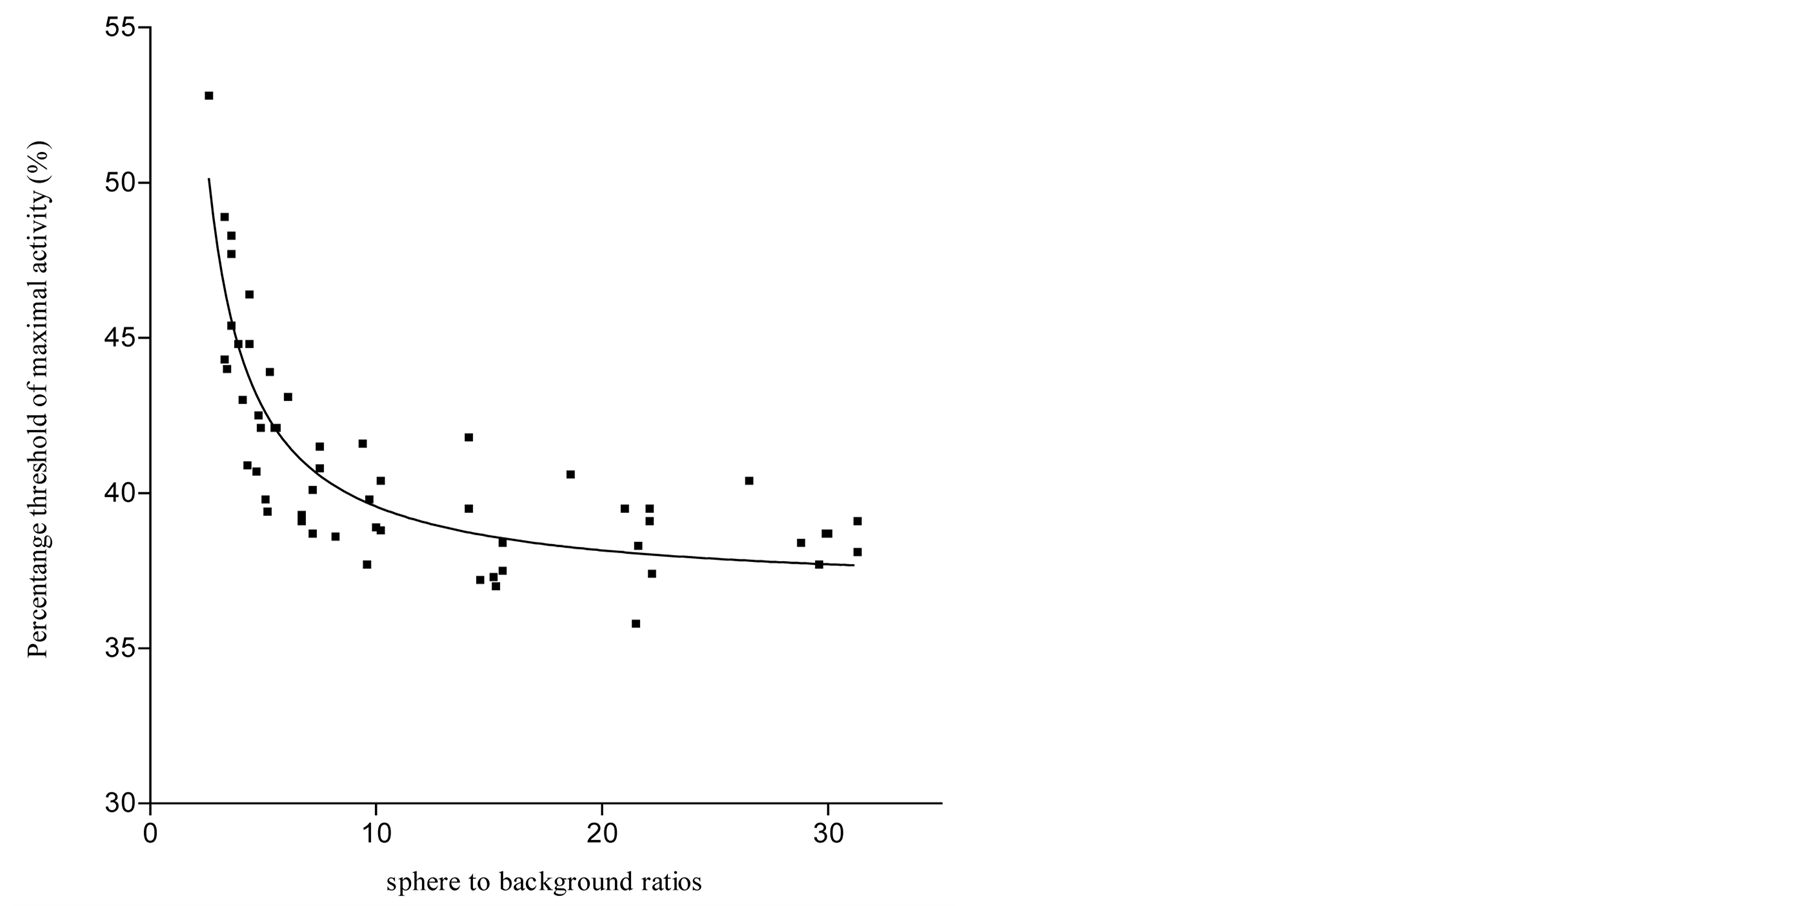
Figure 4. Relationship between the sphere to background ratio and the threshold activity to apply to adequately segment the spheres of volumes ranging from 5.2 to 68.1 cm3.
glass sphere used, however, it was expected that threshold measurement is insensitive to large volume, thus they were also included in the study group. The average volume of GTVMR, BTVFT and BTV SBR were 38.22 cm3, 17.61 cm3, and 21.23 cm3 respectively. GTVMR was significantly larger than BTVFT (p = 0.003) and BTVSBR (p < 0.009). As the average BTVSBR was larger than BTVFT, the average volume of overlapping between GTVMR with BTVSBR was also larger than with BTVFT, they were 18.65 cm3 and 16.1 cm3, respectively (p < 0.0005).
The result of overlap analysis (Table 1) indicated that the percentage of volume overlapping between BTV and GTVMR relative to GTVMR increased significantly when the segmentation approach was changed from FT to SBR, the increment was from 42% to 52% (p = 0.018). Meanwhile, the percentage of BTV overlapping with GTVMR only reduced slightly from 89% to 84%. On the other hand, there were almost half the volume of GTVMR excluded outside the BTV, whereas, there were 11% - 16% of BTV excluded outside GTVMR.

Table 1. A summary of mean overlapping fraction of volume between GTVMR and BTVFT or BTVSBR with 95% confidence interval.
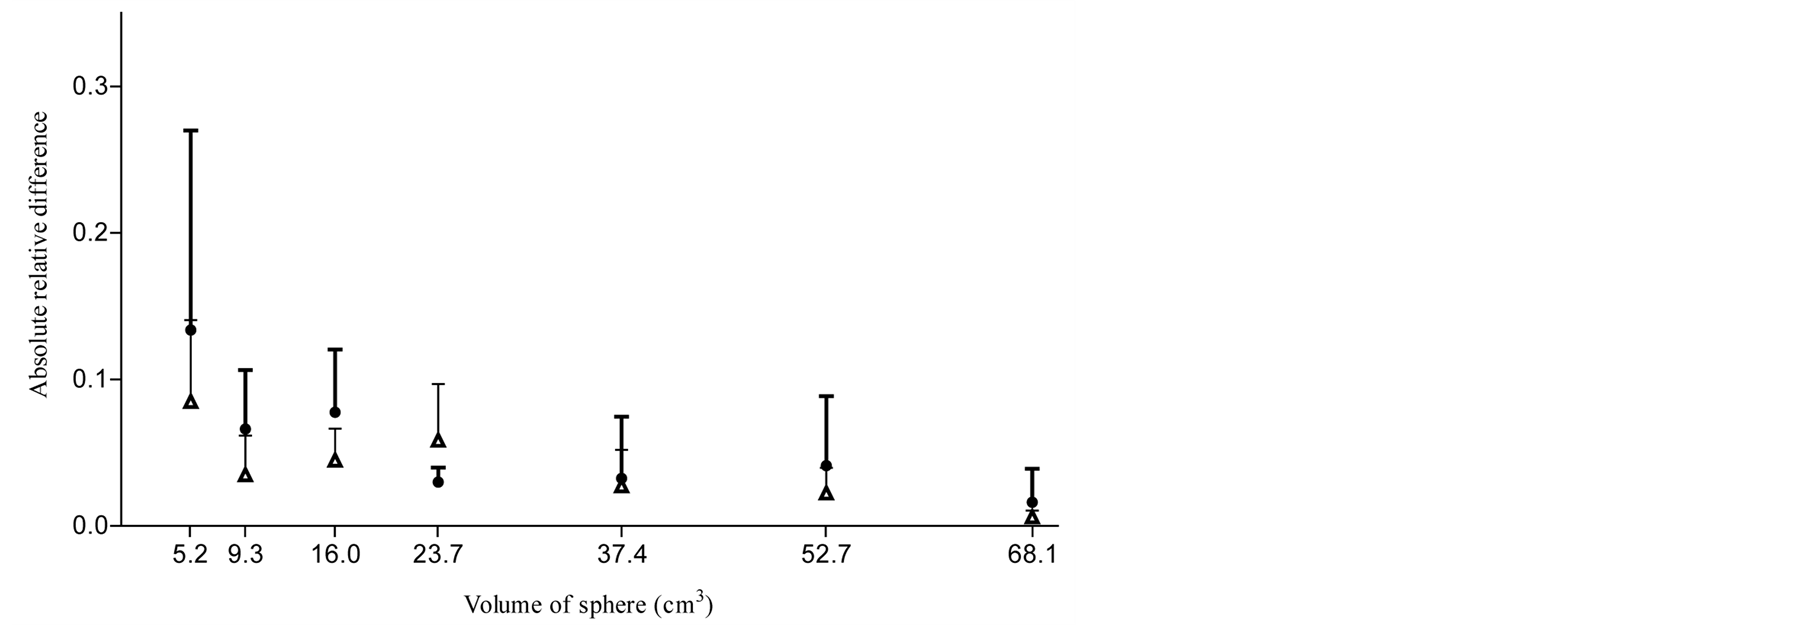
Figure 5. The mean absolute relative difference of the estimated volume of spheres. The above T-bar is for (+) 95% CI. ● by FT approach; ∆ by SBR approach.
4. Discussion
The results of volume analysis on phantom’s images reflected the SBR approach is more accurate than the FT approach. The SBR approach shows a significantly smaller average absolute error in volume estimation (p = 0.008). There is an inverse correlation between the average relative error in volume estimation versus both the size and signal to background intensity ratio. The results were accounted by the limitation of intrinsic spatial resolution of PET, the associated partial volume effect and also edge-blurring effect. Previous studies had indicated that partial volume effect often existed when the lesion was less than 5 cm3 [8] [9] , and the edge blurring effect was dominant when the background contrast level was less than 5 [10] . These errors may account for the failure of lesion segmentation when the sphere to background intensity ratio was below 4.
Previous researchers had stated that fixed threshold approach is easy to apply for delineation, but it should be validated or otherwise it might lead to significant errors in volume estimation [4] [11] [12] . Our study demonstrated that SBR approach is more accurate than a calibrated fixed percentage threshold for lesion segmentation because SBR approach is relatively more flexible to include the FDG avid voxels in the segmentation process. The potential limitation in this phantom study was mainly the use of glass sphere which may affect the threshold findings by shifting of gradient peak towards the interior of the sphere, thus causing the measured threshold values to be underestimated [13] .
From patients’ images study, the mean GTVMR was larger than the mean BTVFT by 2.2 folds and BTVSBR by 1.8 folds. This was consistent with previous findings, in which the CT or MRI based GTV in most of the head and neck tumours were usually larger than the BTV by not more than 2 folds [2] -[5] [14] [15] . Danise et al. (2004) [2] reported that the manually localized GTV was 1.6 times larger than the BTV, but the BTV had the closest tumour size when compared with the standard pathological specimen. The authors concluded that BTV, which segmented by its institutional-based SBR model, was more accurate than anatomical based GTV to reflect the tumour extension of laryngeal cancer. Although pathological specimens of NPC were not available for analysis, our findings using MR detected GTV were similar to findings for other head and neck cancers. The almost double in size of GTVMR over BTV accounted for an average of 58% and 48% of GTVMR excluded from BTVFT and BTVSBR respectively. The difference in tumour extent between GTVMR and BTVFT or BTVSBR was clearly demonstrated in Figure 6 & Figure 7. In Figure 6, there is a tail-like structure of GTVMR outlined on the left side of nasopharynx, but no radioactive glucose uptake was reflected on the same area from the FDG-PET image. In Figure 7, the sphenoid and ethmoid sinus involvement outlined from MRI was obviously more than it was detected from PET/CT image.
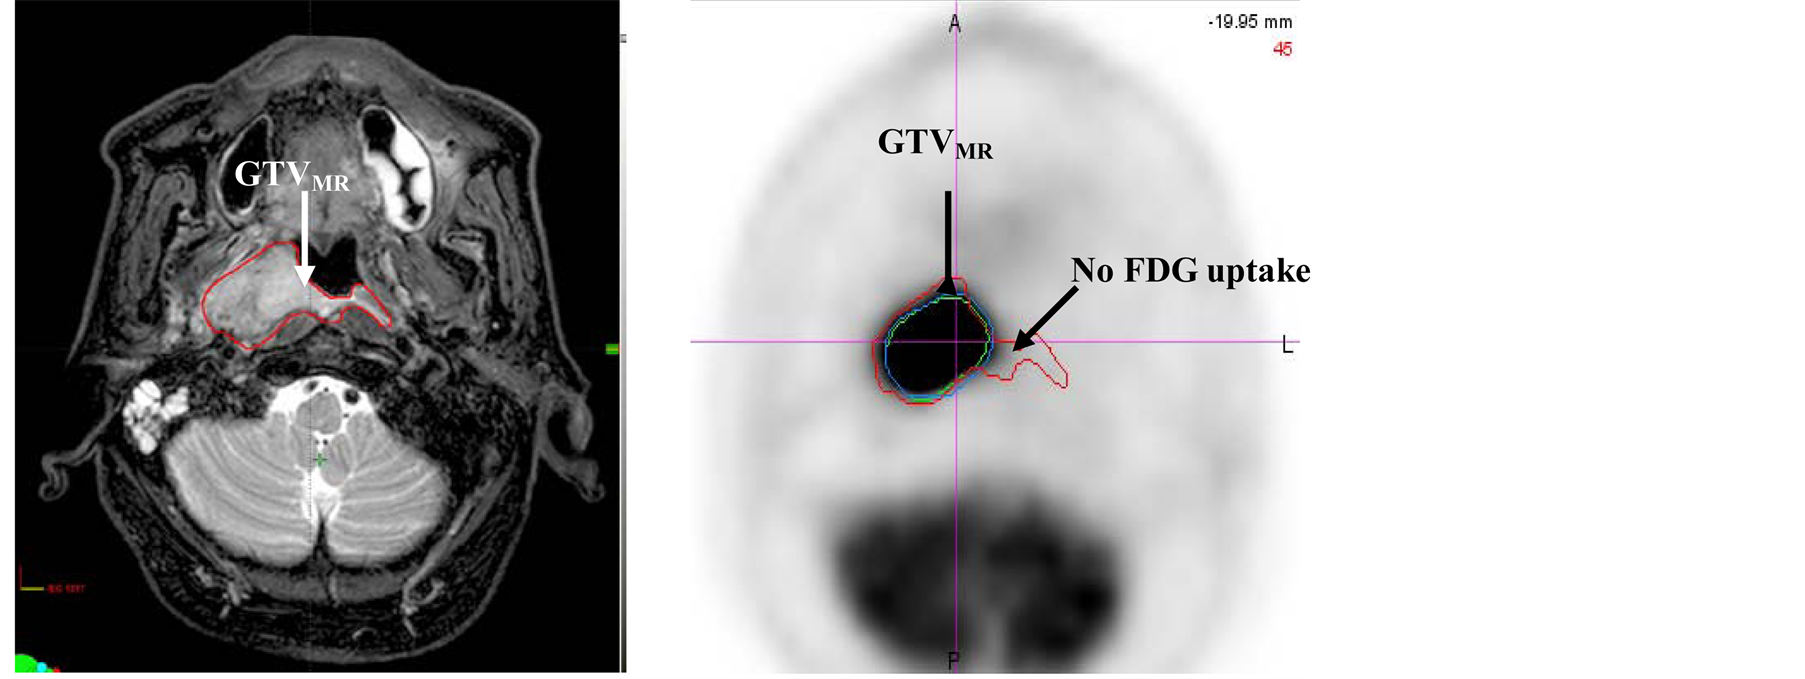
Figure 6. Comparison of GTVMR (red), BTVFT (green) and BTVSBR (blue) for a stage T2 NPC. MRI and PET/CT was first registered, and then MR based GTV (left) was pasted to the fused PET image (right). Part of the GTVMR did not show any FDG uptake with a tail-like structure extended outside the BTVs.
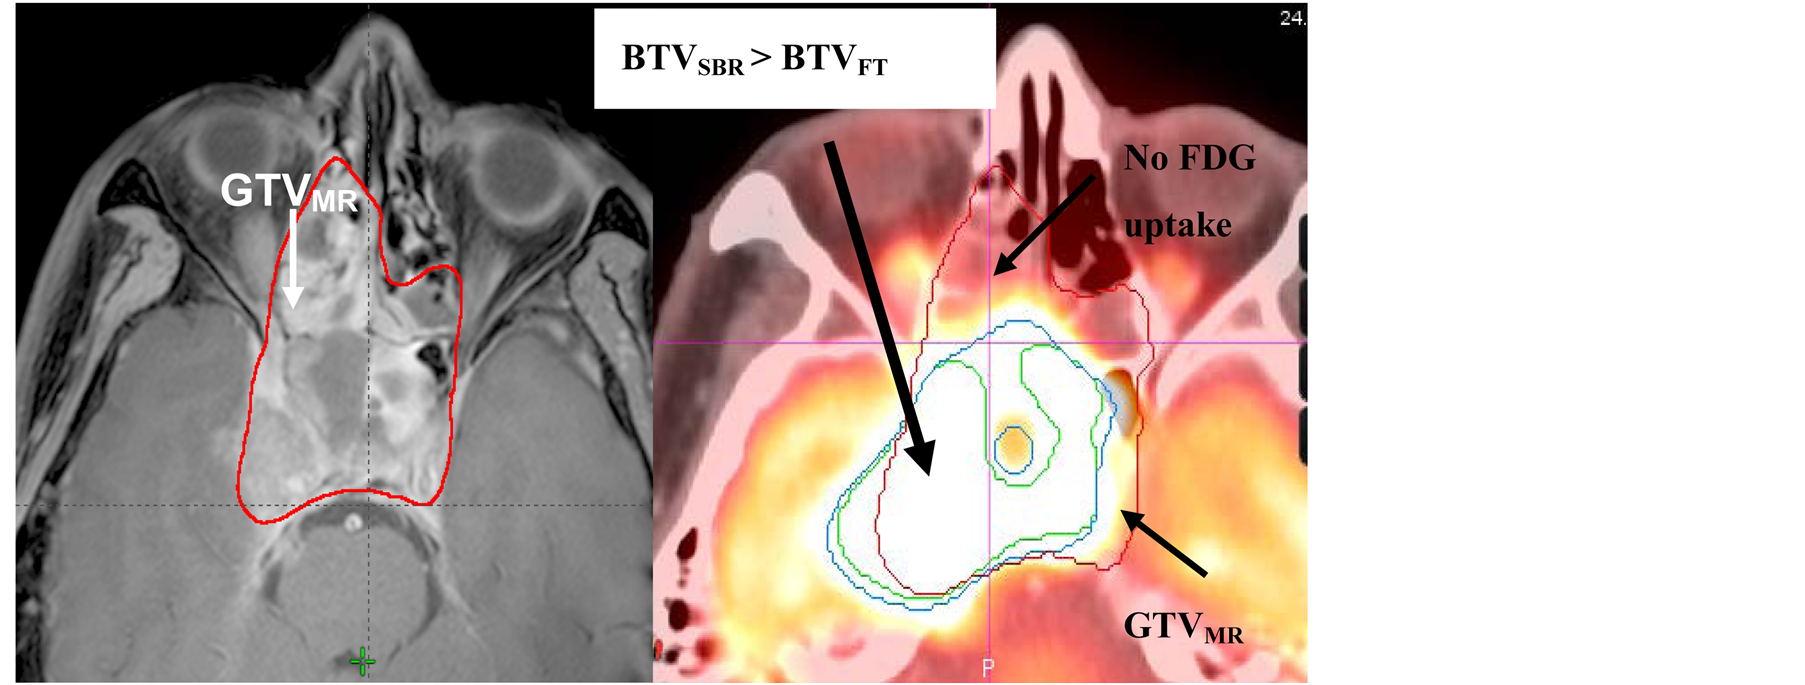
Figure 7. Comparison of GTVMR (red), BTVFT (green) and BTVSBR (blue) for a stage T4 NPC. After MRI was registered with PET/CT, GTVMR was pasted to PET/CT. Manually localized GTVMR may over-estimated the ethmoid sinus involvement, while under-estimated the intracranial involvement on the right side.
On the other hand, our results showed that there was up to an average of 84% BTVSBR and 89% BTVFT mapped within GTVMR, while there were 11% - 16% of BTV excluded outside the GTVMR. This reflected that when the thresholding approaches, particularly the SBR approach, was used to localized BTV from FDG-PET, it does not only have a high concordance with GTVMR, but also detect a significant portion of tumour involvement that might be underestimated from anatomical based information. An example was shown in Figure 7. BTV showed a larger extent of right temporal lobe involvement than it was localized in MRI based GTV. Although, Ng et al. (2009) [12] concluded that PET/CT is less sensitive than MRI to access the local extent of NPC when 50% fixed threshold was used for BTV delineation. Our results suggested that different segmentation approaches would alter the tumour extent from FDG-PET image, and PET/CT has its specificity and sensitivity over MRI to detect the local tumour extent of NPC, provided that an appropriate segmentation approach was applied for the delineation of BTV.
There are 4 out of 8 cases of stage T1 disease excluded in this study. These cases were commonly found to have a poor FDG uptake in the primary lesion but with a relatively higher FDG uptake in the tissues nearby, such as in soft palate, tongue, and pharyngeal constrictor muscle. The measured tumour to background intensity ratio was ranged from 2.7 to 4.5. This low contrast situation limits both the FT and SBR approaches to differentiate the metabolically active tumour cells from their backgrounds, and this phenomenon were also reported in some previous findings [16] -[18] .
While there were no pathological specimen available to correlate with the image findings, it would be difficult to conclude whether GTVMR or BTVSBR could more truly reflect the local tumour extent. It is not sure if the GTVMR that is not included in BTV were due to microscopic extension of tumor with lesser proliferative activity or if the MR changes could be due to tissues inflammation, edema or even observer-based variability. On the other hand, the portion of BTV extending outside GTVMR could be due to infections, inflammation, or physiologically increased uptake in nearby tissue structures such as tonsils, salivary glands and muscles or partial volume effect. These possibilities should be considered on individual basis when interpreting the images. Our findings suggested that the biological information from FDG-PET would help to refine anatomical based GTV, and the change in local tumour extent would consequently lead to a change in radiation beam arrangement or the management approach as well [19] -[21] .
As a whole, SBR approach is more feasible than FT approach to outline BTV of NPC from FDG-PET. However, SBR approach has its own intrinsic limitations. The validation was limited to fixed size of spheres and homogenous activity, it does not take into account the irregular shape of tumour, the heterogeneity of tumour, and also the possibility of overlapping between the tumour and the surrounding normal tissues, thus causing under/over estimating the tumour extent [1] [2] [4] [13] . Secondly, this tool needs to be calibrated to specific institutional image acquisition and reconstruction settings. And last but not the least, it is not ideal for low SBR images [2] [5] [13] . The sample size in this study was small and further study with larger cohort of patients with different T stage of disease would be required for validation of the SBR approach.
5. Conclusion
This study has demonstrated that SBR approach works better than FT approach to delineate BTV of NPC from FDG-PET, and this added on biological information would help to improve the tumour localization by minimizing the chance of over/under estimation of anatomical based GTV in radiotherapy planning procedure.
Acknowledgements
Area of Excellence grant AoE/M-06/08 and General Research Grant HKU 768312M.
References
- Zaidi, H. and El Naqa, I. (2010) PET-Guided Delineation of Radiation Therapy Treatment Volumes: A Survey of Image Segmentation Techniques. European Journal of Nuclear Medicine Molecular Imaging, 37, 2165-2187. http://dx.doi.org/10.1007/s00259-010-1423-3
- Daisne, J.F., Duprez, T., Weynand, B., Lonneux, M., Hamoir, M., Reychler, H., et al. (2004) Tumor Volume in Pharyngolaryngeal Squamous Cell Carcinoma: Comparison at CT, MR Imaging, and FDG PET and Validation with Surgical Specimen1. Radiology, 233, 93-100. http://dx.doi.org/10.1148/radiol.2331030660
- Wang, D., Schultz, C. J., Jursinic, P. A., Bialkowski, M., Zhu, X. R., Brown, W. D., et al. (2006) Initial Experience of FDG-PET/CT Guided IMRT of Head-And-Neck Carcinoma. International Journal of Radiation Oncology*Biology* Physics, 65, 143-151. http://dx.doi.org/10.1016/j.ijrobp.2005.11.048
- Burri, R.J., Rangaswamy, B., Kostakoglu, L., Hoch, B., Genden, E.M., Som, P.M., et al. (2008) Correlation of Positron Emission Tomography Standard Uptake Value and Pathologic Specimen Size in Cancer of the Head and Neck. International Journal of Radiation Oncology*Biology*Physics, 71, 682-688. http://dx.doi.org/10.1016/j.ijrobp.2007.10.055
- Schinagl, D.A.X., Vogel, W.V., Hoffmann, A.L., van Dalen, J.A., Oyen, W.J. and Kaanders, J.H. (2007) Comparison of Five Segmentation Tools for 18F-Fluoro-Deoxy-Glucose-Positron Emission Tomography-Based Target Volume Definition in Head and Neck Cancer. International Journal of Radiation Oncology*Biology*Physics, 69, 1282-1289. http://dx.doi.org/10.1016/j.ijrobp.2007.07.2333
- Greco, C., Nehmeh, S.A., Schoder, H., Gonen, M., Raphael, B., Stambuk, H.E., et al. (2008) Evaluation of Different Methods of 18F-FDG-PET Target Volume Delineation in the Radiotherapy of Head and Neck Cancer. American Journal of Clinical Oncology, 31, 439-445. http://dx.doi.org/10.1097/COC.0b013e318168ef82
- MacManus, M., Nestle, U., Rosenzweig, K.E., Carrio, I., Messa, C., Belohlavek, O., et al. (2009) Use of PET and PET/CT for Radiation Therapy Planning: IAEA Expert Report 2006-2007. Radiotherapy and Oncology, 91, 85-94. http://dx.doi.org/10.1016/j.radonc.2008.11.008
- Ford, E.C., Herman, J., Yorke, E. and Wahl, R.L. (2009) 18F-FDG PET/CT for Image-Guided and Intensity-Modulated Radiotherapy. The Journal of Nuclear Medicine, 50, 1655-1665. http://dx.doi.org/10.2967/jnumed.108.055780
- Soret, M., Bacharach, S.L. and Buvat, I. (2007) Partial-Volume Effect in PET Tumor Imaging. The Journal of Nuclear Medicine, 48, 932-945. http://dx.doi.org/10.2967/jnumed.106.035774
- Daisne, J.F., Sibomana, M., Bol, A., Cosnard, G., Lonneus, M. and Gregoire, V. (2003) Evaluation of a Multimodality Image (CT, MRI and PET) Coregistration Procedure on Phantom and Head and Neck Cancer Patients: Accuracy, Reproducibility and Consistency. Radiotherapy and Oncology, 69, 237-245. http://dx.doi.org/10.1016/j.radonc.2003.10.009
- MacManus, M.P. and Hicks, R.J. (2008) Where Do We Draw the Line? Contouring Tumors on Positron Emission Tomography/Computed Tomography. International Journal of Radiation Oncology*Biology*Physics, 71, 2-4. http://dx.doi.org/10.1016/j.ijrobp.2008.01.019
- Ng, S.H., Chan, S.C., Yen, T.C., Chang, J.T.C., Liao, C.T., Ko, S.F., Liu, F.Y., Chin, S.C., Fan, K.H. and Hsu, C.L. (2009) Staging of Untreated Nasopharyngeal Carcinoma with PET/CT: Comparison with Conventional Imaging Work-Up. European Journal of Nuclear Medicine and Molecular Imaging, 36, 12-22. http://dx.doi.org/10.1007/s00259-008-0918-7
- Geets, X., Lee, J.A., Bol, A., Lonneux, M. and Gregoire, V. (2007) A Gradient-Based Method for Segmenting FDG-PET Images: Methodology and Validation. European Journal of Nuclear Medicine and Molecular Imaging, 34, 1427-1438. http://dx.doi.org/10.1007/s00259-006-0363-4
- Guido, A., Fuccio, L., Rombi, B., Castellucci, P., Cecconi, A., Bunkheila, F., et al. (2009) Combined 18F-FDG-PET/CT Imaging in Radiotherapy Target Delineation for Head-and-Neck Cancer. International Journal of Radiation Oncology*Biology*Physics, 73, 759-763. http://dx.doi.org/10.1016/j.ijrobp.2008.04.059
- Hung, G.U., Wu, I.S., Lee, H.S., You, W.C., Chen, H.C. and Chen, M.K. (2011) Primary Tumour Volume Measured by FDG PET and CT in Nasopharyngeal Carcinoma. Clinical Nuclear Medicine, 36, 447-451. http://dx.doi.org/10.1097/RLU.0b013e31821738b8
- Schoder, H., Yeung, H.W.D., Gonen, M., Kraus, D. and Larson, S.M. (2004) Head and Neck Cancer: Clinical Usefulness and Accuracy of PET/CT Image Fusion1. Radiology, 231, 65-72. http://dx.doi.org/10.1148/radiol.2311030271
- Luke, B. and Graham, M.M. (2007) Positron Emission Tomography-Computerized Tomography in the Management of Head and Neck Cancer. Imaging Decisions MRI, 11, 11-23. http://dx.doi.org/10.1111/j.1617-0830.2007.00096.x
- Hwang, A.B., Bacharach, S.L., Yom, S.S., Weinberg, V.K., Quivey, J.M., Franc, B.L. and Xia, P. (2009) Can Positron Emission Tomography (PET) or PET/Computed Tomography (CT) Acquired in a Nontreatment Position Be Accurately Registered to a Head-and-Neck Radiotherapy Planning CT? International Journal of Radiation Oncology*Biology* Physics, 73, 578-584.
- Vees, H., Casanova, N., Zilli, H., Ratib, O., Popowski, Y., Wang, H., Zaidi, H. and Miralbell, R. (2012) Impact of 18F-FDG PET/CT on Target Volume Delineation in Recurrent or Residual Gynaecologic Carcinoma. Radiation Oncology, 7, 176. http://dx.doi.org/10.1186/1748-717X-7-176
- Niyazi, M., Landrock, S., Elsner, A., Manapov, F., Hacker, M., Belka, C. and Ganswindt, U. (2013) Automated Biological Target Volume Delineation for Radiotherapy Treatment Planning Using FDG-PET/CT. Radiation Oncology, 8, 180. http://dx.doi.org/10.1186/1748-717X-8-180
- Nishioka, T., Shiga, T., Shirato, H., Tsukamoto, E., Tsuchiya, K., Kato, T., et al. (2002) Image Fusion between 18FDG-PET and MRI/CT for Radiotherapy Planning of Oropharyngeal and Nasopharyngeal Carcinomas. International Journal of Radiation Oncology*Biology*Physics, 53, 1051-1057. http://dx.doi.org/10.1016/S0360-3016(02)02854-7
NOTES

*Corresponding authors.