Journal of Biomedical Science and Engineering
Vol.6 No.7A2(2013), Article ID:34816,13 pages DOI:10.4236/jbise.2013.67A2001
Local wavelet-based filtering of electromyographic signals to eliminate the electrocardiographic-induced artifacts in patients with spinal cord injury
![]()
1BioImaging Laboratory, Bioengineering Department, University of Louisville, Louisville, USA
2Department of Neurological Surgery, University of Louisville, Louisville, USA
3Frazier Rehab Institute, Louisville, USA
4Department of Computer Science, The University of Auckland, Auckland, New Zealand
Email: mjnitz02@louisville.edu, n0baja01@louisville.edu, sevda.aslan@kentuckyonehealth.org, g.gimelfarb@auckland.ac.nz, #aselba01@louisville.edu, alexander.ovechkin@kentuckyonehealth.org
Copyright © 2013 Matthew Nitzken et al. This is an open access article distributed under the Creative Commons Attribution License, which permits unrestricted use, distribution, and reproduction in any medium, provided the original work is properly cited.
Received 19 April 2013; revised 20 May 2013; accepted 10 June 2013
Keywords: EMG; De-Noising; ECG; Local Wavelet Filtering
ABSTRACT
Surface Electromyography (EMG) is a standard method used in clinical practice and research to assess motor function in order to help with the diagnosis of neuromuscular pathology in human and animal models. EMG recorded from trunk muscles involved in the activity of breathing can be used as a direct measure of respiratory motor function in patients with spinal cord injury (SCI) or other disorders associated with motor control deficits. However, EMG potentials recorded from these muscles are often contaminated with heart-induced electrocardiographic (ECG) signals. Elimination of these artifacts plays a critical role in the precise measure of the respiratory muscle electrical activity. This study was undertaken to find an optimal approach to eliminate the ECG artifacts from EMG recordings. Conventional global filtering can be used to decrease the ECG-induced artifact. However, this method can alter the EMG signal and changes physiologically relevant information. We hypothesize that, unlike global filtering, localized removal of ECG artifacts will not change the original EMG signals. We develop an approach to remove the ECG artifacts without altering the amplitude and frequency components of the EMG signal by using an externally recorded ECG signal as a mask to locate areas of the ECG spikes within EMG data. These segments containing ECG spikes were decomposed into 128 sub-wavelets by a custom-scaled Morlet Wavelet Transform. The ECG-related subwavelets at the ECG spike location were removed and a de-noised EMG signal was reconstructed. Validity of the proposed method was proven using mathematical simulated synthetic signals and EMG obtained from SCI patients. We compare the Rootmean Square Error and the Relative Change in Variance between this method, global, notch and adaptive filters. The results show that the localized wavelet-based filtering has the benefit of not introducing error in the native EMG signal and accurately removing ECG artifacts from EMG signals.
1. INTRODUCTION
Approximately 12,000 new cases of Spinal Cord Injury (SCI) are reported each year in the United States [1]. SCI is a severe condition, in which the neural elements of a spinal cord are injured, resulting in a muscular dysfunction and/or paralysis below the injury site [2]. Currently, the primary method for evaluation of the motor function and post-injury assessment for SCI recovery of voluntary capability is the American Spinal Injury Association Impairment Scale (AIS) [3]. However, this approach is subjective and insensitive to detect small muscular activities. Muscle activity can be detected and analyzed using electromyography (EMG) which records the electrical potentials from muscles. Quantification of the amount of EMG activity [4,5], presumes a high degree of accuracy in recorded EMG signals. However, EMG recorded from trunk muscles, or muscles in close proximity to the heart, may be contaminated with spikes caused by electrical signals from the heart known as an Electrocardiographic (ECG) activity. This noise can significantly affects the EMG signals and makes their analysis and quantification non-reliable.
In spite of numerous attempts to eliminate or reduce ECG artifacts, the problem of accurate and effective denoising of EMG still remains a challenge. Gating [6], or a brute-force removal of areas within an EMG signal where ECG spikes are visually found is a commonly used de-noising technique. Drake and Callagan [7] used it, together with a high-pass Butterworth filter, to subtract the raw ECG from the EMG. However, the partial removal of critical portions of the EMG signal within the gate along with ECG spikes. This results in additional noise being added to the signal and tends to remove the low-frequency components of EMG. This is especially problematic in areas where active muscular contraction is being recorded and ECG interference is present within the recorded EMG [8-11].
Alternatively, the ECG can be simultaneously recorded with the EMG by using a separate lead configuration. The separate raw ECG is then either directly subtracted from the corrupted EMG [12], or used indirectly as a reference for advanced filtering and subtraction [5,13-16]. Unfortunately, in most cases, ECG-caused noise, differs in shape and amplitude from the raw EMG because the ECG-EMG interference depends on the location of the muscles and their position with respect to the heart. Also, the baseline of the recorded ECG serves as an additional source of noise.
An advanced statistical vectorial decomposition, namely, the Independent Component Analysis (ICA) [17], has been applied by Costa et al. [18] to extract the ECG components from the EMG signal at different orientations. However, due to complex overlaps with the surrounding EMG, a precise extraction is not feasible and the EMG signal changes considerably its envelope after this global filtering. Carre and Leman [19] proposed to separate a noise-corrupted signal into a set of components obtained with undecimated wavelet transforms. An EMG Electrohystogram (EHG) was decomposed, using the Discrete Wavelet Transform (DWT) by Daubechies [20], into individual rough and detailed components. Then the latter were filtered by assuming that the ECGinduced corruption can be accurately modeled by Gaussian noise. However, in typical clinical applications this assumption is invalid, especially so in locations where the ECG baseline is not flat and the ECG spikes do not have distinct characteristics of Gaussian noise. Similar to other techniques, this approach either over-filters the EMG signal, or fails to completely remove the ECG noise. Multi-resolution analysis (MRA) by Mallat and Zhou [21,22] uses similar Daubechies wavelets for separating a noisy signal into components to de-noise the high-frequency ones by independent filtering.
Taelman et al. [23] and von Tscharner et al. [24] applied the ICA to wavelets produced by the standard DWT in order to find and remove first the wavelets responsible for the ECG noise and reconstruct then the de-noised EMG. While signal degradation is small due to targeting specific wavelets, the noiseless sections of the signal are still impacted, just as in other purely global techniques of wavelet removal. Due to the fact that true EMG data is often mixed with the ECG noise when a small number of wavelets are used in a standard DWT, it is difficult to remove wavelets that contain only noise.
Overall, in many cases the known techniques apply a form of global filtering to the noisy EMG, thus affecting parts of the signal envelope that do not actually contain ECG noise. Alternative template removal techniques assume that the ECG noise is of the same shape and structure as the separately recorded raw ECG. Unfortunately, in many clinical applications of ECG noise removal, this general assumption is not valid. We propose a technique to remove ECG noise spikes from an EMG by the use of local wavelet filtering. Simultaneously recorded raw EMG and raw ECG signals are combined to determine exact sample locations of ECG noise within an EMG signal. Then the corrupted EMG signal is filtered locally by using a 128-component Morlet Wavelet Transform to remove wavelets that correlate with the ECG noise. This wavelet filtering is localized around the ECG noise to avoid removal of critical signals and to reduce the introduction of additional noise from filtering.
2. BASIC PROCESSING STEPS
Our local filtering removes the ECG noise from the recorded EMG signals in four steps: 1) automated detection of the ECG noise in the EMG; 2) alignment and synchronization of the raw ECG data with the ECG noise, being present in the EMG; 3) analysis and removal of the wavelets, which are present in the EMG and make up the ECG noise; and 4) local filtering and removal of the ECG noise from the EMG signal. Figure 1 illustrates the complete proposed framework. Figures in the methodology are illustrated using a sampling rate to 2000 Hz.
2.1. ECG Noise Detection
To automatically determine whether substantial ECG spikes are present in the EMG signal, and if filtering is required, the initial EMG signal is smoothed and rectified. Then its baseline is analyzed to calculate the baseline threshold, and the EMG signal is converted to binary form using this threshold. Finally, the presence of
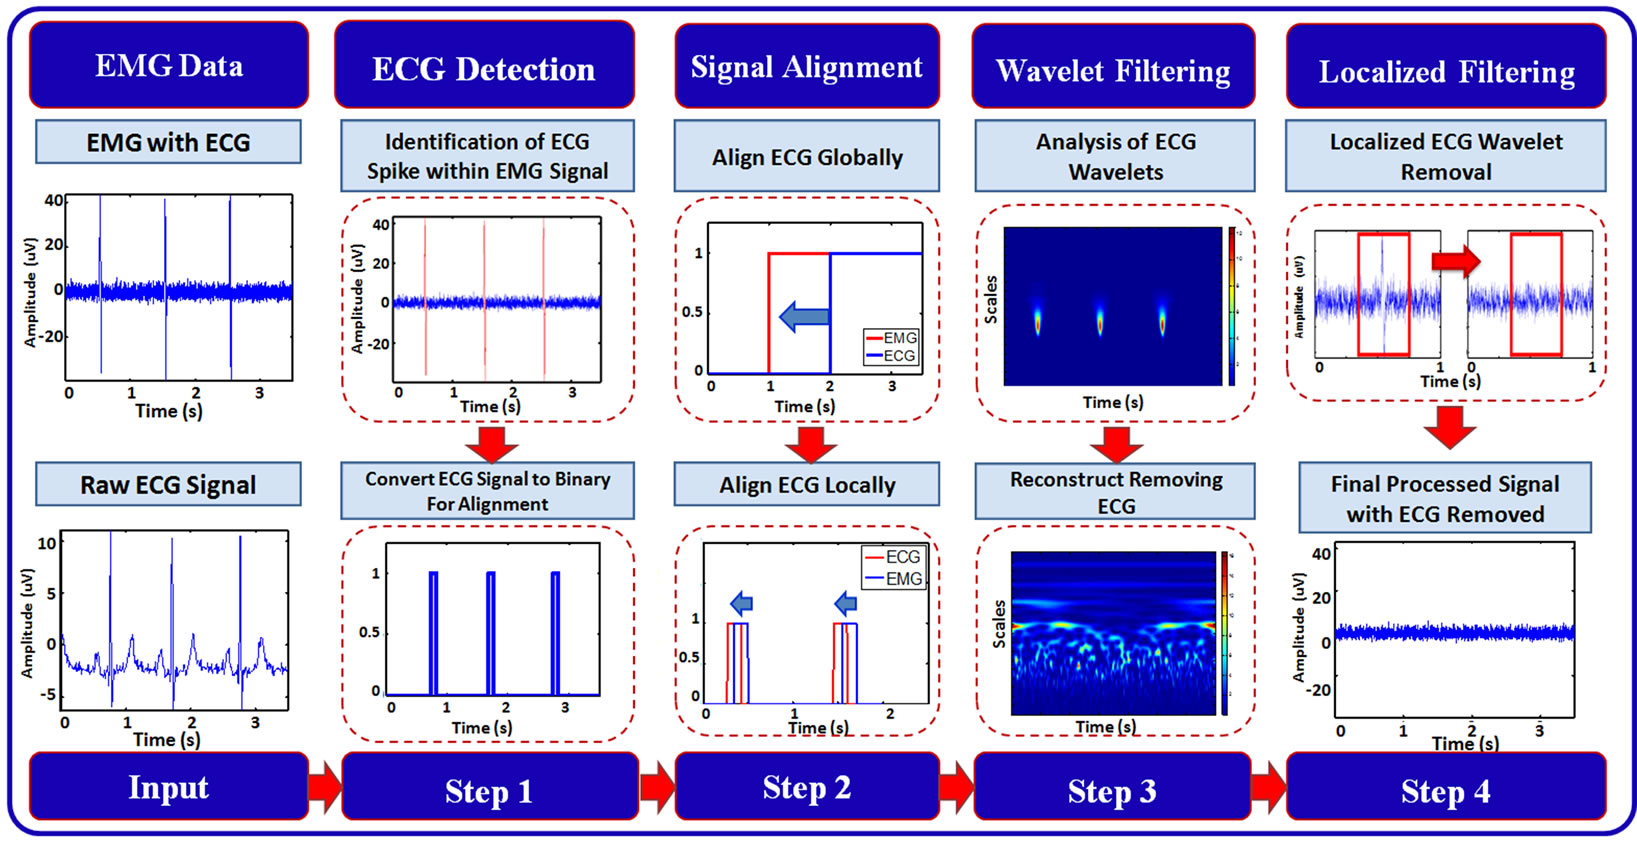
Figure 1. Block-diagram of the proposed framework for local filtering of the ECG noise.
the ECG is determined by comparing the rate of occurrence of ECG spikes to a physiologically viable rate. When within a physiologically viable rate, ECG corruption is present. The individual ECG noise detection stages in Figures 2(a) and (d) are described below.
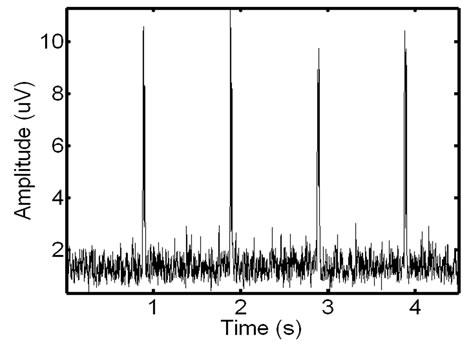
Smoothing and rectification of the initial EMG improves the reliability of the ECG noise detection by minimizing the effect of low magnitude spikes that occur in the baseline of the recorded signal. The movingwindow-average filter (with the window width of 10) smoothes the absolute data values and eliminates the stray baseline noise spikes (see Figures 2(a) and (b)).
Following this transformation, the baseline signal is analyzed in order to isolate the ECG spikes from it. Then the EMG signal is divided into intervals, each containing 100 samples, and the local maximum in calculated within each interval. The median value of the set of all the local maxima is used as a discriminatory threshold: values above and below the threshold are associated with the ECG spikes and the data baseline or erroneous noise spikes, respectively. Figure 2(c) shows the result of this process: the signal locations belonging to the baseline are in red, while the ECG noise locations are in black. In our tests, this adaptive threshold has demonstrated positive results for EMG signals with both low and high magnitude ECG noise. The EMG signal is then thresholded into a binary signal where the ECG noise and the background noise are represented by 1’s and 0’s, respectively (see Figure 2(d)).
The obtained binary representation of the ECG noise allows for calculating the number of the ECG noise spikes. Since the signal sampling rate is known from the data collection, the number of the ECG spikes within a certain time interval can be directly converted into an-
 (a)
(a)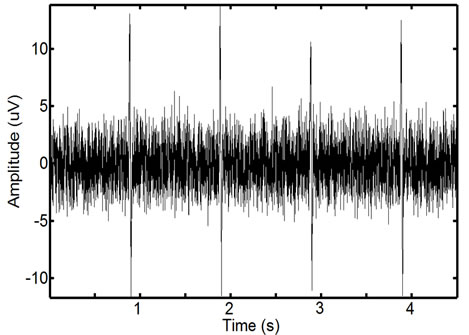 (b)
(b)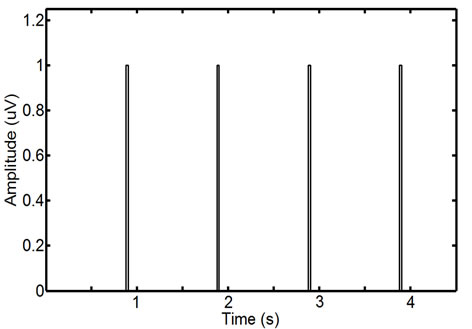 (c)
(c)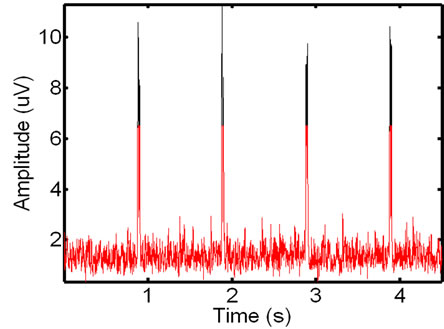 (d)
(d)
Figure 2. ECG noise detection: an initial raw (a) and the smoothed and rectified EMG signal (b); automatically detected baseline components in red and remaining unfiltered spikes in black (c), and the final thresholded binary ECG noise spikes (d). This EMG interval contains four clear ECG spikes.
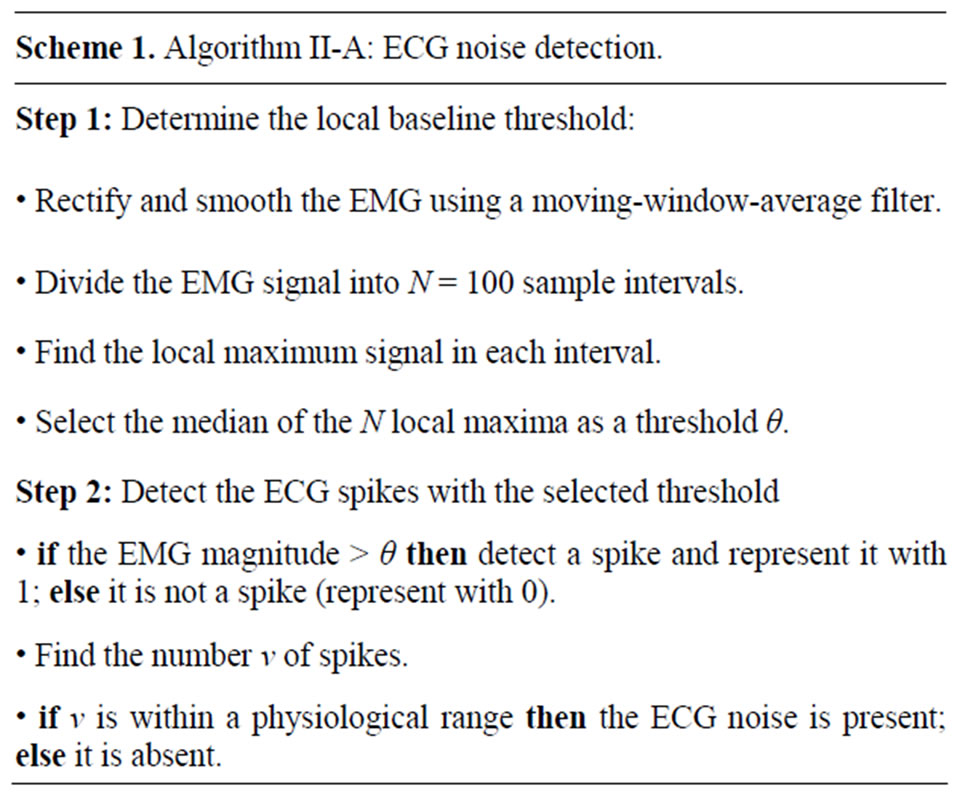
anticipated heart rate to be compared to a physiological one. This interval can be adjusted according to activity, but generally the recordings are for patients in a supine condition. The resting heart rate, given by the American Heart Association is 60 - 90 bpm [25]. In our experiments this range was expanded to 40 - 110 in order to account for possible fluctuations in the case of spinal cord injured patients. The rates above the chosen range indicate that nearly all the EMG is a baseline signal, the spikes being simply the baseline noise. Similarly, the rates below this range indicate only rare noise pops in the signal with no actual ECG contamination. The full algorithm is detailed in Algorithm II-A (Scheme 1).
2.2. Signal Alignment
To accurately locate and remove spikes of the interfering ECG noise by local filtering, the raw ECG and EMG recorded individually by two separate systems are synchronized, i.e. mutually aligned, by using electrical pulses, recorded in each system at distinct time intervals. Before the alignment the edges of the synchronizing pulses in the EMG and ECG signals have mutual offsets. For aligning the signals, the ECG is always transformed to match the critically important EMG by determining locations  and
and  of front edges of the same synchronizing pulse. Depending on the signed difference,
  , the ECG signal is shifted to the left or right in order to correctly align these front edges. After the synchronization, the raw ECG signal is converted to binary where the signal is equal to 1 during the QRS complex of the ECG signal and 0 otherwise.
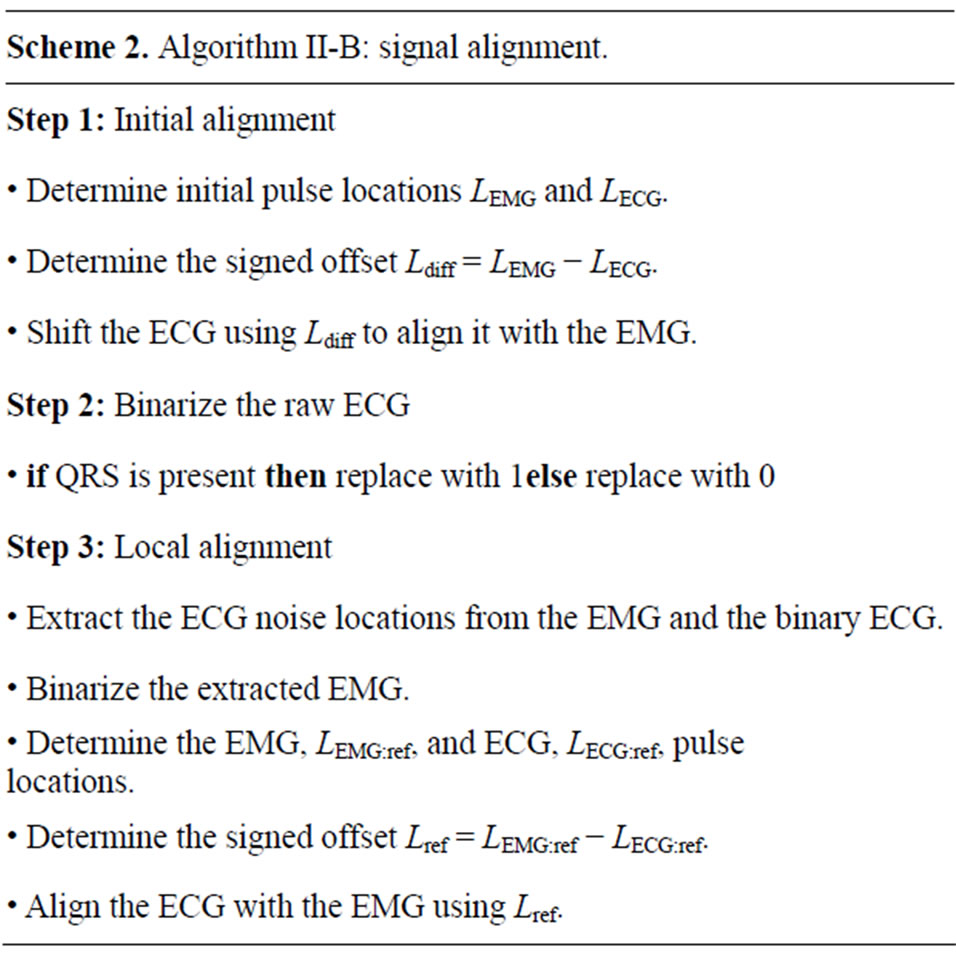
Typically, multiple EMG recordings are simultaneously acquired using sensors at different distances from the heart. While the global pulse synchronization is generally acceptable, the ECG alignment generally must be refined for each of the individually recorded signals. Such a local alignment of the binary ECG signal is applied separately to each recorded signal as follows. An area of noise is selected in the EMG and the corresponding data points are extracted from the binary ECG. The extracted EMG signal is the converted to a binary representation where the ECG spikes are represented by a value of 1. Then the above pulse-based alignment is performed to determine the signals offset and globally shift the binary ECG representation so that it overlays the ECG spikes exactly. Figure 3 illustrates the result of this process, showing a precision alignment ECG windows on top of ECG corruption in an EMG signal. The full algorithm is detailed in Algorithm II-B (Scheme 2).
2.3. Wavelet Filtering
The ECG noise is filtered from the EMG by using the classic Morlet wavelet decomposition [21,26]. For an equispaced time series, 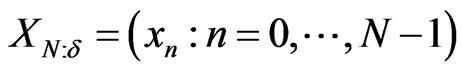 , with time spacing
 , the base wavelet,
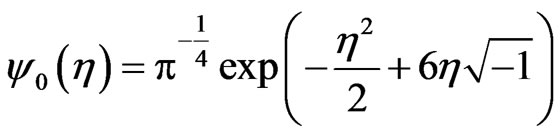
  , is a zero-mean Gaussian-modulated planar wave [27], localized in both the time and frequency spaces and depending on a dimensionless parameter
  where
where  is the wavelet scale:
 (1)
(1)
Typically, the number of normalized, scaled, and translated base wavelets for transforming  depends on its length,
  , time spacing,
  , and frequency resolution. The wavelet scales are defined as
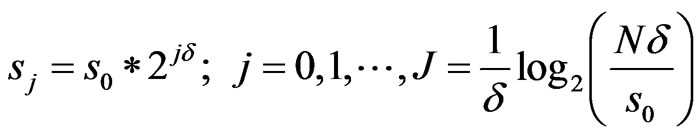 (2)
(2)
where  defines the smallest resolvable scale. In our case, correlations of the same-scale components of the EMG and ECG decompositions are compared by building always the same their number
 . To ensure this requirement, the parameter
  is set to 128 regardless of the signal length, so that
  is calculated as
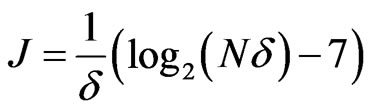 .
.
The decomposition results are clearly visible on wavelet scalograms, showing relative magnitudes of the wavelet coefficients with color-coded rectangles, which
 -and
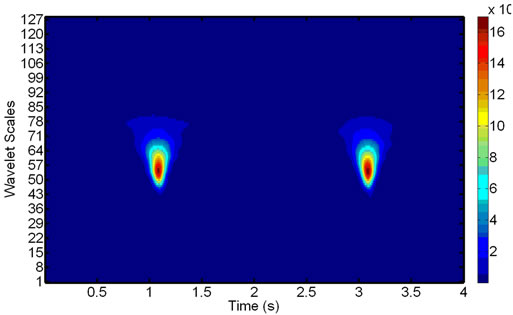
-and  -sides represent, respectively, the time interval and the frequency range of each coefficient. Figure 4 shows signals with and without the ECG noise corruption and the resulting scalograms. It can be clearly seen that all the wavelets contain some data from a standard EMG signal, being very random by itself. But under the corrupting ECG noise. the ECG data tends to dominate certain bands within the signal.
To remove the ECG noise from the EMG, the wavelet decompositions of both the signals are compared. Two windows from the EMG are extracted, the first window containing only the known ECG noise in line with the binary ECG representation in Section 2.2, while the second window being taken from a larger portion of the EMG with both the noisy EMG signals and the ECG noise spikes. The above Morlet decomposition into the 128 wavelets is applied to each window, followed by the cross-correlation between the same levels of the two 128-wavelet sets. The EMG wavelets highly correlated with the ECG ones are removed sequentially in order to minimize the spikiness score, which averages the RootMean-Squared (RMS) and maximal signals within a window:
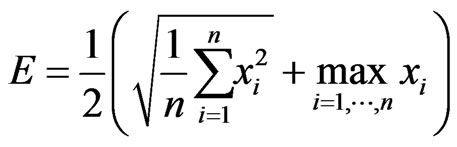 (3)
(3)
Comparing to the RMS by itself, this score emphasizes impacts of the large noise spikes. When the ECG noise is absent, the maximum signal in the window is close to the RMS of the same signal and does not significantly alter the spikiness score. Once the spikiness of the remaining signal reaches its minimum, the removed wavelets are assumed containing the ECG noise and removed during the local filtering illustrated in Figure 5. The whole process is detailed in Algorithm II-C (Scheme 3).
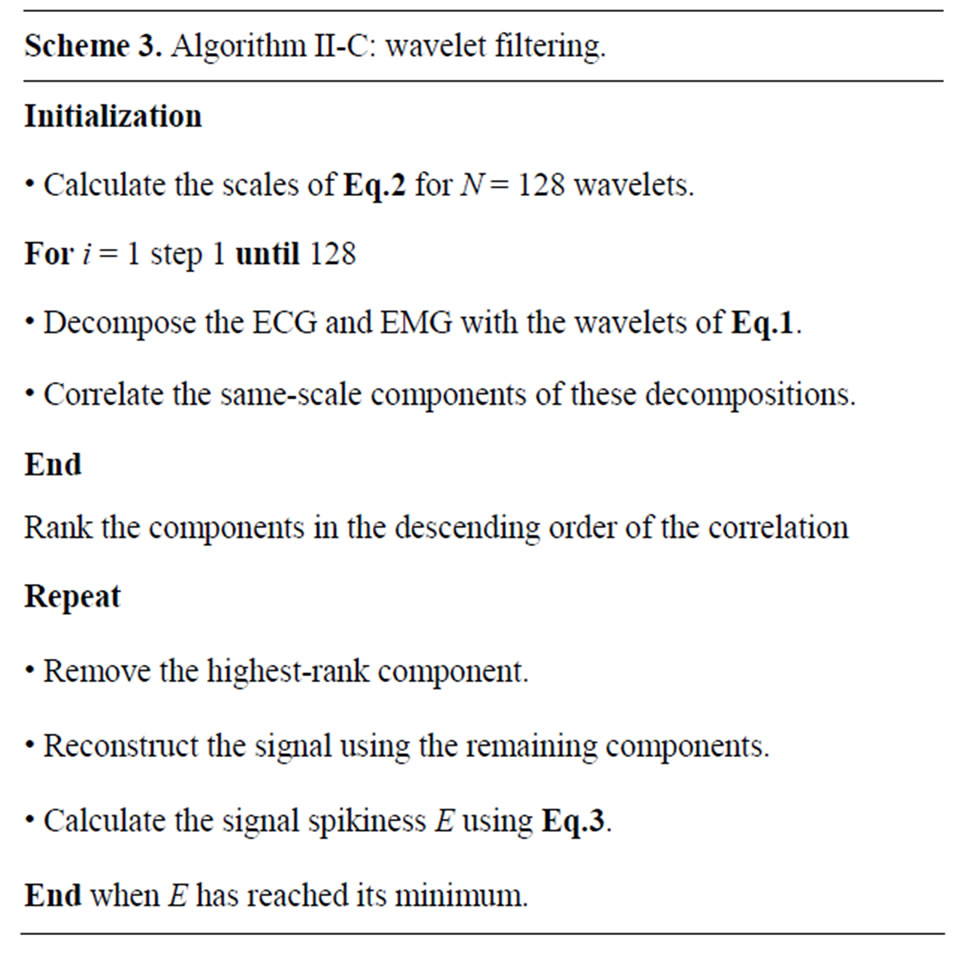
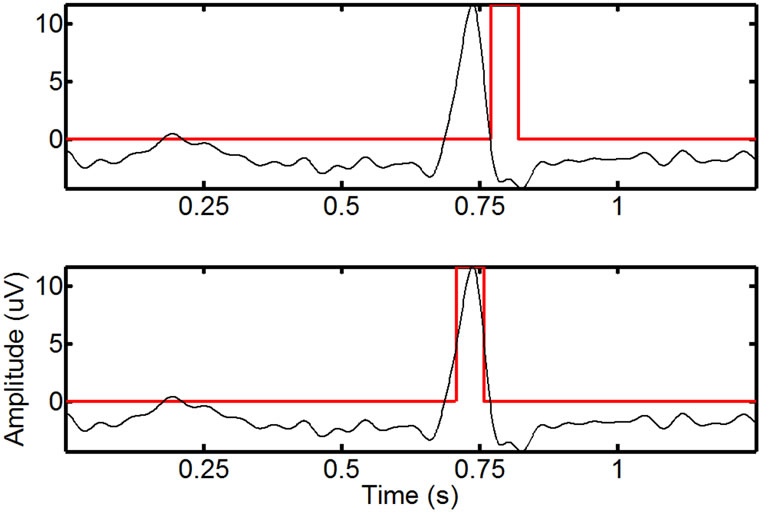
Figure 3. Local alignment of the binary ECG to an EMG: an area around a single spike before (top) and after (bottom) the complete alignment (the smoothed ECG is in black, while the overlaid binary ECG is in red). Before the final alignment, and after the initial manual pulse alignment, the offset between the signals is small, but noticeable. After the combination of global and local alignment, the resulting binary ECG closely matches the ECGrelated spikes in the EMG.
 (a)
(a)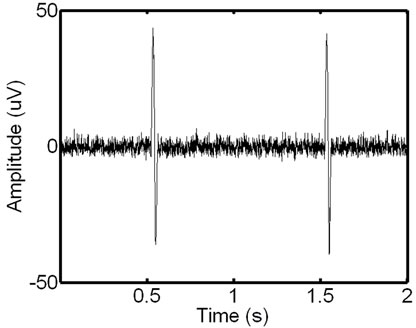 (b)
(b)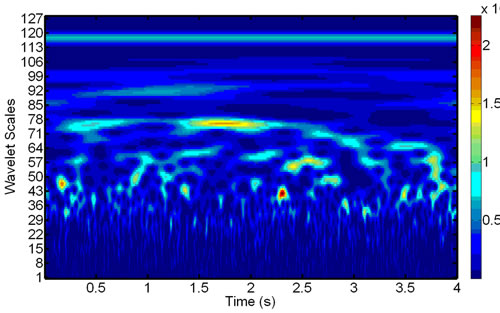 (c)
(c)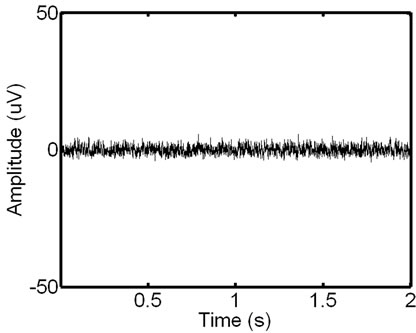 (d)
(d)
Figure 4. Signal scalograms: an ECG-corrupted (a) and clean (c) EMG and their scalograms, (b) and (d), respectively. Note how the prominent ECG peaks in the EMG signal translate to the resulting scalogram.
2.4. Local Signal Filtering
Finally, the ECG noise is filtered locally and removed optimally from the EMG by combining the binary ECG representation from Section 2.2 with the selective wavelet filtering from Section 2.3. This local filtering involves the following four steps: 1) extracting a local window containing the ECG noise from the EMG; 2) identifying the center and the width of the ECG noise spike within the local window in order to refine the window around this spike; 3) removing noise-related components of the wavelet decomposition from the refined window on the basis of the wavelet correlation; and 4) reconstructing the window signal using the remaining (filtered) wavelet components. Algorithm II-D
 (a)
(a)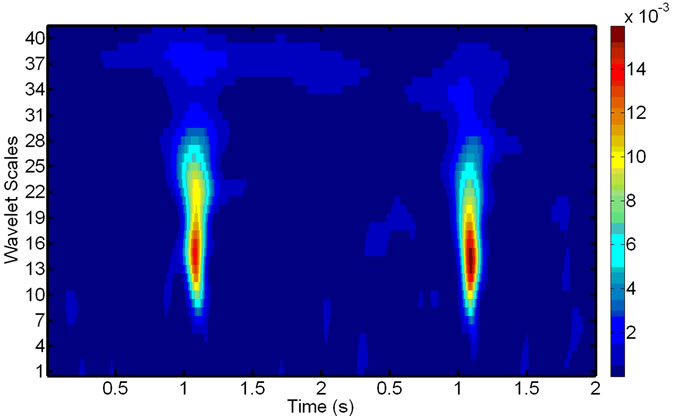 (b)
(b)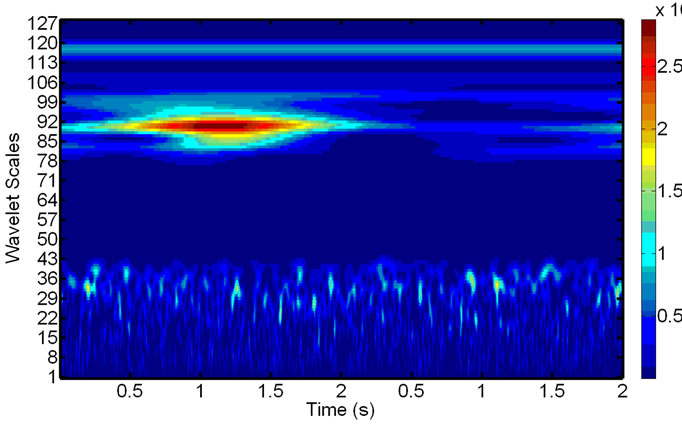 (c)
(c)
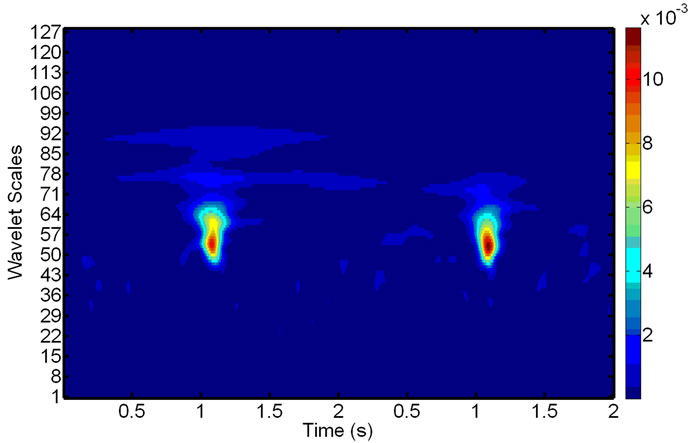
Figure 5. Scalograms of an ECG-noise-corrupted EMG: (a) The original noisy EMG before filtering; (b) Components of the wavelet decompositions, highly correlated with the ECG noise; (c) The final de-noised EMG, reconstructed after removing the components in (b).
(Scheme 4) details the use of the aforementioned algorithms for the local signal filtering.
The binary ECG representation is used to extract from the noisy EMG the individual ECG-corrupted windows. illustrates the process of extracting an initial local window. Each initial window is refined then to ensure filtering only the ECG-related spike. Within each of the initial Figure 6 windows the absolute signal values are smoothed to determine the window signal profile. Its global maximum value indicates the position of the center of the ECG spike. The left and right neighboring local minima to this maximum represent the left and right base of the individual spike, respectively. The refined local window includes finally only the EMG signals from the interval between the left and right minima (see Figures 7 and 8 showing the local window before and after the refinement).
After the wavelet decomposition of the EMG signal within the refined window (see Section 2.3), the components, being highly correlated with those for the ECG noise, are removed. Figure 9 The remaining ones allow us to reconstruct the de-noised EMG and replace the original signal in the window, effectively eliminating the presence of the ECG noise from the EMG at this location. The operation repeated until all the ECG-corrupted windows in the EMG are de-noised.
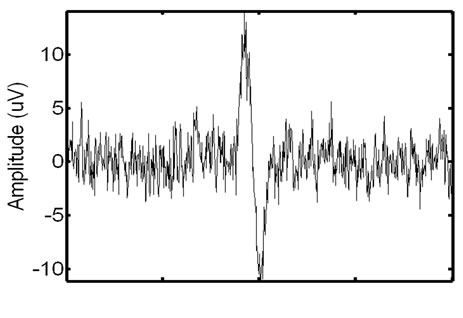
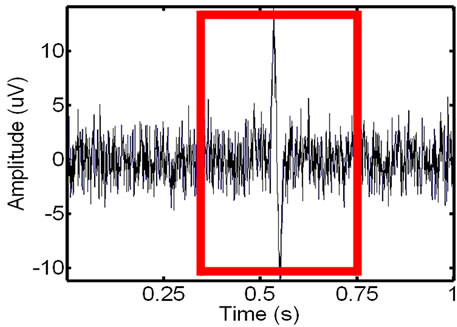
Figure 6. Extracting the window with the ECG noise from the EMG: the identified (left) and extracted (right) noisy EMG window.
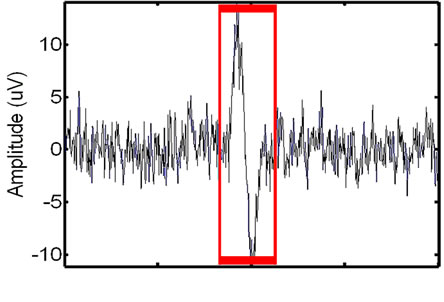
Figure 7. Refining the initial ECG-corrupted window extracted from the EMG: the identified (left) and extracted (right) refined window.
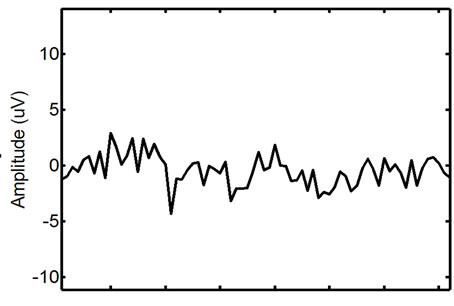
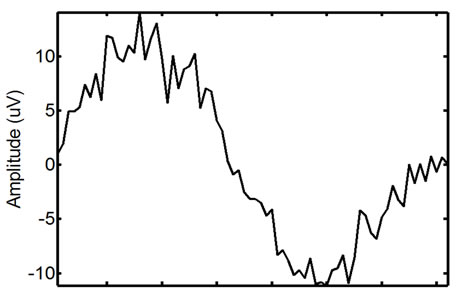
Figure 8. Wavelet filtering of the ECG-corrupted EMG window: the signal before (left) and after (right) the filtering.
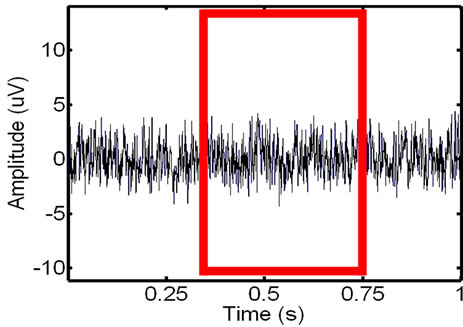

Figure 9. Removing the ECG noise from the EMG (the extracted window is highlighted for clarity): the initial (left) and the locally filtered (right) signal.
2.5. Validation Metrics
To validate the effectiveness of the proposed approach, we test the approach on synthetic phantom signals and in-vivo signals by using two metrics: 1) the RMS Error Measurement (RMSE and RMSE-I) and 2) the Relative Change in Variance from the original signal (VARE and VARE-I).
2.5.1. RMS Error Measurement
One of the most common ways of measuring the energy in a signal is the Root Mean Square calculation, or RMS. Let  be a signal, and let a portion of a signal be defined as
 , which encompasses the portion of the signal in the interval from
  to
to . The RMS of a signal portion is then defined as
 . Using the ECG signal we are able to determine a number of bins,
  , in the signal,
  , where ECG interference is present. Conversely, let
  represent the number of bins in the signal where ECG interference is not present. We then define the RMSE and RMSE-I as:
 (4)
(4)
 (5)
(5)
The RMSE is the error between the RMS of the original (clean signal without ECG noise) and an observed signal (ECG corrupted, or a filtered signal) for all of the bins in the signal where ECG noise is present. The RMSE-I is the error between the RMS of the original and an observed signal for all of the bins in the signal where ECG noise is not present. Therefore, the RMSE measures how effectively a filter remove the actual ECG from the signal, and the RMSE-I measure if the filter is impacted areas of the signal that do not contain ECG noise. An effective filter should have a low RMSE and RMSE-I, indicating that it effectively removes the ECG, and does not impact any areas of the signal that do not contain ECG. In results the mean and standard deviation of the RMSE and RMSE-I are given for signals.
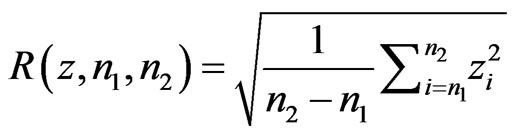
2.5.2. Relative Change in Variance
Another useful measurement is the change in variance in a signal. Variance is an important indicator of recovering local properties in a signal, and a low change indicates that the filter did not randomly remove points from the signal, but accurately recovered the original signal. Similarly to the RMS, let  be a signal, and let a portion of a signal be defined as
 , which encompasses the portion of the signal in the interval from
  to
to . Again, using the ECG signal we are able to determine a number of bins,
  , in the signal,
  , where ECG interference is present. Conversely, let
  represent the number of bins in the signal where ECG interference is not present. The variance of a signal portion is computed by moving window of the width of 7 data points across a signal portion and storing the variance value at each location along the signal portion. The mean variance
  of the interval of
  to
to  is then computed. We then define the VARE and VARE-I as:
 (6)
(6)
 (7)
(7)
Similarly to the RMSE and RMSE-I, the VARE is the error between the variance of the original (clean signal without ECG noise) and an observed signal (ECG corrupted, or a filtered signal) for all of the bins in the signal where ECG noise is present. The VARE-I is the error between the variance of the original and an observed signal for all of the bins in the signal where ECG noise is not present. An effective filter should again have low VARE and VARE-I values, indicating that it effectively recovers the local properties of the signal, and does not impact the local properties of the signal outside of locations containing ECG. In results the mean and standard deviation of the VARE and VARE-I are given for signals.
3. VALIDATION ON SYNTHETIC SIGNALS
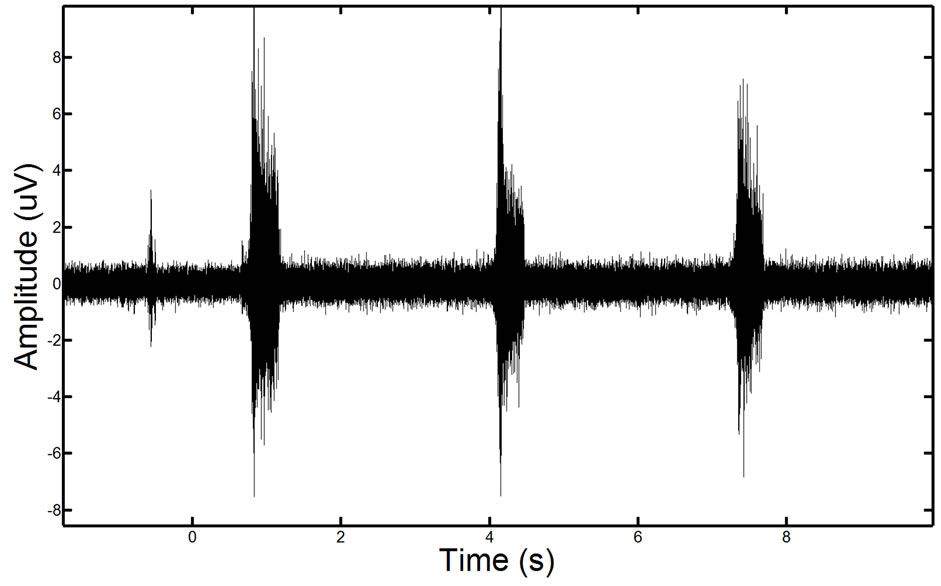
To validate the effectiveness of the proposed approach, we test the approach on synthetic phantom signals and in-vivo signals. For reference, an EMG signal containing ECG corruption is illustrated in Figure 10.
To construct the synthetic phantom signals an EMG baseline is generated using the EMG LAB software [28] to generate random, but physiologically accurate EMGs
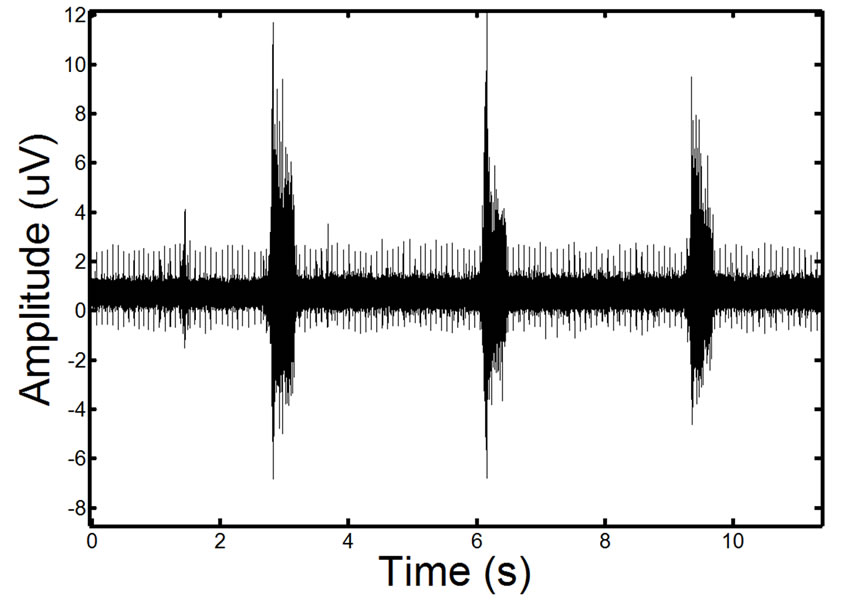
Figure 10. Example of a real EMG, showing moderate ECG noise corruption. The repetitive spike pattern observed in the signal is the ECG noise corruption.
signals. Often EMG recordings are centered around specific events or actions that are observed, so to simulate events in our EMG recordings we alter portions of the signal using a random sinusoidally-based profile. This simulates bursts of patient activity in the EMG recording. This profile can be varied to create low (1 mV) to high (5 mV) bursts above the baseline EMG signal. In our synthetic phantoms we construct low and high test EMGs containing three events each (a standard number of events in a patient recording of an activity).
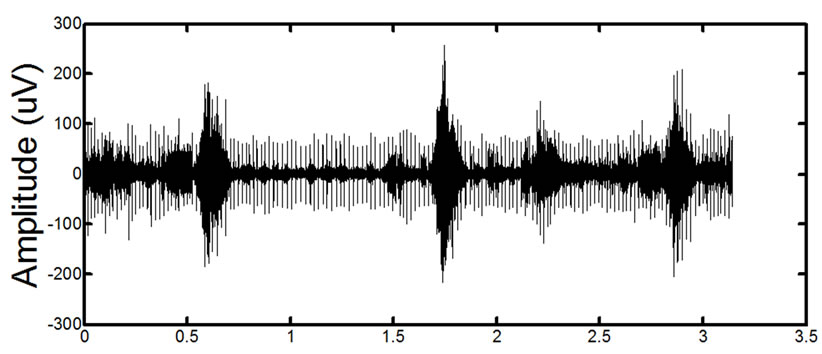
Karthik et al. [29] observed that combining a specific Fourier Series [29] allows for the accurate simulation of ECG signals. The noise introduced in EMG signals from ECG interference is an echo of the actual ECG. To realistically simulate this the ECG waveforms constructed using the Karthik technique are reduced in length and magnitude so that they accurately resemble the ECG noise found in actual recordings. The creation of a noisy synthetic phantom is then completed by adding the simulated ECG echo to the simulated ECG signal. A resulting phantom can be seen in Figure 11. Due to the random nature of ECG and EMG generation using these methods, it is possible to create a number of signals with the same parameters that are distinctly different from one another. Testing on additional signals allows for a more detailed analysis of filter performance.
3.1. Validation on Synthetic In-Vivo Signals
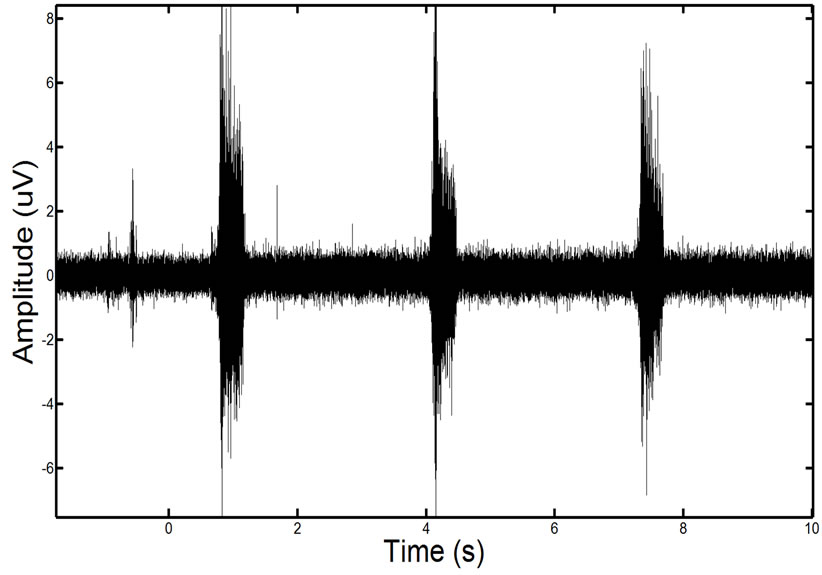
We tested the approach on synthetic data constructed using in-vivo EMG data from spinal cord injury patients. To do this we acquired EMG data from a muscle in the leg which was confirmed by an expert that no ECG interference was present. We also recorded ECG activity directly from the heart. Figure 12 shows an example of the clean and noise corrupted in-vivo signals. We then added the ECG echo to the EMG data found in the leg. This allowed us to have both a known ground truth EMG and an in-vivo noise corrupted EMG.
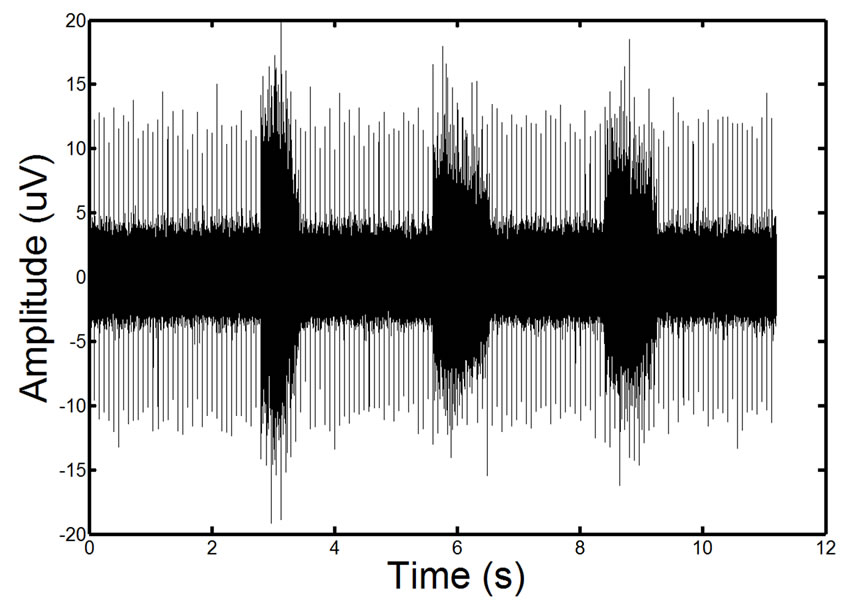
Figure 11. Example of a phantom EMG containing high ECG noise corruption. The repetitive spike pattern is the ECG noise corruption. There is a large degree of similarity in the phantom signal and the real EMG signal.
 (a)
(a)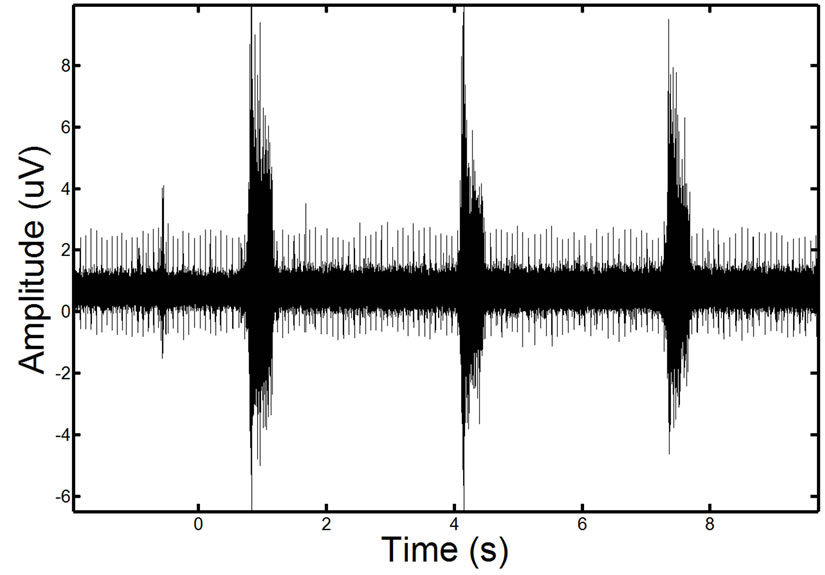 (a)
(a)
Figure 12. Showing an in-vivo EMG signal that is recorded of the leg muscle before (left) and after the recorded ECG has been added to the signal (right).
3.2. Validation on In-Vivo Signals
We have also tested the proposed approach on in-vivo signals. Signals are recorded from spinal cord injury patients using a 16-Channel PowerLab Systems surface EMG recording system at 2000 Hz, along with synchronized ECG recordings. Due to the fact that a ground truth is not present, the results have been validated by Dr. Alexander Ovechkin for accuracy.
4. RESULTS AND DISCUSSION
We validate the effectiveness of the proposed approach against 4 other filtering techniques on synthetic phantom signals and in-vivo signals. The proposed technique was compared to a comparative global wavelet-based filter (based on [24]), a 50 Hz notch filter (47 - 53 Hz bandstop), a 60 Hz notch filter (57 - 63 Hz band-stop), and a 60 Hz adaptive filter [30].
4.1. Synthetic Results
To validate the technique, we tested the proposed filtering method on synthetic signals. Four separate tests were done with the synthetic with a combination of high (5 mV) and low (1 mV) EMG activity and high (10 mV) and low (5 mV) ECG noise. Table 1 shows the RMS and RMS-I results for the four tests.
We also compare the variance of the signals in the same four tests. Table 2 shows the VARE and VARE-I results for the four tests. Again, each test is performed on five synthetic signals and the average and standard deviation is given.
4.2. Synthetic In-Vivo Results
We tested the approach on synthetic data constructed using in-vivo EMG data from spinal cord injury patients. As done in the purely synthetic data, we compare the RMS error and variance of the in-vivo signal. Table 3 shows results of this test. Figure 13 shows a visual result for an example processed signal.
4.3. In-Vivo Results
We finally examine the effects of the filtering on in-vivo EMG signals acquired from spinal cord injury patients. The in-vivo results were visually examined by a clinician for accuracy as described in the methods. Figure 14 shows the results of the filtering for two representative signals taken from two different patients. The muscles are from the patient torso and the original signals contain considerable ECG corruption.
4.4. Discussion
4.4.1. Synthetic Data
The proposed method consistently performs the best in all of the RMSE tests. It is also notable from the results that the proposed filtering method provides the greatest beneficial impact on signals containing higher amounts of EMG and ECG. In tests with very low ecg contamination and EMG activity, the adaptive filter performs well, however, in most in-vivo cases the ECG is more accurately represented by the high ECG noise tests.
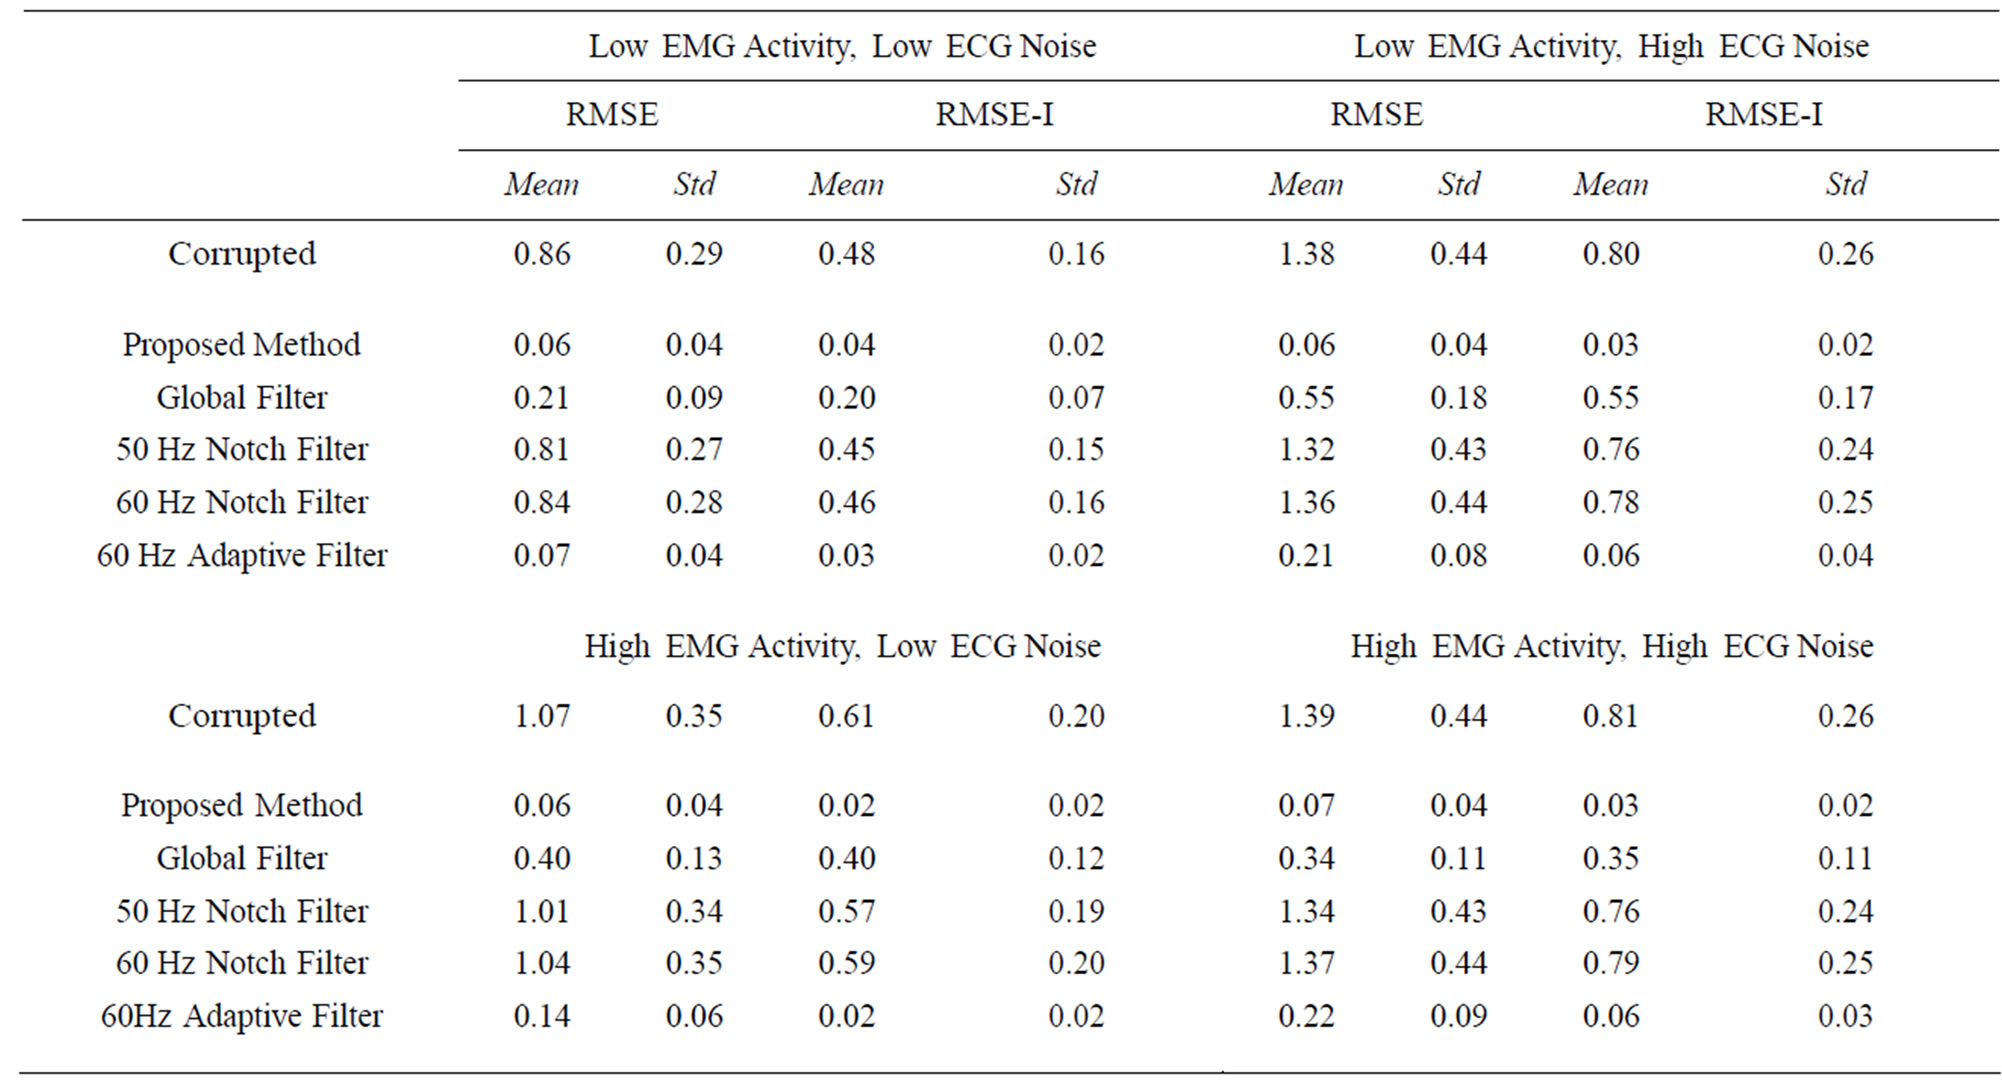
Table 1. RMSE and RMSE-I results for test with high (5 μV) and low (1 μV) EMG activity and high (10 μV) and low (5 μV) ECG noise. Each test was done on 5 synthetic signals and the mean and standard deviation near reported for the four different tests. The proposed method consistently performs the best in the tests; however, it is obvious that the filter has a greater beneficial impact on signals with higher EMG and ECG.
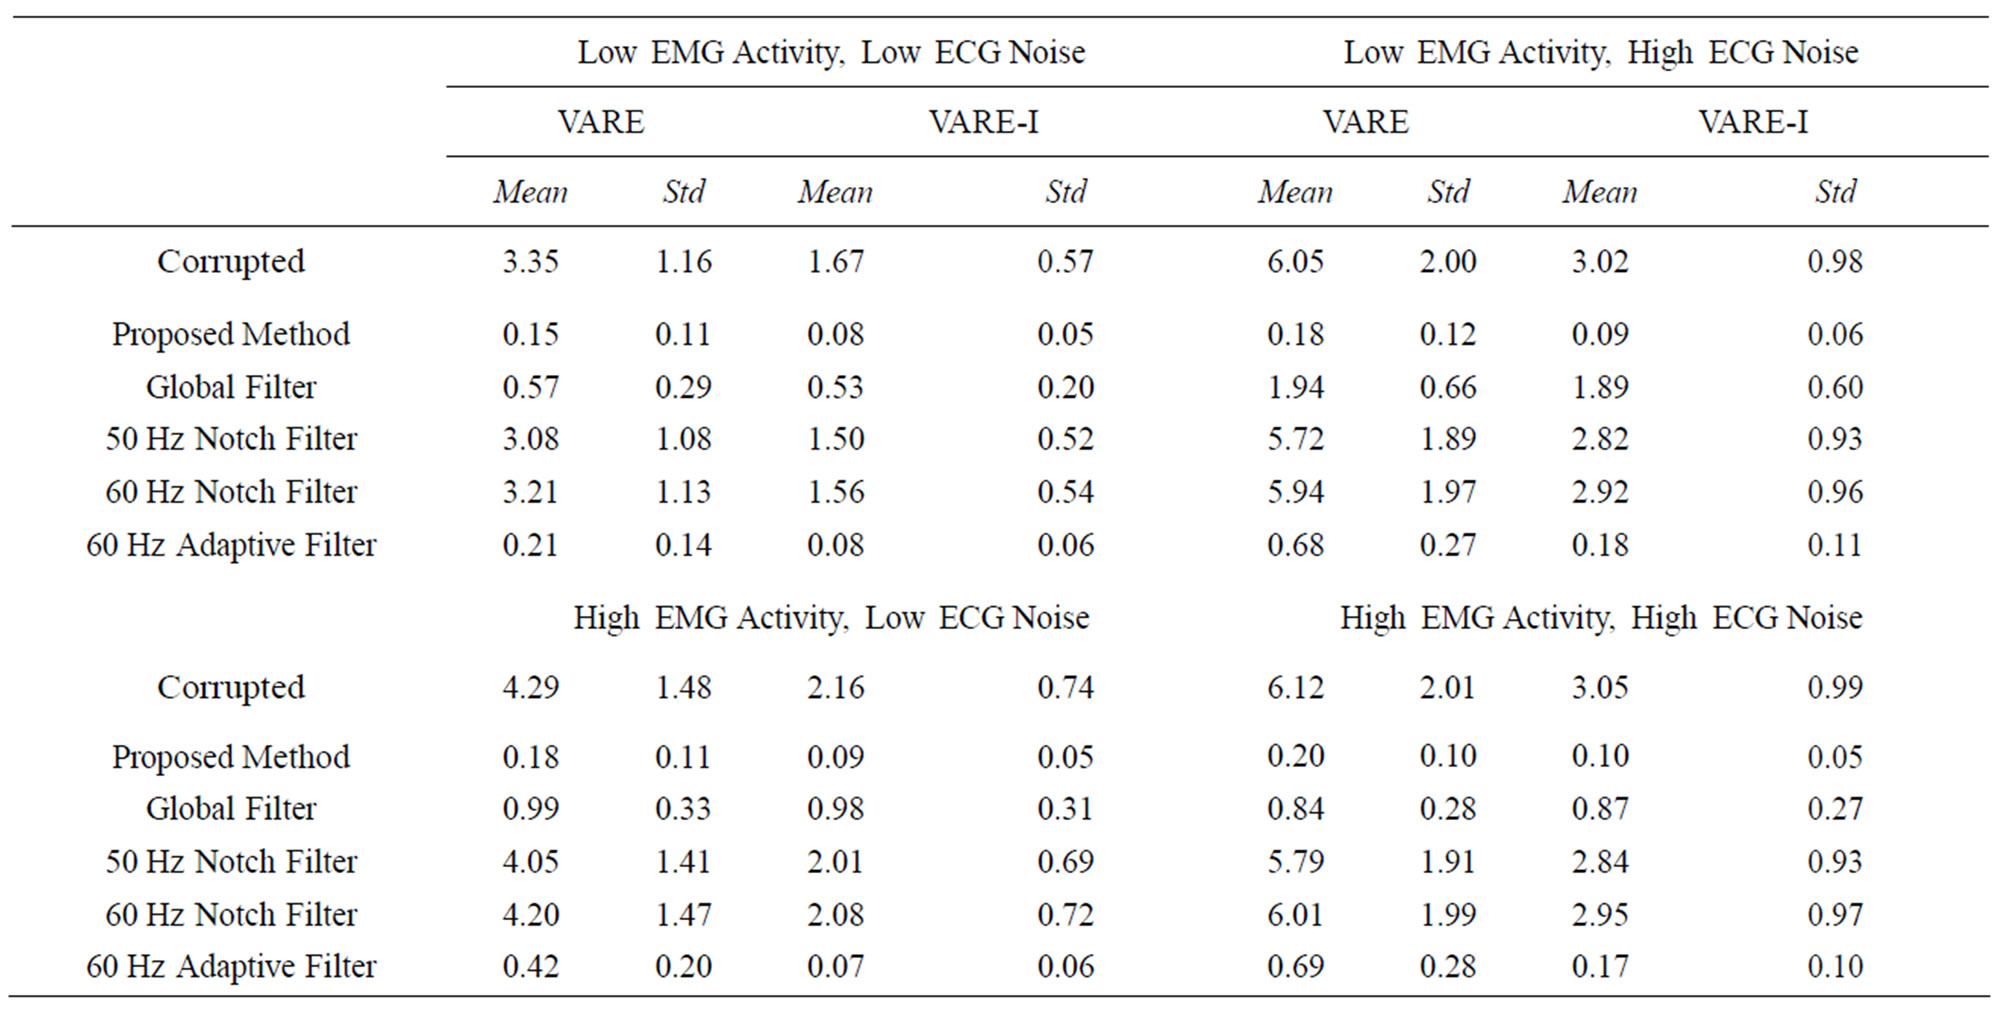
Table 2. VARE and VARE-I results for test with high (5 μV) and low (1 μV) EMG activity and high (10 μV) and low (5 μV) ECG noise. Each test was done on 5 synthetic signals and the mean and standard deviation are reported for the four different tests. The proposed method consistently performs the best in the tests; however, it is obvious that the filter has a greater beneficial impact on signals with higher EMG and ECG.
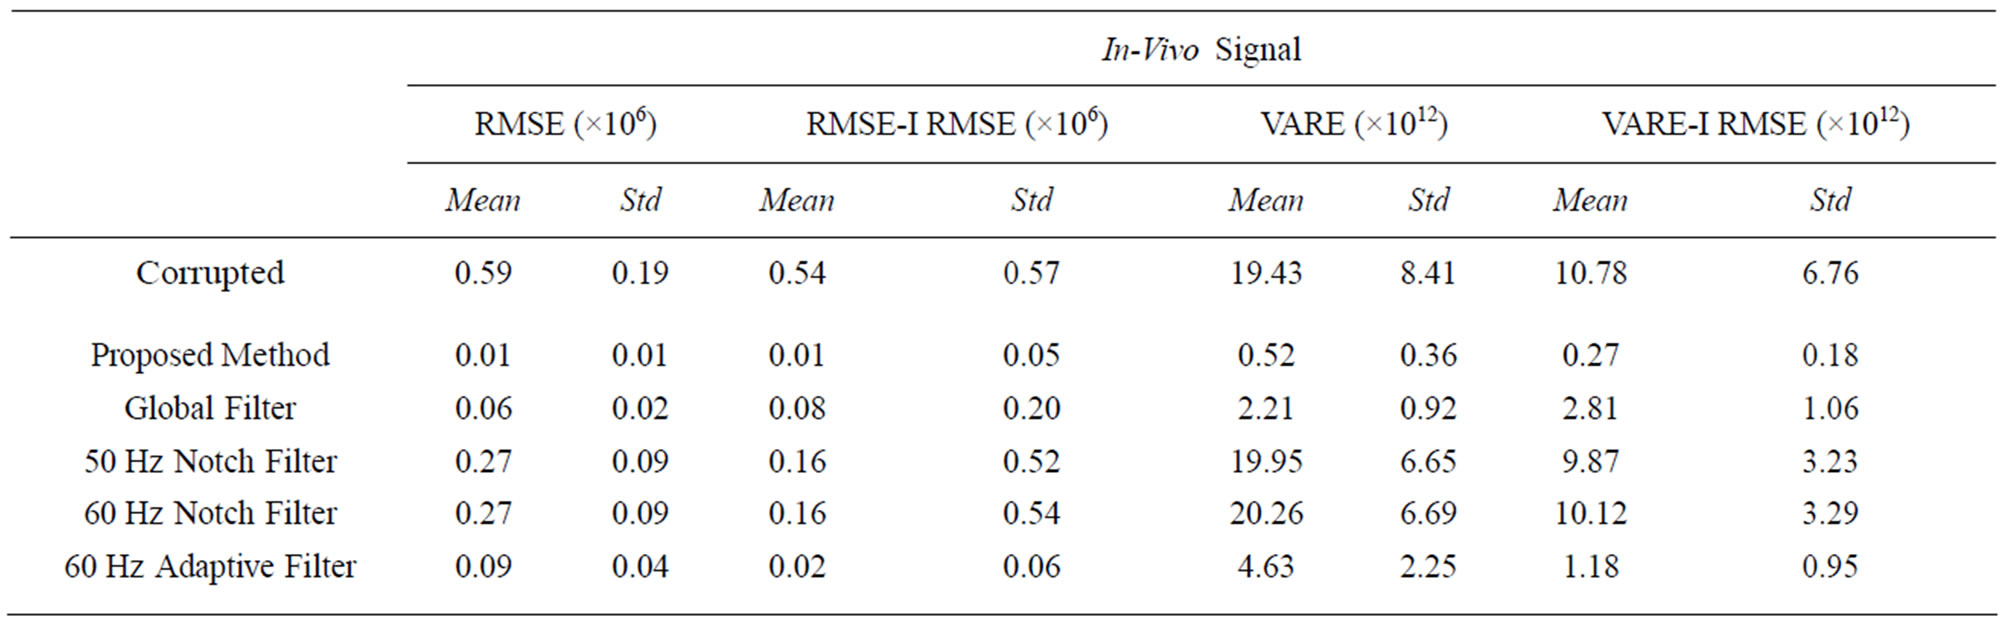
Table 3. The RMSE, RMSE-I, VARE and VARE-I results for an in-vivo signal test. The results closely represent those found in the synthetic signals.
While the adaptive and global filters do provide filtering for the ECG contamination, the proposed method consistently shows lower mean and standard deviations, and has a lower impact on portions of the signal that do not contain contamination, indicating it is more effective and more reliable. The notch filters, predictably, do not provide an adequate amount of filtering. This is due to the fact that ECG noise interference is often dynamic and does not easily fit into a standard frequency for removal.
The VARE results also indicate that the proposed method shows the best performance on filtering the signals. The global filtering shows adequate VARE results inside the bins containing ECG, but introduces problems outside of the ECG bins. The proposed technique showed
 (a)
(a)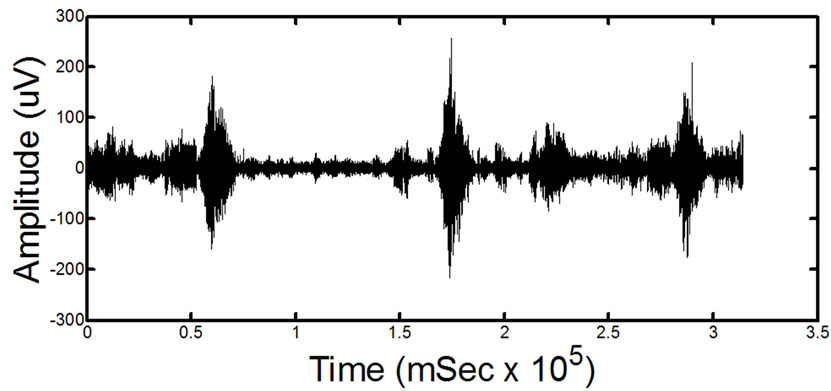 (b)
(b)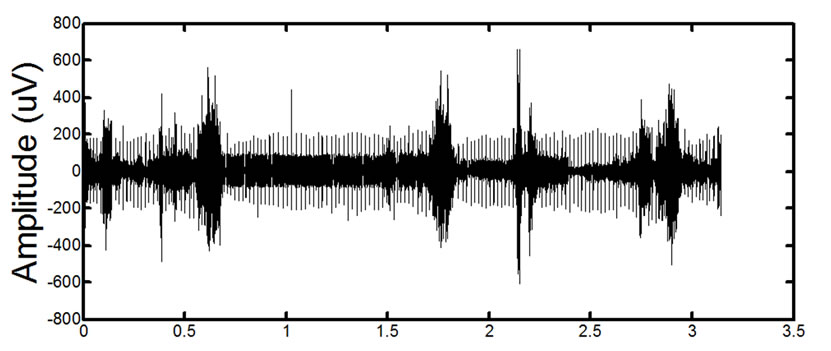 (c)
(c) (d)
(d)
Figure 14. Results of processing on in-vivo data. (a) and (c) show two different signals for two different patients before processing. (b) and (d) show the signals after the proposed filtering method has been applied to the signals. The absence of ECG in the filtered signals is clearly noticeable. Detailed visual analysis has confirmed that the ECG is no longer present in the signals after filtering.
good results for removing ECG interference in the presence of a wide range of EMG signals and ECG interference forms.
4.4.2. Synthetic In-Vivo Data
The proposed method shows the greatest reduction in ECG interference with the lowest impact on the signal outside of the ECG locations. A visual representation of the final filtered signal can be found in Figure 13 clearly showing the lack of ECG presence. The results of this filtering are consistent with the synthetic data results.
4.4.3. In-Vivo Data
The signals were visually examined by a clinician and confirmed to have a significant to total removal of ECG contamination in all tests. While there is no ground truth for comparison, the proposed method was visually observed to have the best overall performance.
4.4.4. Limitations
The proposed method does have several limitations however, most notably that it requires the presence of an ECG recording along with an EMG recording to perform filtering. As seen in the in-vivo signal images, it is also possible that very small artifacts resembling ECG interference may also be removed by the proposed technique, however this is also the case with other filtering methods. Due to the complexity of the filtering, it is slightly slower than other methods and requires examining the entire signal to remove the ECG. This makes real-time application of this filter computationally difficult if not impossible. Fortunately, most EMG processing and analysis is done after recording data and therefore this technique is applicable to a wide range of clinical applications and analysis, including spinal cord injury
5. CONCLUSION
Heart-induced artifacts in an EMG from the trunk muscles of SCI patients hinders the accurate assessment of the valuable clinical information provided by the EMG. Current filtering techniques, which use global filtering or adaptive filtering principles, are not able to effectively de-noise the EMG, i.e. remove the ECG-related corruption. As shown by our analysis, localized filtering using the Morlet Wavelet Transformation is significantly more effective than traditional filters for preserving the native EMG signal. Therefore, the proposed framework is capable of effectively eliminating the ECG artifacts from an EMG signal. This method can be used clinically in order to precisely quantify the respiratory motor function in patients with SCI or other disorders who tend to produce low EMG activity.
REFERENCES
- Devivo, M.J. (2012) Epidemiology of traumatic spinal cord injury: Trends and future implications. Spinal Cord, 50, 365-372.
- Thomas, C.K., Zaidner, E.Y., Calancie, B., Broton, J.G. and Bigland-Ritchie, B.R. (1997) Muscle weakness, paralysis, and atrophy after human cervical spinal cord injury. Experimental Neurology, 148, 414-423. doi:10.1006/exnr.1997.6690
- El Masry, W.S., Tsubo, M., Katoh, S., El Miligui, Y.H.S. and Khan, A. (1996) Validation of the American Spinal Injury Association (ASIA) motor score and the National Acute Spinal Cord Injury Study (NASCIS) motor score. Spine, 21, 614. doi:10.1097/00007632-199603010-00015
- von Tscharner, V. (2000) Intensity analysis in time-frequency space of surface myoelectric signals by wavelets of specified resolution. Journal of Electromyography and Kinesiology, 10, 433-445. doi:10.1016/S1050-6411(00)00030-4
- Clancy, E., Bouchard, S., et al. (2001) Estimation and application of EMG amplitude during dynamic contractions. IEEE Engineering in Medicine and Biology Magazine, 20, 47-54.
- Redfern, M., Hughes, R., et al. (1993) High-pass filtering to remove electrocardiographic interference from torso EMG recordings. Clinical Biomechanics, 8, 44-48.
- Drake, J.D. and Callaghan, J.P. (2006) Elimination of electrocardiogram contamination from electromyogram signals: An evaluation of currently used removal techniques. Journal of Electromyography and Kinesiology, 16, 175-187. doi:10.1016/j.jelekin.2005.07.003
- Rodríguez-Carreño, I., Malanda-Trigueros, A., Gila-Useros, L., Navallas-Irujo, J. and Rodríguez-Falces, J. (2006) Filter design for cancellation of baseline-fluctuation in needle EMG recordings. Computer Methods and Programs in Biomedicine, 81, 79-93. doi:10.1016/j.cmpb.2005.11.002
- Schweitzer, T.W., Fitzgerald, J.W., Bowden, J.A. and Lynne-Davies, P. (1979) Spectral analysis of human inspiratory diaphragmatic electromyograms. Journal of Applied Physiology, 46, 152-165.
- van Boxtel, A. (2001) Optimal signal bandwidth for the recording of surface EMG activity of facial, jaw, oral, and neck muscles. Psychophysiology, 38, 22-34. doi:10.1111/1469-8986.3810022
- Zschorlich, V.R. (1989) Digital filtering of EMG-signals. Electromyography and Clinical Neurophysiology, 29, 81- 86.
- Hof, A.L. (2009) A simple method to remove ECG artifacts from trunk muscle EMG signals. Journal of Electromyography & Kinesiology, 19, 554-555. doi:10.1016/j.jelekin.2008.11.007
- Lu, G.H., Brittain, J.-S., Holland, P., Yianni J., Green, A.L., Stein, J.F., Aziz, T.Z. and Wang, S.Y. (2009) Removing ECG noise from surface EMG signals using adaptive filtering. Neuroscience Letters, 462, 14-19. doi:10.1016/j.neulet.2009.06.063
- Marque, C., Bisch, C., Dantas, R., Elayoubi, S., Brosse, V. and Pérot, C. (2005) Adaptive filtering for ECG rejection from surface EMG recordings. Journal of Electromyography and Kinesiology, 15, 310-315. doi:10.1016/j.jelekin.2004.10.001
- Bloch, R. (1983) Subtraction of electrocardiographic signal from respiratory electromyogram. Journal of Applied Physiology, 55, 619-623.
- Deng, Y.C., Wolf, W., Schnell, R. and Appel, U. (2000) New aspects to event-synchronous cancellation of ECG interference: An application of the method in diaphragmatic EMG signals. IEEE Transactions on Biomedical Engineering, 47, 1177-1184. doi:10.1109/10.867924
- Hyvärinen, A., Karhunen, J. and Oja, E. (2001) Independent component analysis. Wiley-Interscience, Hoboken. doi:10.1002/0471221317
- Costa Junior, J.D., Ferreira, D.D., Nadal, J. and Miranda de Sa, A.M.F.L. (2010) Reducing electrocardiographic artifacts from electromyogram signals with independent component analysis. 2010 Annual International Conference of the IEEE on Engineering in Medicine and Biology Society (EMBC), Buenos Aires, 31 August-4 September 2010, 4598-4601.
- Carre, P., Leman, H., Fernandez, C. and Marque, C. (1998) Denoising of the uterine EHG by an undecimated wavelet transform. IEEE Transactions on Biomedical Engineering, 45, 1104-1113. doi:10.1109/10.709554
- Daubechies, I. (1992) Ten lectures on wavelets. Society for Industrial and Applied Mathematics (SIAM), Philadelphia.
- Mallat, S.G. (1989) A theory for multiresolution signal decomposition: The wavelet representation. IEEE Transactions on Pattern Analysis and Machine Intelligence, 11, 674-693. doi:10.1109/34.192463
- Zhou, W.D. and Gotman, J. (2004) Removal of EMG and ECG artifacts from EEG based on wavelet transform and ICA. 26th Annual International Conference of the IEEE on Engineering in Medicine and Biology Society, IEMBS’04, San Francisco, 1-5 September 2004, 392-395.
- Taelman, J., Van Huffel, S. and Spaepen, A. (2007) Wavelet-independent component analysis to remove electrocardiography contamination in surface electromyography. 29th Annual International Conference of the IEEE on Engineering in Medicine and Biology Society, EMBS 2007, Lyon, 22-26 August 2007, 682-685.
- von Tscharner, V., Eskofier, B. and Federolf, P. (2011) Removal of the electrocardiogram signal from surface EMG recordings using non-linearly scaled wavelets. Journal of Electromyography and Kinesiology, 21, 683- 688. doi:10.1016/j.jelekin.2011.03.004
- Swain, D.P., Abernathy, K.S., Smith, C.S., Lee, S.J. and Bunn, S.A. (1994) Target heart rates for the development of cardiorespiratory fitness. Medicine & Science in Sports & Exercise, 26, 112-116.
- Grossmann, A. and Morlet, J. (1984) Decomposition of Hardy functions into square integrable wavelets of constant shape. SIAM Journal on Mathematical Analysis, 15, 723-736. doi:10.1137/0515056
- Torrence, C. and Compo, G.P. (1998) A practical guide to wavelet analysis. Bulletin of American Meteorological Society, 79, 61-78. doi:10.1175/1520-0477(1998)079<0061:APGTWA>2.0.CO;2
- McGill, K.C., Lateva, Z.C. and Marateb, H.R. (2005) EMGLAB: An interactive EMG decomposition program. Journal of Neuroscience Methods, 149, 121-133. doi:10.1016/j.jneumeth.2005.05.015
- Karthik, R. (2006) ECG simulation using MATLAB. College of Engineering, Guindy, Anna University, Chennai
- Nehorai, A. and Porat, B. (1986) Adaptive comb filtering for harmonic signal enhancement. IEEE Transactions on Acoustics, Speech and Signal Processing, 34, 1124-1138.
NOTES
*Equal contribution from both authors.
#Corresponding author.