Journal of Cancer Therapy
Vol.3 No.3(2012), Article ID:19922,6 pages DOI:10.4236/jct.2012.33025
Gene Expression Profiling of Human Myeloid Leukemic MV4-11 Cells Treated with 5-Aza-2’-deoxycytidine
![]()
1School of Biomedical Sciences and Pharmacy, Faculty of Health, University of Newcastle, Callaghan, Australia; 2School of Medicine, Johns Hopkins University, Baltimore, USA; 3Division of Genetics, Hunter Area Pathology Service, John Hunter Hospital, New Lambton, Australia.
Email: *kyutae.kim@gmail.com
Received April 10th, 2012; revised May 8th, 2012; accepted May 20th, 2012
Keywords: 5-Aza-2’-deoxycytidine; Gene Expression Profile; HOX; CD9; RGS2
ABSTRACT
The pyrimidine analog, 5-aza-2’-deoxycytidine (5-aza-dC) is a DNA methyltransferase inhibitor that triggers DNA demethylation leading to the reactivation of epigenetically silenced tumor suppressor genes. To understand the shift in gene expression which mediates the beneficial 5-aza-dC effects in leukemia, we have treated human myeloid derived leukemic cells with 5-aza-dC. Target genes were identified first in MV4-11 cells using a genome-wide gene expression profiling assay to detect differences in treated and untreated cells. From this analysis six genes were identified (HOXA4, HOXD4, HOXD8, HOXD12, CD9 and RGS2) as being significantly different expressed after treatment. To validate microarray data, we performed quantitative PCR on these genes from multiple leukemic cells. The results suggest that these genes are epigenetically regulated indicating that dysregulation of HOXA4, HOXD4, HOXD8, HOXD12, CD9 and RGS2 expression may play an important role in establishing the malignant phenotype in AML.
1. Introduction
Aberrant DNA hypermethylation is a frequent event in malignancy which can result in the silencing of critical genes. For this reason, reversal of DNA methylation by methyltransferase inhibitors such as 5-aza-2’-deoxycytidine (5-aza-dC) may be a suitable therapeutic strategy to combat the dysregulation of the transcriptome due to aberrant epigenetic change.
5-aza-dC is a well recognized activator of gene expression as a result of decreased DNA methylation [1]. At present, 5-aza-dC has been approved by the FDA (Food and Drug Administration) as a standard care for the treatment of myelodysplastic syndrome (MDS) and acute myeloid leukemia (AML) [2]. As more is learned about the mechanism of hypomethylating agents, new roles are emerging for 5-aza-dC in combination therapy for MDS and other hematologic malignancies such as AML and chronic myeloid leukemia [3,4].
AML is a genetically heterogeneous disease characterized by acquired somatic mutations in hematopoietic progenitor cells [5]. MDS describes a range of hematopoietic disorders characterised by hyperproliferative bone marrow disease originating from abnormal multipotent progenitor cells that have a high risk of progressing to AML [6]. It has been reported that the use of the 5-azadC has significantly reduced the risk of progression to AML [7]. Aberrant DNA methylation can be observed in multiple functionally relevant genes including p15 (CDKN2B) and is considered to play a significant role in development and progression to AML [8].
In this study, we found that the growth of leukemic cells, including MV4-11 cells, were inhibited after 5-azadC treatment suggesting this agent might be useful in reversing the dysregulated transcriptome in MV4-11 cells. Whole genome expression profiling of the MV4-11 cells was performed to identify key targets associated with 5-aza-dC treatment. Pathway prediction modelling revealed that multiple HOX genes, genes associated with Wnt-signalling pathway and those associated with cell differentiation were differentially expressed after 5-aza-dC treatment. From this experiment we selected six genes (HOXA4, HOXD4, HOXD8, HOXD12, CD9 and RGS2) on the basis of previous reports for further quantification in a series of human leukemia cell lines.
2. Materials and Method
2.1. Cells and Reagents
MV4-11, Molm-14, HL-60, THP-1 (all AML derived cell lines) and Jurkat cells (acute lymphoblastic leukemia derived) were originally purchased from ATCC (American Type Culture Collection, Manassas, VA). The cells were cultured with RPMI-1640 media supplemented with 10% FBS at 37˚C and 5% CO2. 5-aza-dC was purchased from Sigma-Aldrich (St. Louis, MO) and stored as a 10 mM stock solution in PBS at –80˚C. They were diluted into cell culture media immediately prior to use.
2.2. MTT Cell Proliferation Assay
Cell proliferation assays using 3-4, 5-dimethylthiazol-2, 5-diphenyltetrazolium (MTT) was performed as described previously [9]. Briefly, 50 µL media was divided into aliquots into triplicate wells of 96-well plates for each 5-aza-dC concentration. Cell suspension in media (50 µL) was added to each well (50 000 cells/well). Plates were incubated for 48 hours at 37˚C in 5% CO2, and then the MTT assay was performed according to the manufacturer’s instructions (Roche, Indianapolis, IN).
2.3. Gene Expression and Bioinformatic Analysis
Total RNAs were obtained with TRIzol reagent (Invitrogen, Carlsbad, CA) from untreated MV4-11 cells, cells after 48hr treatment of 5-aza-dC (10 µM), and cells after 48 hr release from the drug. The RNA was then hybridised to Illumina HumanRef-8 BeadChips to quantify gene expression levels. Data were first normalised in BeadStudio software (version 3.0) where values for each sample were subjected to cubic spline normalisation, and the t-test error model was applied to all samples. Data were then imported to GeneSpring Software (version 7.3.1, Agilent) and normalised to control for the variation in detection efficiency between gene signals. Using bioinformatic prediction modelling (available at http://genome. ucsc.edu), we determined whether the influenced genes were associated with a CpG islands. Significant pathways were identified using the DAVID (Database for Annotation, Visualization and Integrated Discovery) Functional Annotation Tool and KEGG pathway analysis [10]. A modified Fisher Exact P-value and false discovery rates (Benjamini-Hochberg) were generated from the DAVID Functional Annotation Tool.
2.4. Gene Expression Assay by Real-Time PCR
Total RNA from MV4-11, Molm-14, HL-60, THP-1 and Jurkat cells was isolated for QPCR experiments using the RNeasy kit (Qiagen, Valencia, CA) according to the manufacturer’s instructions. Complementary DNA was produced from RNA by treatment with reverse transcripttase using standard procedures. SYBR Green-based QPCR was performed using an ABI 7500 Real Time PCR System and threshold cycle (Ct) results were calculated using the manufacturer’s software (Applied Biosystems, Carlsbad, CA). We used Power SYBR Green PCR master mix from Applied Biosystems (Carlsbad, CA). Single time-point results were reported as a ΔCt (gene Ct – β-actin Ct), and fold differences were calculated as 2(−ΔCt) after statistical analysis.
2.5. Methylation Specific PCR (MSP)
Sodium bisulfite treatment of genomic DNA is known to convert unmethylated cytosines to uracil bases whereas methylated cytosines are protected from the conversion, thus enabling PCR amplification of CpG segments to be methylation specific [11]. Total genomic DNA were treated with sodium bisulfite using EpiTect Bisulfite Kit (Qiagen). PCR was carried out following the protocol written for methylation-specific PCR (MSP) by Licchesi and Herman [12]. Post-bisulfite-treated methylationspecific primers for the promoter region of CD9 was based on previously published MSP data, whereas primers for post-bisulfite-treated unmethylation-specific for CD9 were custom designed using MethPrimer program [13,14] (Supplementary Table 1).
3. Results
3.1. 5-Aza-dC Induce Growth Inhibition of MV4-11 Cells
Using the MTT proliferation assay, we first sought whether 5-aza-dC could induce cell growth inhibition in the leukemic cell lines. Cells were incubated for 48 hr in different concentrations of 5-aza-dC. Dose-dependent growth inhibition was observed in all leukemic cells (Figure 1). Our findings indicate that 5-aza-dC is a weaker inducer of cell growth inhibition in Jurkat cells compared
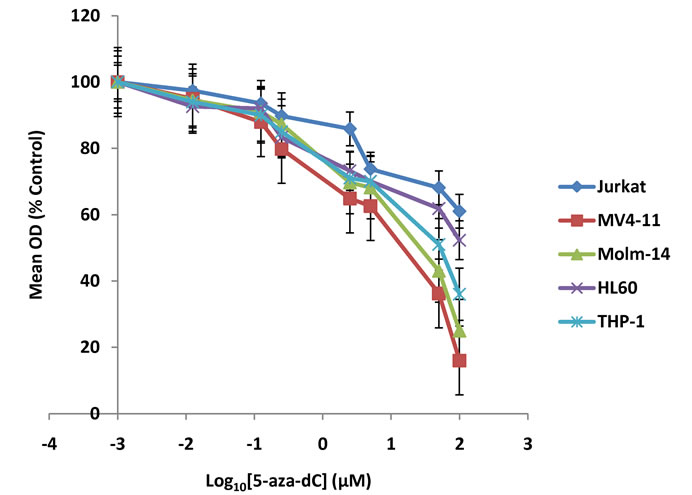
Figure 1. MTT cell proliferation assay. 5-aza-dC induces cell growth inhibition in various leukemic cells. MV4-11, Molm- 14, THP-1, HL-60, and Jurkat cells were incubated with increasing concentrations of 5-aza-dC. The concentration of the drug was represented as a logarithmic scale in x-axis. The graph shows cell growth inhibition assessed by MTT assay after treatment of the drug for 48 hours (P < 0.01).
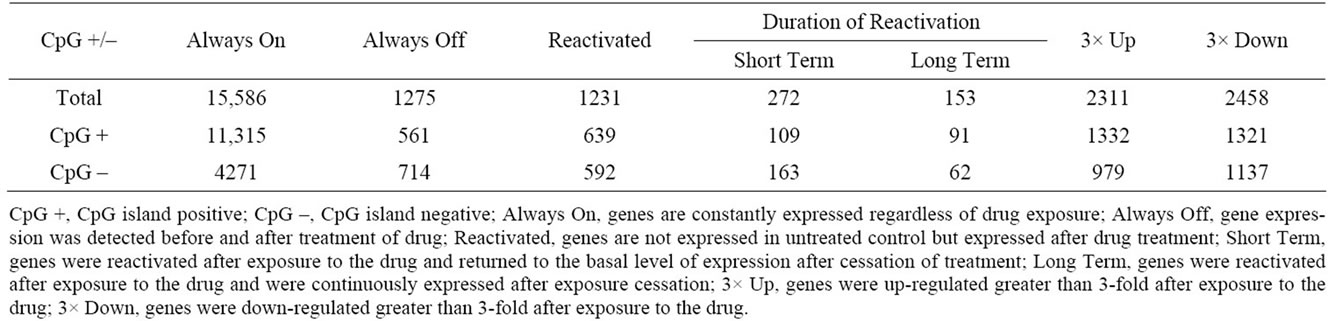
Table 1. Number of genes changed after exposure to 5-aza-dC in MV4-11 cells.
to AML cell lines (HL-60, THP-1, MV4-11 and Molm- 14). Furthermore, 5-aza-dC induces relatively greater growth inhibition in MV4-11 cells compared to the other AML cells tested (Figure 1).
3.2. Influence of 5-Aza-dC on Gene Expression in MV4-11 Cells
To better understand the role of 5-aza-dC, gene expression profiles of MV4-11 cells treated with the drug were examined and compared to non-treated cells as described in the Methods section. We catalogued genes according to their pattern of gene expression changes and the number of genes is displayed in Table 1. Since many tumour suppressor genes are silenced by DNA hypermethylation, we first interrogated genes that were known to be silent in untreated control cells but expressed after exposure to 5-aza-dC. These genes are referred to as “reactivated genes”. We next sought relative gene expression changes which were up-regulated (3-fold) or down-regulated (3- fold) after exposure to the drug. The number of genes associated with a CpG island is indicated below each group in Table 1. We found that the resulting gene expression patterns following 5-aza-dC treatment are not always dependant on the presence of a CpG island.
Unsupervised clustering analysis was performed from data generated from untreated MV4-11 cells, two days after exposure to 5-aza-dC, and two days after cessation of exposure in cell culture. Cells at each time point with/without drug display differential gene expression profiles (Figure 2A). In addition to Short Term re-activated genes (Table 1), we determined which genes could be ‘reversibly’ affected by the drug. Gene entities were filtered based on the fold change and considered significant if it was greater than an absolute 2-fold change after drug treatment and returned to basal levels after drug withdrawal. Using the filtered gene entities, we generated a heatmap to display the corresponding genes (Figure 2B). These genes are likely to be primarily affected by 5-aza-dC in their expression. We found that several genes in the heatmap of Figure 2B have been previously reported to be involved in AML such as p15 (CDKN2B) [15].
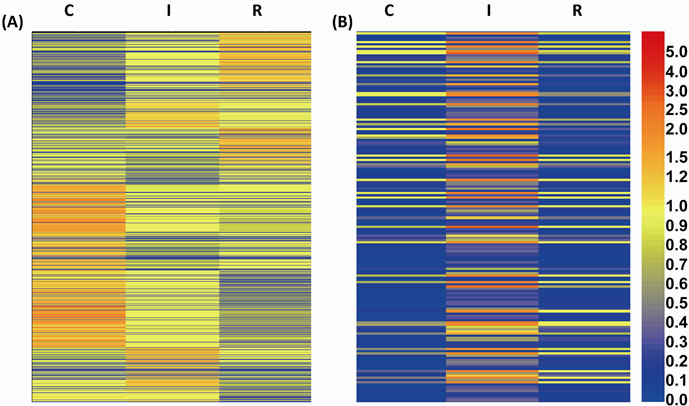
Figure 2. Gene expression changes in MV4-11 cells after 5-aza-dC treatment. Hierarchical clustering of differentially expressed genes comparing untreated control (marked as “C”), after inhibition by 5-aza-dC (marked as “I”), and release from 5-aza-dC after treatment (marked as “R”) in MV4-11 cells. (A) Heatmap of expression levels of all clustered genes at three different status of the cells; (B) The clustered genes of which expression are relatively increased (2-fold or greater) after 5-aza-dC treatment and return to their basal level after release from 5-aza-dC are shown.
We next performed KEGG pathway and Gene Ontology analysis from differentially expressed genes obtained from microarray data. This analysis revealed the most highly affected biological pathways relevant to disease specific reactivated genes and differentially expressed genes (Table 2).
3.3. QPCR Confirmation of Microarray Data
Validation of the microarray data was undertaken using a series of leukemic cell lines (HL-60, Jurkat, THP-1, Molm-14, and MV4-11 cells). On the basis of previous reports implicating a series of genes in leukemogenesis, six genes (HOXA4, HOXD4, HOXD8, HOXD12, CD9 and RGS2) were selected for the further analysis by QPCR. We confirmed multiple HOX genes were reactivated greater than 50-fold after 5-aza-dC treatment in MV4-11 cells. These four HOX genes were also highly reactivated in two of the AML cell lines, Molm-14 and THP-1 cells whereas in HL-60 and Jurkat cells a lower fold-change was observed except for the reactivation of HOXD4 in
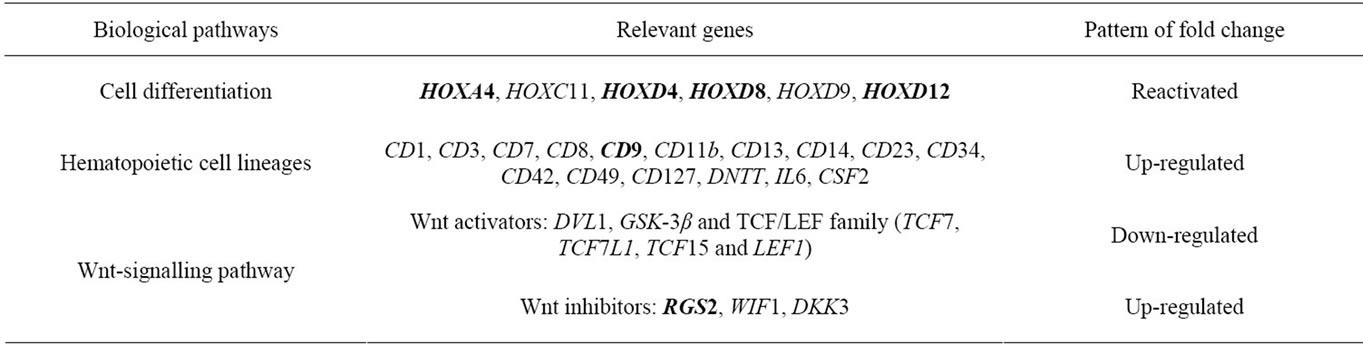
Table 2. Summary of the most highly affected biological pathways which appear to be relevant to leukemic phenotype in MV4-11 cells after exposure to 5-aza-dC. Six genes selected for further study by QPCR are indicated in bold.
Jurkat cells. We also confirmed relatively higher upregulation of CD9 and RGS2 after 5-aza-dC treatment in MV4-11, Molm-14 and THP-1 cells compared to HL-60 and Jurkat cells (Figure 3B). Taken together, gene expression changes in our six selected genes from Table 2 were highly correlated with microarray data (Figure 3).
3.4. Methylation-Specific PCR (MSP) Revealed Hypermethylation of Promoter Region of CD9 at Base Line, and Relative Decrease in Methylation after 5-Aza-dC Treatment
In order to validate the findings from microarray and QPCR and verify that the expression of the genes could be linked to gene promoter hypermethylation, we performed methylation-specific PCR (MSP) on MV4-11 cells. We selected CD9 for further analysis by MSP as it has been shown to be silenced by promoter hypermethylation in approximately 75% of cases of AML cases harbouring the t (8;21) translocation [16], although MV4-11 does not harbour t (8;21). Analysis of CD9 genomic architecture (using the “CpG island searcher” available at http://cpgislands.usc.edu/) revealed dense CpG islands. MSP analysis revealed strong methylation of the CD9 promoter in MV4-11 cells (Figure 4), with reduced methylation in the same promoter region after 5-aza-dC treatment. Further, methylation of the CD9 promoter was reversed and almost undetectable in MV4-11 cells after 5-aza-dC treatment, whereas unmethylation-specific amplicons were increased. Thus, this result suggests that the reversal of methylation of the CD9 promoter is the most likely mechanism of gene re-expression after 5-aza-dC treatment.
4. Discussion
The treatment of MV4-11 cells with the demethylating agent 5-aza-dC not surprisingly reactivated and up-regulated the expression of many genes. Here we identify the molecular pathways evoked in a leukemic cell line treated with 5-aza-dC to gain some insights of the events underlying successful drug therapy.
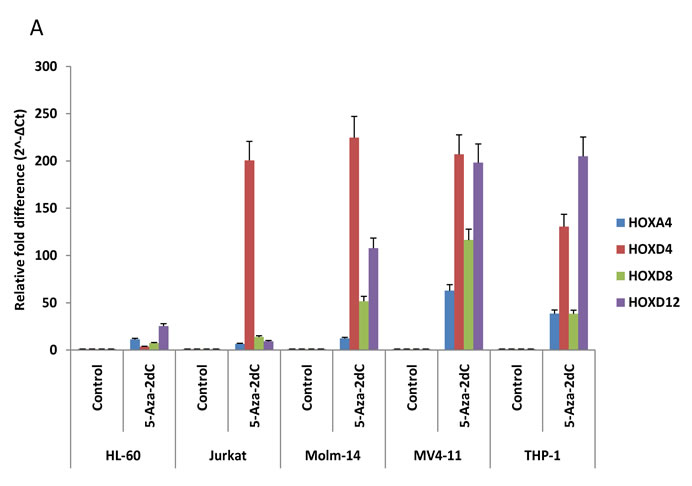
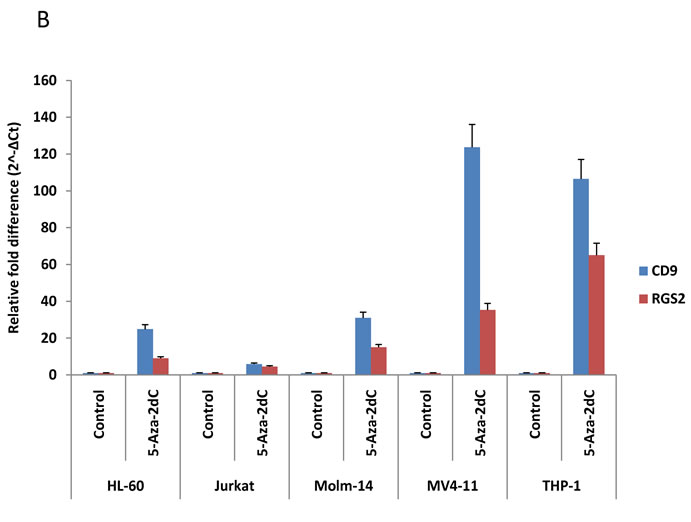
Figure 3. QPCR validates microarray data. The six genes (HOXA4, HOXD4, HOXD8, HOXD12, CD9 and RGS2) described in Table 2 were analyzed by QPCR on total RNA from MV4-11, Molm-14, THP-1, HL-60 and Jurkat cells before and after 10 µM of 5-aza-dC treatment. We first obtained ΔCt (gene Ct—β-actin Ct) from Ct values of each gene for normalization and then ΔCt values were converted to relative gene expression using the 2-ΔCt method. Graph was presented to show relevant gene expression fold differences after treatment of the drug compared with untreated control (=1). The results show the mean and standard deviation for triplicate QPCR results from three independent experiments (P < 0.01).
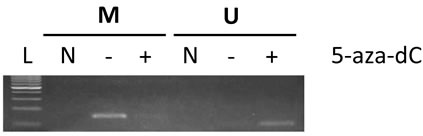
Figure 4. Methylation-specific PCR demonstrates preferential promoter methylation of CD9 in MV4-11 cells and effect on DNA methylation after 5-aza-dC treatment. Genomic DNA from MV4-11 cells was obtained before and after 10 µM of 5-aza-dC treatment for 48 hrs and then the purified DNA was treated with sodium bisulfite to specifically convert unmethylated cytosines to uracil. MSP was performed after purification of bisulfite-treated DNA using specific primers. PCR primers for anticipated post-bisulfite-methylated (M) and unmethylated (U) promoter sequences for CD9 was used to determine its methylation status. The anticipated amplicon sizes for M and U are 153 bp and 110 bp respectively. L, 100 bp DNA ladder; N, non-template control; M, post-bisulfite methylated DNA specific primer used; U, post-bisulfite unmethylated DNA specific used.
Our results revealed that several HOX genes are potentially suppressed by DNA hypermethylation in AML cells. Because over-expression of multiple HOX genes has been identified in both lymphoid and myeloid malignancies, the potential mechanisms leading to increased HOX gene expression have been widely studied [17]. However, possible suppression of HOX genes by DNA hypermethylation is not clearly understood. Recently, aberrant suppression of HOX genes by DNA hypermethylation in their promoter region have been found in various cancer models including leukemia [18]. Since all HOX genes in our reactivated gene list harbor CpG islands, our results suggest that multiple HOX genes may be silenced by possible DNA hypermethylation in AML cells and that their reactivation can be induced after exposure to 5-aza-dC. In addition, HOXD8 and HOXD12 were members of our “Short Term” list in Table 1 and the heatmap in Figure 2B, suggesting these two genes are reversibly regulated by DNA methylation of their promoter region. Although many types of genes were reactivated or upregulated by 5-aza-dC, intriguingly the pathways which are down-regulated by drug treatment also appear to be relevant. Several members of the Wnt-signalling pathway were down-regulated by greater than 3-fold after 5-aza-dC treatment (Table 2). It has been reported that Wnt pathway activation is associated with leukemic transformation and adverse outcome in patients with AML [19,20]. While genetic alterations of the Wnt pathway are infrequent in AML, inhibitors of this pathway appear to be silenced by promoter methylation [19,21]. We found that several major genes involved in the Wnt pathway including RGS2 were differentially expressed after exposure to 5-aza-dC. Previous gene expression analyses in several myeloid cell lines showed induction of RGS2 expression during granulocytic differentiation [22]. Further, it has been reported that epigenetic repression of RGS2 promotes prostate cancer cell growth [23]. Our microarray and QPCR data showed RGS2 is suppressed in leukemic cells and up-regulated after treatment of 5-aza-dC suggesting that targeting Wnt-signaling may be valuable in treating leukemia.
Among potential candidate tumor suppressor genes upregulated by 5-aza-dC, we identified CD9, a 24-kD transmembrane protein, belonging to the tetraspanin superfamily of surface molecules, which have been shown to play a role in normal megakaryocytic differentiation [24,25]. CD9 has been reported to be epigenetically suppressed in specific AML subsets [16] and multiple myeloma [26], and myelodysplastic CD34+ cells [14]. Our study showed CD9 is suppressed in AML cells and was upregulated after 5-aza-dC treatment. Further, our MSP study confirmed that CD9 is one of the epigenetically silenced genes in MV4-11 cells by DNA hypermethylation and that this can be reversed by hypomethylating reagent, 5-aza-dC. Through our global gene expression study, we have found that several important biological pathways are dysregulated in leukemic cells. These multiple malignancies could potentially be utilized to better understand molecular events underlying successful drug therapy in leukemia.
5. Acknowledgements
This study was supported by funds from the University of Newcastle (G0188118) and the Hunter Medical Research Institute (G0188477).
REFERENCES
- H. Suzuki, E. Gabrielson, W. Chen, R. Anbazhagan, M. Van Engeland, M. P. Weijenberg, J. G. Herman and S. B. Baylin, “A Genomic Screen for Genes Upregulated by Demethylation and Histone Deacetylase Inhibition in Human Colorectal Cancer,” Nature Genetics, Vol. 31, No. 2, 2002, pp. 141-149. doi:10.1038/ng892
- J. P. Issa and H. M. Kantarjian, “Targeting Dna Methylation,” Clinical Cancer Research, Vol. 15, No. 12, 2009, pp. 3938-3946. doi:10.1158/1078-0432.CCR-08-2783
- H. I. Saba, “Decitabine in The treatment of Myelodysplastic Syndromes,” Therapeutics and Clinical Risk Management, Vol. 3, No. 5, 2007, pp. 807-817.
- Y. Oki, H. M. Kantarjian, V. Gharibyan, D. Jones, S. O’Brien, S. Verstovsek, J. Cortes, G. M. Morris, G. Garcia-Manero and J. P. Issa, “Phase II Study of Low-Dose Decitabine in Combination with Imatinib Mesylate in Patients with Accelerated or Myeloid Blastic Phase of Chronic Myelogenous Leukemia,” Cancer, Vol. 109, No. 5, 2007, pp. 899-906. doi:10.1002/cncr.22470
- S. Frohling, C. Scholl, D. G. Gilliland and R. L. Levine, “Genetics of Myeloid Malignancies: Pathogenetic and Clinical Implications,” Journal of Clinical Oncology, Vol. 23, No. 26, 2005, pp. 6285-6295. doi:10.1200/JCO.2005.05.010
- R. A. Padua, A. McGlynn and H. McGlynn, “Molecular, Cytogenetic and Genetic Abnormalities in MDS and Secondary AML,” Cancer Treatment and Research, Vol. 108, No. 1, 2001, pp. 111-157. doi:10.1007/978-1-4615-1463-3_8
- P. Fenaux, G. J. Mufti, E. Hellstrom-Lindberg, V. Santini, N. Gattermann, U. Germing, G. Sanz, A. F. List, S. Gore, J. F. Seymour, H. Dombret, J. Backstrom, L. Zimmerman, D. McKenzie, C. L. Beach and L. R. Silverman, “Azacitidine Prolongs Overall Survival Compared with Conventional Care Regimens in Elderly Patients with Low Bone Marrow Blast Count Acute Myeloid Leukemia,” Journal of Clinical Oncology, Vol. 28, No. 4, 2009, pp. 562-569. doi:10.1200/JCO.2009.23.8329
- Y. Oki and J. P. Issa, “Epigenetic Mechanisms in AML— A Target for Therapy,” Cancer Treatment and Research, Vol. 145, No. 1, 2010, pp. 19-40. doi:10.1007/978-0-387-69259-3_2
- K. T. Kim, K. Baird, J. Y. Ahn, P. Meltzer, M. Lilly, M. Levis and D. Small, “Pim-1 Is Up-Regulated by Constitutively Activated FLT3 and Plays a Role in FLT3-Mediated Cell Survival,” Blood, Vol. 105, No. 4, 2005, pp. 1759-1767. doi:10.1182/blood-2004-05-2006
- W. Huang Da, B. T. Sherman and R. A. Lempicki, “Systematic and Integrative Analysis of Large Gene Lists Using DAVID Bioinformatics Resources,” Nature Protocols, Vol. 4, No. 1, 2009, pp. 44-57.
- J. G. Herman, J. R. Graff, S. Myohanen, B. D. Nelkin and S. B. Baylin, “Methylation-Specific PCR: A Novel PCR Assay for Methylation Status of CpG Islands,” Proceedings of the National Academy of Sciences of the United States of America, Vol. 93, No. 18, 1996, pp. 9821-9826. doi:10.1073/pnas.93.18.9821
- J. D. Licchesi and J. G. Herman, “Methylation-Specific PCR,” Methods in Molecular Biology, Vol. 507, No. 1, 2009, pp. 305-323. doi:10.1007/978-1-59745-522-0_22
- L. C. Li and R. Dahiya, “MethPrimer: Designing Primers for Methylation PCRs,” Bioinformatics, Vol. 18, No. 11, 2002, pp. 1427-1431. doi:10.1093/bioinformatics/18.11.1427
- M. Giachelia, F. D’Alo, E. Fabiani, N. Saulnier, A. Di Ruscio, F. Guidi, S. Hohaus, M. T. Voso and G. Leone, “Gene Expression Profiling of Myelodysplastic CD34+ Hematopoietic Stem Cells Treated in Vitro with Decitabine,” Leukemia Research, Vol. 35, No. 4, 2011, pp. 465- 471. doi:10.1016/j.leukres.2010.07.022
- E. E. Cameron, S. B. Baylin and J. G. Herman, “p15 (INK4B) CpG Island Methylation in Primary Acute Leukemia Is Heterogeneous and Suggests Density as a Critical Factor for Transcriptional Silencing,” Blood, Vol. 94, No. 7, 1999, pp. 2445-2451.
- J. C. Desmond, S. Raynaud, E. Tung, W. K. Hofmann, T. Haferlach and H. P. Koeffler, “Discovery of Epigenetically Silenced Genes in Acute Myeloid Leukemias,” Leukemia, Vol. 21, No. 5, 2007, pp. 1026-1034.
- C. Abramovich and R. K. Humphries, “Hox Regulation of Normal and Leukemic Hematopoietic Stem Cells,” Current Opinion in Hematology, Vol. 12, No. 3, 2005, pp. 210-216. doi:10.1097/01.moh.0000160737.52349.aa
- G. Strathdee, A. Sim, A. Parker, D. Oscier and R. Brown, “Promoter Hypermethylation Silences Expression of the HoxA4 Gene and Correlates with IgVh Mutational Status in CLL,” Leukemia, Vol. 20, No. 7, 2006, pp. 1326-1329. doi:10.1038/sj.leu.2404254
- E. A. Griffiths, S. D. Gore, C. Hooker, M. A. McDevitt, J. E. Karp, B. D. Smith, H. P. Mohammad, Y. Ye, J. G. Herman and H. E. Carraway, “Acute Myeloid Leukemia Is Characterized by Wnt Pathway Inhibitor Promoter Hypermethylation,” Leukemia and Lymphoma, Vol. 51, No. 9, 2010, pp. 1711-1719. doi:10.3109/10428194.2010.496505
- N. I. Khan and L. J. Bendall, “Role of WNT Signaling in Normal and Malignant Hematopoiesis,” Histology and Histopathology, Vol. 21, No. 7, 2006, pp. 761-774.
- A. Valencia, J. Roman-Gomez, J. Cervera, E. Such, E. Barragan, P. Bolufer, F. Moscardo, G. F. Sanz and M. A. Sanz, “Wnt Signaling Pathway Is Epigenetically Regulated by Methylation of Wnt Antagonists in Acute Myeloid Leukemia,” Leukemia, Vol. 23, No. 9, 2009, pp. 1658-1666. doi:10.1038/leu.2009.86
- J. Schwable, C. Choudhary, C. Thiede, L. Tickenbrock, B. Sargin, C. Steur, M. Rehage, A. Rudat, C. Brandts, W. E. Berdel, C. Muller-Tidow and H. Serve, “RGS2 Is an Important Target Gene of Flt3-ITD Mutations in AML and Functions in Myeloid Differentiation and Leukemic Transformation,” Blood, Vol. 105, No. 5, 2005, pp. 2107- 2114. doi:10.1182/blood-2004-03-0940
- D. W. Wolff, Y. Xie, C. Deng, Z. Gatalica, M. Yang, B. Wang, J. Wang, M. F. Lin, P. W. Abel and Y. Tu, “Epigenetic Repression of Regulator of G-Protein Signaling 2 Promotes Androgen-Independent Prostate Cancer Cell Growth,” International Journal of Cancer, Vol. 130, No. 7, 2012, pp. 1521-1531. doi:10.1002/ijc.26138
- D. Clay, E. Rubinstein, Z. Mishal, A. Anjo, M. Prenant, C. Jasmin, C. Boucheix and M. C. Le Bousse-Kerdiles, “CD9 and Megakaryocyte Differentiation,” Blood, Vol. 97, No. 7, 2001, pp. 1982-1989. doi:10.1182/blood.V97.7.1982
- C. Boucheix and E. Rubinstein, “Tetraspanins,” Cellular and Molecular Life Sciences, Vol. 58, No. 9, 2001, pp. 1189-1205. doi:10.1007/PL00000933
- G. Heller, W. M. Schmidt, B. Ziegler, S. Holzer, L. Mullauer, M. Bilban, C. C. Zielinski, J. Drach and S. Zochbauer-Muller, “Genome-Wide Transcriptional Response to 5-Aza-2’-deoxycytidine and Trichostatin a in Multiple Myeloma Cells,” Cancer Research, 68, No. 1, 2008, pp. 44-54. doi:10.1158/0008-5472.CAN-07-2531
NOTES
*Corresponding author.