iBusiness
Vol.5 No.1(2013), Article ID:28966,11 pages DOI:10.4236/ib.2013.51001
Does Cluster Membership Enhance Financial Performance?
![]()
Baruch College, The City University of New York (CUNY), New York, USA.
Email: William.ruland@baruch.cuny.edu
Received January 24th, 2013; revised February 25th, 2013; accepted March 3rd, 2013
Keywords: Industry Clusters; Financial Performance
ABSTRACT
This paper reports upon the profitability of firms that locate their headquarters in same-industry geographic concentrations or clusters and those that opt to maintain headquarters in other locations. While the preponderance of the theoretical and descriptive literature emphasizes the potential benefits associated with clustering, some papers suggest that clustering should not be beneficial, at least for particular types of firms in particular circumstances. This empirical study, which examines a sample of more than 4000 Compustat firms from 86 different industries, compares the profitability of firms in industry clusters and firms in other locations. The sample is partitioned into small and large firms to account for expected differences in profitability, in general, and the possible differential impact of geographic clustering. The results show that for smaller firms, the profitability of cluster members tends to be considerably lower than for firms that opt not to join clusters. For the subsample of larger firms, the results are mixed depending upon the measure of profitability. The results imply that smaller firms should carefully evaluate the decision to locate in industry clusters.
1. Introduction
Numerous papers including Ellison and Glaeser (1997) [1] and Shilton and Stanley (1999) [2] document the tendency of businesses to concentrate their headquarters in geographically proximate industry groupings or clusters. Notable examples include the oil and gas industry in Texas, the concentration of micro-technology and venture capital concentrations in the Silicon Valley, and the advertising, media service, and financial clusters in New York City.
Industries concentrate for a variety of reasons. Historically, firms concentrated to benefit from nearby natural resources such as oil and harbors. Other reasons for clusters include the availability of trained labor, the availability of specialized business services, and the enhanced ability to obtain information, including current and planned actions of competitors. Along these lines, Shilton and Stanley (1999) [1] describe Houston, Texas “as clearly a one-industry town, oil and gas.” They suggest that “Houston exemplifies the desire and need to be close to the headquarters of the competition.”
This paper investigates the association between cluster membership and financial performance for a large sample of US firms. The interest is in headquarters clusters rather than concentrations of operating units. The rationale for focusing upon corporate headquarters is that potential information spillover benefits should relate not only to technology, but also to corporate strategy, decisionmaking, and overall corporate culture at the levels of top management.
The extensive theoretical and descriptive literature that addresses industry concentration generally supports the notion that firms benefit through membership in geographic clusters. Extant empirical studies, which typically include only a single industry or small set of industries, however, do not suggest that cluster firms are more profitable than other firms. The results of the large sample examination reported here show that clustering may be detrimental in that smaller-size cluster firms are less profitable than firms that opt not to join clusters. These findings provide insights on the relative costs and benefits of cluster membership and as such, have implications for the financial and strategic management of firms.
The next section reviews pertinent theoretical and empirical literature. Following this we present the study design, data, and results.
2. Background
2.1. Potential Benefits
2.1.1. Transport Costs
Historically, a major reason for business concentration was the desire to benefit from access to nearby natural resources. Marshall (1920) [3], for example, in an early paper, discusses clusters in the context of transport costs the costs of moving goods, people, and ideas. As examples, seafood packaging, lumber processing, and other industries tend to concentrate near the sources of supply to reduce shipping costs and possible spoilage.
2.1.2. Growth and Entrepreneurial Endeavors
Delgado, Porter, and Stern (2010) [4] discuss the potential advantages of cluster membership in the context of growth and entrepreneurial endeavors. In their view, clusters contribute to region and industry growth by facilitating operational efficiency and raising the returns to businesses. Specifically, clusters facilitate new business formation and the growth of successful start-ups. They may also provide enhanced opportunities for entering new market segments.
2.1.3. Specialists and Information
Davis and Henderson (2008) [5] cite the advantages of specialists who can provide information, advice, and services in areas such as law, advertising, and finance. They note that acquiring information and services involves repeated face-to-face interaction and close proximity between buyers and sellers. Folta, et al. (2006) [6] cite the importance of regional institutions such as including universities, distributors, specialized consulting, market research, testing services, angel investors, and venture capitalists and note that these institutions provide advice and services which the regions’ businesses often cannot afford individually.
2.1.4. Evolution of Clusters
Krugman (1986) [7] attributes the development and potential success of clusters to two sets of different, but not necessarily conflicting, circumstances. One is that clusters evolve accidentally and sometimes through actions of non-cluster competitors. As one example, the Mercedes Benz Corporation withdrew from racing, thereby fostering the emergence of the now-concentrated British motor sport industry (as discussed in Pinch and Henry, 1999) [8]. Krugman further suggests that external scale economies associated with large industry concentrations sustain clusters following their establishment. Scale economies, in Krugman’s view, result from labor market pooling, specialist suppliers, and knowledge spillovers.
2.1.5. Spillover
Spillover refers to the tendency for knowledge to “spill over” for exploitation by others. The potentially beneficial effects of informal information exchanges between technical and managerial employees of competing firms may well be the most significant advantage of clusters, particularly for technology-dependent businesses. Much of the recent literature emphasizes the role of knowledge spillover, the transmission of knowledge. Baptista and Swann (1998) [9] suggest that knowledge-related inputs can come from competitors, firms in related industries, suppliers, customers, and other entities carrying out research, such as universities and public-funded institutions. DeCarolis and Deeds (1999) [10] suggest that for biotech companies, research capabilities are the most valuable assets. These resources stem from knowledge bases which need to be continuously nurtured and developed. They go on to suggest that much of the value accompanying the qualified labor pool and specialized suppliers that characterize clusters comes from the associated flow of knowledge.
We generally think of spillover in the context of R&D. However, information exchanges, even in non-technical businesses, can foster awareness of changes in market conditions, awareness of new developments in management strategy, and can facilitate the monitoring of competitors (Sorenson & Audia, 2000 [11]; Davis and Henderson, 2008) [5]. Pinch and Henry (1999) [8], in the previously referenced study of factors contributing to the development and dominance of the British racing car industry, document the positive effects of knowledge spillovers. They characterize this cluster as a “community of knowledge.”
Along similar lines, Porter (1998) [12] suggests that clusters can increase productivity by improving access to specialized inputs and information, by improving incentives and performance measurement, and by contributing to the success of innovation. The increase in informal communication between firms in geographic proximity can also assist managers in understanding market conditions.
The literature suggests that firms in industries with significant R&D requirements benefit relatively more from cluster membership than firms in other industries. However, businesses in industries such as transportation and retailing face continuous competitive pressure and also require innovation and adoptive behavior to remain viable. At a minimum, the spillover associated with industry proximity should better ensure top management awareness of changes in business practices and competitive situations.
2.1.6. Initiators and Receivers
The receivers of spillover should obviously benefit through cluster membership. However, it is less clear that firms in possession of proprietary information should participate in clusters, thereby contributing to the success of competitors.
Yang, Phelps, and Steensma (2010) [13] hypothesize that when an originating firm’s spillovers are recombined with complementary knowledge by recipient firms, a spillover knowledge pool is formed that provides opportunities for originators to learn from recipients. The authors cite the effects of Eastman Kodak Corporation’s interaction with competing firms upon the development of the organic light-emitting diode (OLED) technology. Eastman Kodak developed organic OLED technology in 1985. During the next 15 years, over 30 firms, including Sony and Xerox, exploited Kodak’s efforts by combining its core discovery with other complementary knowledge to generate additional innovations. In the view of the authors, the innovative efforts of these recipient firms seem to have increased Kodak’s opportunities for innovation and enhanced its subsequent innovativeness. Kodak continued to develop innovations embodying OLED technology, innovations which seem to build on the advances made by recipient firms.
Yang et al. test this originator-benefit hypothesis using a sample of patent data. Their results support the notion that spillover provides benefits to originating firms.
2.1.7. Modeling and Descriptive Studies
On a theoretical level, Tallman, Jenkins, Henry, and Pinch (2004) [14] show that, under certain conditions, cluster firms should outperform firms in other locations. The authors suggest that cluster membership is necessary for sustained strategic equality and that nonmembers will find competing for advantage on the basis of component knowledge to be difficult, given the creativity and integration that operates within the cluster.
Other literature illustrates the development and success of specific clusters. The Pinch and Henry (1999) analysis of the British racing car industry was cited earlier. Along similar lines, Saxenian (1994) [15] compares and contrasts the Silicon Valley and Route 128 technology concentrations. She attributes the success of Silicon Valley businesses to a number of factors including positive actions on the part of Stanford University, flexibility, and a culture that encourages risk-taking and accepts failure.
2.1.8. Spillover and Geographic Proximity
One may question the relationship of geographic location and spillover given instantaneous electronic communication and the seemingly unlimited availability of electronic data. However, Evers, et al. (2010) [16] suggest that this view ignores the importance of tacit knowledge. Tacit knowledge refers to things that people do rather than things that they know. This type of knowledge is transmitted more readily on a face-to-face basis. Evers, et al. suggest that tacit knowledge or experience is best transmitted by observation, face-to-face contacts, and learning from doing.
Bell (2005) [17] also provides insights concerning the role of geographic proximity. In summarizing the information-related attributes associated with geographic proximity, he notes that information can be transmitted within the cluster via chance meetings to executives of competing firms. Geographic clusters also facilitate the direct observation of competitors, the ability to exploit collective knowledge, and the increased ability to assess the veracity of information received. Shared common backgrounds and understanding, perhaps obtained through common previous employers, may also facilitate a understanding of information obtained in chance settings.
In summary, membership in industry clusters would seem to be advantageous for a number of reasons. One is the potential for reduced transport costs. Another is the potentially favorable effect upon growth and entrepreneurial activity. Clusters also tend to include industryspecific specialists who can provide, in addition to services, information and advice based upon their knowledge of industry events and facilitates opportunities for face-to-face interaction. The literature suggests that the potential for spillover associated with geographic proximity may serve as the single most important advantage of cluster membership and that spillover should benefit both the firms that have developed technological advances and those that have not.
3. Potential Negative Influences
3.1. The Impression That Clustering May Not Be Beneficial
While the majority of the literature suggests that clustering should be beneficial, some papers suggest that clustering may adversely affect financial performance. Data, to be reported later, indicates that the majority of firms avoid locating in major industry concentrations. Both the Silicon Valley and Boston areas, for example, host concentrations of computer chip businesses. However, a number of large semi-conductor companies in this highly technology-dependent industry maintain headquarters in diverse locations including Portland, Oregon, and Phoenix, Arizona. If these firms believe that clustering is beneficial, we should expect them to join the primary industry clusters. In addition, entire industries including trucking, freight, grocery stores, and department stores show little evidence of headquarters concentrations. WalMart Stores, Inc., for example, is located in Bentonville, Arkansas, a relatively small community. The decision of most firms to avoid cluster memberships suggests that clustering should not enhance financial performance.
3.2. Compensatory Actions
Geographically remote firms should be able to compensate, in part, for their non-central locations through increased reliance upon travel to trade shows, conferences, alumni reunions, and similar networking-oriented events and through the increased use of electronic communications. Some firms, such as Wal-Mart, work with nearby communities of specialized service providers. Other businesses compensate for relatively isolated locations by hiring innovators from other firms and through the formation of alliances (Rosenkopf & Almeida, 2003) [18].
3.3. Reasons to Expect That Clustering May Adversely Impact Performance
The literature sets forth a number of reasons to expect that clustering may adversely affect performance. These include the loss of effectiveness over time, the potential for complacency and inward thinking, firm-specific considerations, and the expected costs associated with the possible loss of proprietary information and key employees.
3.4. Growth and Decline of Clusters
A number of papers discuss the growth and decline of clusters and the reduced likelihood that firms will benefit through membership in declining clusters. Pouder and St. John (1996) [19], for example, consider the rise and fall of “hot spots,” a term that relates to rapidly growing geographic clusters of competing firms. They suggest that while concentrations of same-industry businesses may initially be characterized by high innovation and sometimes dramatic growth, these clusters eventually decline. Along these lines, a number of papers, including Delgado, Porter, and Stern (2010), note the potential adverse impact of congestion effects associated with mature clusters—increases in the costs of labor, materials, rents, and other items that may be associated with the growth of large clusters.
Cluster firms may also be subject to complacency and cluster-oriented rather than total-industry thinking. Pouder and St. John (1996) [19] suggest that inward focus within the cluster may cause management to ignore important developments that occur in other geographic locations.
3.5. Differential Benefits
It also seems likely that firms do not benefit equally through cluster membership. Shaver and Flyer, (2000) [20] suggest that firms with the best human capital, technologies, training programs, suppliers, and other assets will gain little and suffer the most through spillover to competitors. They note that firms that locate in clusters are more susceptible to technology spillover, loss of employees to competing firms, and sharing of suppliers, distributors, and other resources. Consequently Shaver and Flyer hypothesize that the best performing firms will choose not to cluster.
Wennberg and Lindqvist (2010) [21] indicate that while some studies find that clusters enhance the probability of entry, survival, and growth of new firms, other studies indicate that cluster membership decreases the likelihood that new firms will survive. One possibility is that strong clusters may often be characterized by congestion and hyper-competition among firms. Another is that clusters arise from easier access to resources for launching a new firm and from exaggerated expectations of success due to skewed perceptions of entrepreneurial opportunities, leading to an increase in start-up rates.
The desire to minimize costs may also be responsible for cluster avoidance on the part of most firms. Although firms may benefit through membership in clusters, the costs of maintaining headquarters in high wage and rent areas such as the Silicon Valley and New York City likely tend to keep some firms away from these same areas. Firms may also elect to maintain headquarters in remote locations in the belief that indirect costs will outweigh the benefits. Indirect costs include the inadvertent leakage of valuable proprietary information to competitors and the increased likelihood that competitors will tap top employees. While firms in clusters may find it easier to raid competitor’s employees, raiders are also more vulnerable. Similarly, locating in proximity to competitors increases the likelihood that these competitors will obtain trade secrets. Consequently, it isn’t clear that the net effect of clustering is positive, particularly for cluster members with valuable employees and proprietary information.
In summary, if cluster members outperform other firms, we should expect to observe that the majority of firms are members of industry clusters. This is not the case. The literature also suggests a number of reasons to expect that cluster members should not outperform other firms. These include the loss of cluster effectiveness over time, the potential for complacency and inward thinking, firm-specific considerations, and the expected costs associated with the possible loss of proprietary information and key employees.
4. Empirical Relationships
A number of empirical papers examine associations between clustering and various indicators of business performance. These studies, which tend to focus upon patents and other measures of innovation, generally reveal that firms in clusters outperform other firms.
4.1. R&D, Patents, and Innovation
Jaffe (1986) [22] examines the association between R&D expense, patents, and profitability. His data, which include 573 firms in a variety of industries for the years 1972 and 1978, suggest that firms which conduct research in areas where neighboring firms also conduct research tend to have more patents per dollar of R&D. These cluster firms also generate higher returns, results consistent with positive spillover effects.
Audretsch and Feldman (1996) [23] examine a database consisting of 8074 commercial innovations introduced in the United States during 1982. The investigation shows that the vast majority of the commercial innovations developed in 1982 occurred in firms that maintain headquarters on either the east or west coasts. In the computer industry, for example, over 50% of the innovations occurred in just two states, California and Massachusetts. One interpretation is that industry concentration is associated with successful R&D activity. The authors also conclude that clustering is more prevalent in industries for which university-generated research, internal R&D, and skilled labor are particularly important.
Baptista and Swann (1998) [9] examine clustering as functions of innovation and same-industry employment in the same geographical area. Using a data base that ranks innovation in the UK, the authors examine 248 manufacturing firms over an 8 year period beginning in 1975. Consistent with the beneficial effects of cluster membership, the results show higher innovation on the part of firms with large same-industry employment in the firm’s home region.
Other papers focus upon patent citations. Jaffe et al. (1993) [24] examine the association between location and patent citations. Patent applications include citations, references to previous patents. The examination of nearly 10,000 citations in 1975 and 1980 shows that, controlling for the influence of other factors, patents tend to reference predecessor patents held by firms in the same general region. These tests, as well as those conducted by Henderson et al. (2005) [25] are consistent with the localized nature of spillover. Gittelman (2007) [26] examined the history of over 7100 collaborative research papers published by employees of 112 biotechnology firms during the period 1975-1984. She finds that the papers are more likely to be cited in patents when authors are geographically concentrated rather than dispersed.
4.2. Cluster Size
Another set of literature examines the impact of cluster size. Folta, Cooper, and Baik (2006) [6] examine the relationship between cluster size and patenting performance for a sample of biotech firms. Specifically, the authors look at the patenting performance of 806 firms over the period 1973-1998. The study reveals a generally positive relationship between cluster size and the development of patents. McCann and Folta (2011) [27] examine the same data base and find that firms with the greatest knowledge stocks, as measured by the number of patent filings, and younger firms benefit relatively more from cluster membership. These findings contrast with the view set forth by Shaver and Flyer (2000) [20] who suggest that the best performing firms will choose not to cluster.
4.3. Entrepreneurship
The empirical literature also addresses the association of clusters and entrepreneurship. Delgado, Porter, and Stern (2010) [4] suggest that clustering reduces startup costs and facilitates entrepreneurship. Their tests track a sample consisting of over 50,000 firms over the period 1990 through 1996. The results show that industries located in regions with a large presence of other related industries experience higher growth in new business formation and start-up employment. They also show that strong clusters contribute to the survival of start-up firms.
The Delgado, Porter, and Stern findings appear to contrast with those reported by Stuart and Sorenson (2003) [28]. Stuart and Sorenson suggest that by locating in established clusters, new firms are proximate to established technical labor pools, providers of specialized services such as law firms, raw materials suppliers, and venture capitalists. Their study of new biotech firm IPOs during the period 1978 to 1995, however, suggests that these firms face intense competition and under-perform firms that choose to locate in more remote locations. The authors conclude that circumstances conducive to new venture formation do not lead to improved financial performance for these new ventures.
4.4. Social Interaction and Investment Sentiment
Pirinsky and Wang (2006) [29] examine the stock returns of over 5000 firms that are headquartered in the same geographic areas during 1988 and examine the monthly stock returns for these firms through the year 2002. They find a strong co-movement of returns, an association that decreases following corporate relocations. The authors suggest that social interaction between investors in the same geographic areas leads to the transmission of information and the development of similar investment sentiment.
4.5. Financial Success
A small group of studies examines various measures of financial success. Shaver and Flyer (2000) [20], in the paper referenced previously, examine new US plants owned by foreign corporations. Their analysis shows that while most of these plants locate in existing clusters, the cluster firms are more likely to fail compared to firms that locate in more remote locations. Pe’er and Vertinsky (2006) [30] employ a different sample of firms and a different methodology in their investigation of new entrepreneurial entrants in the Canadian manufacturing sectors from 1984 to 1998. That study finds that clustered firms have higher survival rates than nonclustered firms. Kukalis (2010) [31], in a study which perhaps corresponds most closely to the present investigation, examined the financial performance of 194 firms in the pharmaceutical and computer chip industries. Since firms in both industries depend heavily upon innovation, that study determines cluster membership on the basis of the location of each firm’s primary R&D facility. The author examined performance data over a 31-year period. Surprisingly, the tests do not reveal any association between profitability and membership within pharmaceutical and computer chip industry R&D clusters. Story and Westhead (2009) [32] test for the association of industry concentration and profitability for a sample of firms concentrated in science parks in the U.K. These parks, which are typically developed and operated by universities, are designed to promote product innovation and advancement for smaller businesses. While science park locations differ from industry concentrations, tenants are typically technology dependent and share some common characteristics. The comparison of 183 science park firms to comparison firms shows that while science park firms show higher sales growth, science park and comparison firms do not differ with respect to profitability.
In summary, an extensive theoretical and descriptive literature addresses the potential advantages associated with clustering. The empirical evidence, however, is industry-specific, consists of relatively small samples of firms, and reports mixed results. Story and Westhead (2009) [32] and Kukalis (2010) [31] find that profitability does not seem to differ as a function of cluster membership. The Story and Westhead firms, however, are not in the same industries and the Kukalis study classifies firms in two industries by R&D rather than headquarters location. On the other hand, the Audretsch and Feldman (1996) [23] examination of innovations suggests that industry concentrations do promote innovation and positively affect the performance of participating firms.
5. Research Design
This study compares the profitability of firms that locate corporate headquarters in industry-specific concentrations and those that opt not to participate in clusters. Other studies have focused upon research locations and manufacturing locations. The interest in corporate headquarters is motivated by the potential benefits of clustering, and information exchanges, in particular, to all levels of management.
The initial sample includes all Compustat firms for the years 2004 through 2009. The observation period, the most recent available at the time of data collection, includes data representing both strong and weak economic conditions. Following the usual procedure in financial studies, we then excluded overseas firms, financials, utilities, companies with less than $1 million in assets, firms in industries with fewer than 10 companies, and firms missing necessary data. The final sample consists of 20,969 firm-years of data (total number of observations) in 86 industries. Over 4000 distinct firms are included.
5.1. Industry Classification
Firms are classified by industry using the Global Industry Classification Standard (GICS), a system developed as a joint undertaking in 1999 by Standard & Poor’s and MSCI/Barra. Bhojraj et al. (2003) [33] show that GICS classifications outperform Standard Industry Codes (SIC) and other classification schemes with respect to their ability to explain stock return co-movements, cross-sectional variations in valuation multiples, forecasted and realized growth rates, R&D expenditures, and key financial ratios. Industries are defined on the basis of 8-digit codes.
We should note that while the assignment of firms to industries on the basis of GICS (or SIC) codes) is objective and convenient, it does have limitations. One is that many firms operate in more than one industry. Boeing Corporation, for example, produces not only commercial airplanes, but also military aircraft, and space systems. Unrelated or loosely related sectors such as these typically use different suppliers, different technology, and vastly different marketing. Unfortunately, industry coding systems necessarily assign Boeing and other multiindustry firms to a single industry.
5.2. Metropolitan Statistical Areas
Adopting the procedure in Pirinsky and Wang (2006) [29], headquarters locations are classified based upon Metropolitan Statistical Areas (MSAs). The Census Bureau (US Census Bureau, 2011) [34] describes MSAs as geographic entities used to collect, tabulate, and publish Federal statistics. A metro area contains a core urban area of 50,000 or more population and a micro area contains an urban core of at least 10,000 (but less than 50,000) population. Each metro or micro area consists of one or more counties and includes the counties containing the core urban area, as well as any adjacent counties that have a high degree of social and economic integration (as measured by commuting to work) with the urban core.
The US Office of Management and Budget (OMB) assigns counties, and in some cases cities and towns, to 374 MSAs. OMB aggregates these into combined statistical areas (CMSAs) for the very largest metropolitan areas. The New York City CMSA, for example, includes parts of 4 states and its Year 2000 population exceeded 21 million people. At the other end of the distribution, fewer than 58,000 people live in the MSA that includes Enid, Oklahoma. This study assigns firms to CMSAs, where available; otherwise to MSAs. The assignments of firms to MSAs use Compustat county information. In cases of missing data, the location information is obtained from other sources.
6. The Data
6.1. Characteristics of the Sample
The sample is comprised of firms in 86 distinct industries. These industries differ considerably in size. The smallest consists of only 52 firm-years and the largest includes 854 firm-years. On average, each industry includes 254 firm-years.
We refer to the metropolitan area with the largest number of firm-years in each industry as the primary cluster. All firms in the industry which are located in this metropolitan area are referred to as cluster members. As a number of industries appear to have large concentrations of firms in more than one location, the study also incorporates an alternative definition of cluster membership. Firms in those metropolitan areas which serve as headquarters for at least 5 other same-industry firms are considered to be members of “regional clusters.” For measurement purposes, our regional clusters require at least 25 firm-years of data in the same industry.
Our analysis separately considers small and large firms. The reason is that larger firms, which are less likely to include startups, tend to be more profitable. We define small firms as those with total assets less than the industry median. Large firms report assets greater than or equal to the industry median. Partitioning on the basis of medians, rather than means, results in equal size subsamples.
6.2. Cluster Membership
Table 1 shows the composition of the sample with respect to cluster membership. Panel A shows that only 22% of firms locate their headquarters in primary clusters. The data also shows that smaller firms are less likely to join clusters. Only 19% of small firms join primary clusters compared to 25% of the large firms.
Panel B shows that cluster membership increases to 38% when we consider both primary and regional clusters. The data shows that smaller firms are also less likely than larger firms to be members of regional clusters. We should note that firms are included in the study only when their respective industries report at least 50 firmyears of data over the observation period. Consequently, the reported percentage of firms that are cluster members actually overstates the percentage for the population of firms, as a whole.
6.3. Cluster Locations
The data show that the extent of clustering varies considerably between industries. We observe that primary cluster sizes range from 14 to 313 firm-years. We also observe that primary clusters tend to be located in the very largest cities. The New York City metropolitan area, for example, hosts 36 of our 86 industries and San Francisco ranks second with 10 primary clusters. Houston follows with 8 clusters, all of which are engaged in various types of oil and gas businesses. These 3 cities host more than 60% of the primary clusters examined in the study. It may seem as though the largest numbers of clusters and the sizes of these clusters correspond to the sizes of cities, in which case, cluster membership would seem to be merely a proxy for the size of the city. This, however, is not necessarily the case. For example, although Philadelphia and Detroit rank as the sixth and eighth largest US metropolitan areas respectively, each of these cities hosts the primary concentration of only one of the 86 industries.
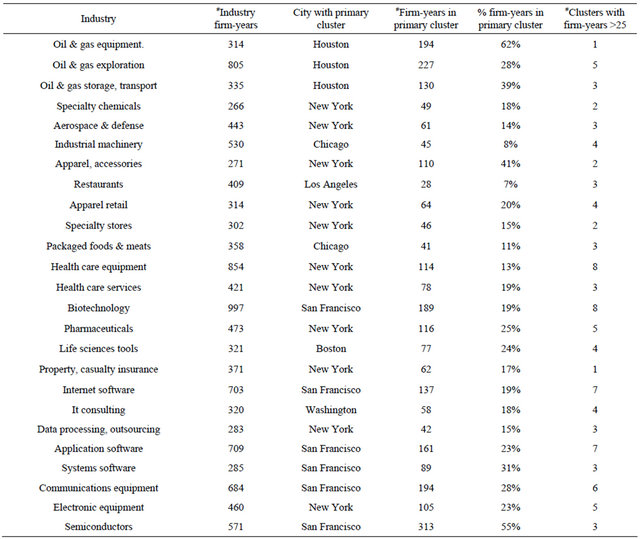
Table 2 shows selected characteristics of the 25 largest industries. For each of these industries, the table shows the number of firm-years, the primary cluster location, the number of firm-years included in the primary cluster, and the percentage of firm-years in the primary cluster, and the number of regional clusters. The industries are shown in CIC Code sequence.
The data show that the largest primary clusters tend to be located in the New York City and San Francisco areas. We also observe that the percentage of firm-years comprising the largest clusters varies from 7% to 62%, a substantial spread. Not surprisingly, the restaurant industry shows a low propensity to cluster, likely due to the regional nature of some restaurant chains and the large variation of restaurant types. It is surprising, however, to observe that only 8% of the industrial machinery firms are located in that industry’s primary cluster. In common with the restaurant industry, this may reflect substantial variation in industry machinery products. Table 2 also shows that while large percentages of firms in the last seven industries are members of the primary clusters, 3 of these industries have at least 4 regional clusters in addition to the primary clusters.
7. Profitability
This section presents data concerning the association of business performance and headquarters location, the primary objective of this paper. Following the majority of predecessor financial studies, profitability is measured as the return on assets (ROA). Due to small reported asset numbers in a number of cases, ROAs are sometimes very large in absolute terms. Consequently, ROAs are truncated at 0.50, when necessary. We also present median
Table 1. Cluster and non-cluster firms.
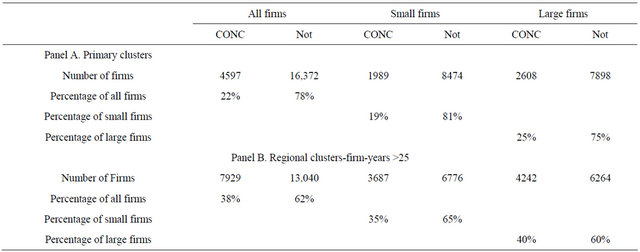
This table shows the distribution of the sample based upon firms that cluster (CONC) and those that do not cluster (Not).
Table 2. Selected industry concentration data for the 25 largest industries.
return, a measure which is less sensitive to outliers.
7.1. Smaller Firms
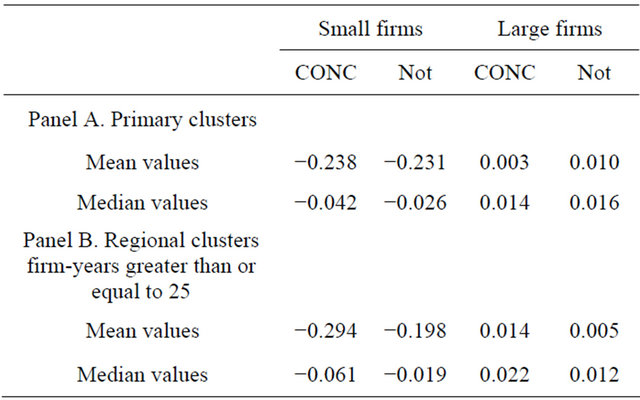
Table 3, Panel A, shows profitability data with respect to primary clusters. Columns 2 and 3 summarize data for the subsample of small firms. We observe that ROAs tend to be negative for the small firms. The median returns are substantially less negative than the mean values, likely because this metric minimizes the impact of very large or very small ROAs. We observe that for the subsample of small firms, the mean ROAs for concentrated, or cluster firms, are −0.102. This compares to −0.93% for firms not located in primary clusters. Addition analysis (not reported) shows that mean returns are influenced by firms with small asset values and that even with truncation, the results differ somewhat as a function with the specific truncation criteria. Consequently, it seems more appropriate to focus on median returns. The median value of smaller firm cluster member returns is −0.023 compared to −0.005 for firms not located in primary clusters.
These data reveal that smaller firms that cluster perform more poorly than firms which choose to maintain headquarters in locations not populated by competing firms. We conducted a two-sample t-test for differences between returns for small firms that cluster and for noncluster firms. This test reveals that ROAs differ between the two groups at the 1% significance level. The magnitudes of differences between cluster and non-cluster members suggest that the difference in profitability is also economically significant.
7.2. Larger Firms
The fourth and fifth columns in Panel A show results for larger firms. While large firms that do not cluster are more profitable than large cluster firms, the performance differential is considerably lower than for the smaller firms. Although the difference between cluster and noncluster firms is statistically significant at the 1% level, the economic significance of the differences is subject to question, particularly when interpreting the relatively small difference in median values.
Panel B compares firms in regional clusters and other firms. While the general pattern of results is the same as in Panel A, the performance differences between cluster and non-cluster firms are more pronounced. In fact, both the mean and median measures of return on investment suggest an economically significant profitability advantage for non-cluster firms.
Previously we summarized a number of papers that relate to the differential effects associated with clusters. Shaver and Flyer [20], (2000) suggest that firms with the best human capital, technologies, training programs, supTable 3. Returns on assets.

This table shows mean and median returns on assets for small firms and large firms (20,969 observations). Two-sample t-tests show that all differences in returns for cluster and non-cluster firms are significant at the 1% level.
pliers, and other assets will gain little and suffer the most through spillover to competitors and suggest hypothesize that the best performing firms will choose not to cluster. In discussing their empirical examination of startup firms, Stuart and Sorenson (2003) [28], opine that new IPOs that locate in clusters face intense competition and underperform firms that choose to locate in more remote locations. They conclude that circumstances conducive to new venture formation do not lead to improved financial performance for these new ventures. Along similar lines, Wennberg and Lindqvist (2010) [21] hypothesize that while cluster membership may facilitate the entry of new firms, these new (and generally smaller firms) will find it difficult to succeed in the midst of strong competition associated with clusters. These data presented above are consistent with these views.
7.3. Industry-Adjusted Returns
We also examine industry-adjusted returns on assets in an effort to separate the effects of individual-firm performance and overall industry performance. The procedure involves determining industry median returns for each of the 86 industries. Industry-adjusted returns are then calculated as the individual firm return less the industry median return. Panel A in Table 4 reveals a pattern similar to that presented in Table 3. The non-cluster firms comprising both the small and large asset size groups generate higher returns than the cluster firms. As with the unadjusted return measure, the performance difference appears to be likely economically significant for the subsample of smaller firms, but not for the larger firms.
Panel B shows industry-relative returns. For the smaller firms, the data generally reflect the same underlying pattern as observed for the unadjusted returns measure except that the difference between cluster and non-cluster firms is more pronounced. The results for the
Table 4. Industry-adjusted returns on assets.
This table shows industry adjusted mean and median returns on assets for small firms and large firms (20,969 observations). Two-sample t-tests show that all differences in returns for cluster and non-cluster firms are significant at the 1% level.
large firms located in regional clusters are different, however, from those reported in Table 3. These larger cluster firms tend to generate higher industry-relative returns compared to non-cluster firms.
Taken as a whole, Tables 3 and 4 data reveal that smaller firm members of both primary and regional clusters do not perform as well firms that avoid clusters. This conclusion contrasts with the situation for larger firms where the differences in returns between cluster and noncluster firms tend to be smaller and where the sign of the differences between returns depends upon the particular measure of profitability. Larger firms in clusters underperform based upon unadjusted ROA, but outperform larger non-cluster firms when returns are adjusted for industry returns. Given these results, it does seem safe to conclude that non-cluster smaller firms outperform those that locate in clusters and that these differences are economically significant. It is more difficult to reach conclusions for the subsample of larger firms given the mixed results obtained from alternative measures of profitability.
8. Conclusions
This paper reports upon the profitability of firms that locate in same-industry geographic clusters and those that opt to maintain headquarters in other locations. While the preponderance of the theoretical and descriptive literature emphasizes the potential benefits associated with clustering, some papers do suggest that clustering should not be beneficial, at least for certain types of firms in certain circumstances.
This empirical study examines a sample of more than 4000 Compustat firms from 86 different industries. Firms located in metropolitan areas which host the greatest numbers of firms in their particular industry are members of primary clusters. Approximately 22% of the sample firms fall into this category. Metropolitan areas which host more than about 10 firms (50 firm-years of observations) are considered to be regional clusters (which include primary clusters). About 38% of the sample firms participate in either primary or regional clusters.
Following the majority of financial studies, profitability is measured as the return on assets. In order to separate the effects of individual company profitability from that of industry profitability, we also calculate industry-adjusted returns on assets. Since the literature shows a relationship between asset size and profitability, we also partition the sample into those with smaller and larger asset size compared to the industry median amount.
The results show that for the set of smaller firms, profitability is considerably lower for firms that cluster compared to firms that opt not to join clusters. The data also show that this difference is both statistically and economically significant. For the sample of larger firms, the results depend upon the measure of profitability. Consequently, it is difficult to draw conclusions based upon these tests. These results imply that smaller firms should carefully evaluate the decision to locate in industry clusters.
REFERENCES
- G. Ellison and E. Glaeser, “Geographic Concentration in US Manufacturing Industries: A Dartboard Approach,” The Journal of Political Economy, Vol. 105, No. 5, 1997, pp. 889-927. doi:10.1086/262098
- L. Shilton and C. Stanley, “Spatial Patterns of Headquarters,” Journal of Real Estate Research, Vol. 17, No. 3, 1999, pp. 341-364.
- A. Marshall, “Principles of Economics,” 8th Edition, Macmillan, London, 1920.
- M. Delgado, M. Porter and S. Stern, “Clusters and Entrepreneurship,” Journal of Economic Geography, Vol. 10, No. 4, 2010, pp. 495-518. doi:10.1093/jeg/lbq010
- J. Davis and J. Henderson, “The Agglomeration of Headquarters,” Regional Science and Urban Economics, Vol. 38, No. 5, 2008, pp. 445-460. doi:10.1016/j.regsciurbeco.2008.05.002
- T. Folta, A. Cooper and Y. Baik, “Geographic Cluster Size and Firm Performance,” Journal of Business Venturing, Vol. 21, No. 2, 2006, pp. 217-242. doi:10.1016/j.jbusvent.2005.04.005
- P. Krugman, “Strategic Trade Policy and the New International Economics,” MIT Press, Cambridge, 1986.
- S. Pinch and N. Henry, “Paul Krugman’s Geographical Economics, Industrial Clustering, and the British Motor Sport Industry,” Regional Studies, Vol. 33, No. 9, 1999, pp. 815-827. doi:10.1080/00343409950075461
- R. Baptista and P. Swann, “Do Firms in Clusters Innovate More?” Research Policy, Vol. 27, No. 5, 1998, pp. 525- 540. doi:10.1016/S0048-7333(98)00065-1
- D. DeCarolis and D. Deeds, “The Impact of Stocks and Flows of Organizational Knowledge on Firm Performance: An Empirical Investigation of the Biotechnology Industry,” Strategic Management Journal, Vol. 20, No. 10, 1999, pp. 953-968. doi:10.1002/(SICI)1097-0266(199910)20:10<953::AID-SMJ59>3.0.CO;2-3
- O. Sorenson and P. Audia, “The Social Structure of Entrepreneurial Activity: Geographic Concentration of Footwear Production in the United States,” American Journal of Sociology, Vol. 106, No. 2, 2000, pp. 424-462. doi:10.1086/316962
- M. Porter, “Location, Clusters, and the ‘New’ Microeconomics of Competition,” Business Economics, Vol. 33, No. 1, 1998, pp. 7-13.
- H. Yang, C. Phelps and H. Steensma, “Learning from What Others Have Learned from You: The Effects of Knowledge Spillovers on Originating Firms,” Academy of Management Journal, Vol. 53, No. 2, 2010, pp. 371-389. doi:10.5465/AMJ.2010.49389018
- S. Tallman, M. Jenkins, N. Henry and S. Pinch, “Knowledge, Clusters, and Competitive Advantage,” Academy of Management Review, Vol. 29, No. 2, 2004, pp. 258-271.
- A. Saxenian, “Lessons from Silicon Valley,” Technology Review, Vol. 97, No. 5, 1994, pp. 42-51.
- H. Evers, S. Gerke and T. Menkhoff, “Knowledge Clusters and Knowledge Hubs: Designing Epistemic Landscapes for Development,” Journal of Knowledge Management, Vol. 14, No. 5, 2010, pp. 678-689. doi:10.1108/13673271011074836
- G. Bell, “Clusters, Networks, and Firm Innovativeness,” Strategic Management Journal, Vol. 26, No. 3, 2005, pp. 287-295. doi:10.1002/smj.448
- L. Rosenkopf and P. Almeida, “Overcoming Local Search through Alliances and Mobility,” Management Science, Vol. 49, No. 6, 2003, pp. 751-766. doi:10.1287/mnsc.49.6.751.16026
- R. Pouder and C. St. John, “Hot Spots and Blind Spots: Geographical Clusters of Firms and Innovation,” The Academy of Management Review, Vol. 21, No. 12, 1996, pp. 1192-1225.
- J. Shaver and F. Flyer, “Agglomeration Economies, Firm Heterogeneity, and Foreign Direct Investment in the United States,” Strategic Management Journal, Vol. 21, No. 4, 2000, pp. 1175-1193. doi:10.1002/1097-0266(200012)21:12<1175::AID-SMJ139>3.0.CO;2-Q
- K. Wennberg and G. Lindqvist, “The Effect of Clusters on the Survival and Performance of New Firms,” Small Business Economics, Vol. 34, No. 3, 2010, pp. 221-241. doi:10.1007/s11187-008-9123-0
- A. Jaffe, “Technological Opportunity and Spillovers of R&D: Evidence from Firms' Patents, Profits and Market Value,” The American Economic Review, Vol. 76, No. 5, 1986, pp. 984-1001.
- D. Audretsch and M. Feldman, “R&D Spillovers and the Geography of Innovation and Production,” The American Economic Review, Vol. 86, No. 3, 1996, pp. 630-640.
- A. Jaffe, M. Trajtenberg and R. Henderson, “Geographic Localization of Knowledge Spillovers as Evidenced by Patent Citations,” The Quarterly Journal of Economics, Vol. 108, No. 3, 1993, pp. 577-598. doi:10.2307/2118401
- R. Henderson, A. Jaffe and M. Trajtenberg, “Patent Citations and the Geography of Knowledge Spillovers: A Reassessment,” The American Economic Review, Vol. 95, No. 1, 2005, pp. 461-465. doi:10.1257/0002828053828644
- M. Gittelman, “Does Geography Matter for Science-Based Firms? Epistemic Communities and the Geography of Research and Patenting in Biotechnology,” Organization Science, Vol. 18, No. 4, 2007, pp. 724-741. doi:10.1287/orsc.1070.0249
- B. McCann and T. Folta, “Do Firms Benefit Equally from Concentration?” Journal of Business Venturing, Vol. 26, No. 1, 2011, pp. 104-123. doi:10.1016/j.jbusvent.2009.04.004
- T. Stuart and O. Sorenson, “The Geography of Opportunity: Spatial Heterogeneity in Founding Rates and the Performance of Biotechnology Firms,” Research Policy, Vol. 32, No. 2, 2003, pp. 229-253. doi:10.1016/S0048-7333(02)00098-7
- C. Pirinsky and Q. Wang, “Does Corporate Headquarters Location Matter for Stock Returns?” The Journal of Finance, Vol. 61, No. 4, 2006, pp. 1991-2015. doi:10.1111/j.1540-6261.2006.00895.x
- A. Pe’er and I. Vertinsky, “The Determinants of Survival of De Novo Entrants in Clusters and Dispersal,” Working paper: Dartmouth College, Tuck School of Business, Hanover, 2006.
- S. Kukalis, “Agglomeration Economics and Firm Performance,” Journal of Management, Vol. 36, No. 2, 2010, pp. 453-481. doi:10.1177/0149206308329964
- D. Story and P. Westhead, “An Assessment of Firms Located On and Off Science Parks in the United Kingdom,” Social Science Research Network (SSRN), New York, 2009.
- S. Bhojraj, C. Lee and D. Oler, “What’s My Line? A Comparison of Industry Classification Schemes for Capital Market Research,” Journal of Accounting Research, Vol. 41, No. 5, 2003, pp. 745-774. doi:10.1046/j.1475-679X.2003.00122.x
- US Census Bureau, “Metropolitan and Micropolitan Statistical Areas,” 2011. http://www.census.gov/population/www/metroareas/metroarea.html