iBusiness
Vol.4 No.1(2012), Article ID:18364,9 pages DOI:10.4236/ib.2012.41001
Appraisal of Using Global Student Rating Items in Quality Management of Higher Education in Saudi Arabian University
![]()
1Office of the President, University of Dammam, Dammam, Saudi Arabia; 2Deanship of Quality & Academic Accreditation, University of Dammam, Dammam, Saudi Arabia.
Email: dwivedi7@hotmail.com
Received October 28th, 2011; revised December 9th, 2011; accepted December 21st, 2011
Keywords: Global Item; Individual Items; Course Evaluation Survey; Academic Program; Higher Education; High Quality; Acceptable and Improvement Required
ABSTRACT
Academic institutions preparing for quality and academic accreditation adopt a range of evaluations. Each of such evaluations involves closed items, a mixture of individual items on various aspects, followed by global item which is the overall satisfaction of students about related evaluation. A common question in mind of the academic developers is “where to start, using global items results, or, individual items results!” Through exploratory results of course evaluation survey (CES) data on courses in nursing program of University of Dammam, this article attempts to answer this question. In summary, under this program which is in the developmental phase, one can expedite decision making related to required action plans by using global items results.
1. Introduction
To guide the development and management of the quality of higher education, a valuable and indispensable input remains the evidence generated from students’ evaluation surveys on a range of domains such as course, faculty, program, as well as services of the institution. Institutional studies on such evaluations are prevalent in most academic institutions, including the University of Dammam (UD), Saudi Arabia, as evidenced by the ample literature [1-3]. However, in order to maximize the utility of the evidence, it is equally important that, the awareness and knowledge of users and policy planners, and their organization orientation, is enhanced from time to time [1,4].
Furthermore, due to the quality race among institutions of higher education, especially those aiming at an ever increasing quality, students’ evaluations remain unavoidable [5-18]. The limitations of such surveys are known. At the same time, activities related to quality developments and its sustainability still rely on them [4,19]. To overcome this dilemma, clearer understanding of the use of evaluation results is required [1,20]. Also, users’ requirements need to be considered [1,21].
UD currently performs a range of evaluations by students [1-3] as requirements for academic accreditation by the National Commission for Academic Accreditation &
Assessment (NCAAA). Al-Rubaish [1] employed the observed results from students’ experience survey (SES) of two colleges to describe the related institutional practice, and, its policy implications towards quality management in higher education. In another article [2], he described the institutional practice related to program evaluation survey (PES), and its comparative appraisal with SES of same program. Furthermore, Al-Rubaish, Wosornu and Dwiverdi [3] drew attention to the need to focus on appropriate inferential approaches in dealing with evaluation data recorded on a Likert-type item, using course evaluation survey (CES) data.
This practice is adopted throughout the UD, beginning from the colleges of Applied medical Sciences, Dentistry, Engineering, Medicine and Nursing. Each of the three evaluation questionnaires used by UD, namely CES, PES and SES, consists of closed items and open ended questions. Hence, describing issues related to one of them will serve the purpose of better understanding of not only these three but also other evaluations involving similar structure in related questionnaires.
The discussion in the present article is focussed on course evaluation survey (CES). CES explores students’ experience at the end of courses in academic programs. It has 24 closed items. Of these, 23 are individual items on four areas. Each individual item seeks students’ opinion on one aspect under a specific area. On the other hand, item 24 (global item) seeks students’ opinion on their overall or global experience of that course [3]. The CES also has three open-ended questions (Appendix 1). This article addresses targeted issues related to only closed items.
Through analysis and interpretation of evaluation data on closed items, policy planners have at least two overriding requirements. The first is to identify and prioritize areas which require changed focus for improvement. The second is the expectation that once the observed priority improvements have been implemented, high positive impact on students’ satisfaction will be consistently achieved.
While engaged in this discretionary process about the relative utility value of these analytical results, off and on, researchers have argued as to which one individual items vis-à-vis the global item has the following attributes: validity, reliability and efficiency, as well as being simple, easy to comprehend and easy to use? Also, NCAAA [22] has prescribed to use the global item under the SES in a program as one of the key performance indicator (KPI). These points resulted into conceptualisation of the present article. In our knowledge, the reports addressing this issue are very few [23,24].
This article intends to provide additional clues to policy planners towards improvements in decision making [23] regarding continuous development in the program
[24]. It has two fold objectives: first, to describe institutional practice related to students’ global experience at the end of a course & its comparative appraisal with students’ experience related to various aspects of that course in an academic program; and, second, to describe its utilities in deriving policy oriented clues at higher level (e.g., semester/year; program). It is expected that these observations should be helpful to policy planners in undertaking more appropriate developmental measures for academic programs in general and individual courses in particular. In addition, from research as well as administrative point of view, other academic institutions might also find these observations equally useful in quality management of similar academic programs.
2. Materials and Methods
2.1. Data
For discussion, the exploratory data sets on CES were considered from one academic program, viz the 8-semester Bachelor of Science in Nursing. These CES data for semesters 1, 3, 5 & 7 were collected during the 2008-2009 academic year. In these surveys, the obtained response rate was comparatively higher among students of first two semesters, and lower among those in remaining semesters (Table 1). However, it does not stop discussing the issues being addressed in this article. Furthermore,
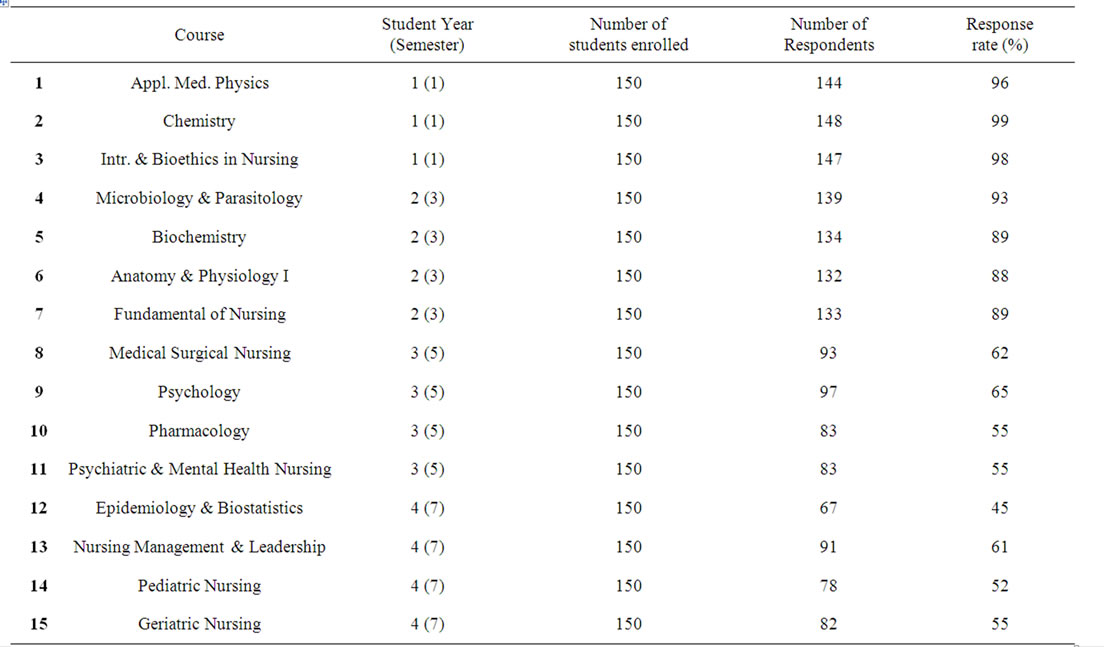
Table 1. Course-specific students’ strength and response.
the overall result can serve the purpose of generalization [25], especially in the University of Dammam [UD] based on the observed individual CES results. The CES questionnaires employed had 24 items (Appendix 1). Each of these, including the global item (24th item), is a “Likert type item”; the degree of agreement with an item (i.e. statement) is recorded on a 5-point ordinal scale [1-3].
2.2. Analytical Methods
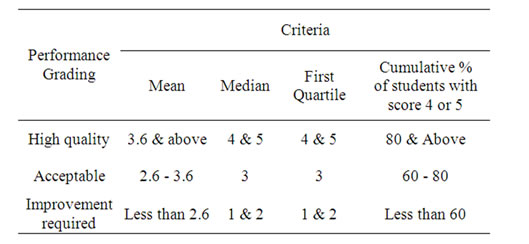
Because of the ordinal scale involved [26], the item by item analysis of data was carried out using appropriate methods as first documented by Rubaish et al. [3], and, later applied by Rubaish [1,2]. This approach applied to individual items on various aspects as well as the corresponding global item. However, to further clarify the analytical methods employed in this article, each of the four measures previously reported in the item by item analysis and their respective performance grading criteria [3] are again reproduced following:
To assess consistency in reporting on global items, the graded results using the four measures (Tables 2-5) are shown in colour. Items with high performance are shown in gold, acceptable in green, and, improvement required in red. This design will aid visual comparison at a glance between individual items and their corresponding global item, since the ultimate goal is to see whether or not the grading assigned to the global item is consistent with that assigned to the majority of individual items.

Table 2. Mean performance score and related performance grading.

Table 3. Median performance score and related performance grading.
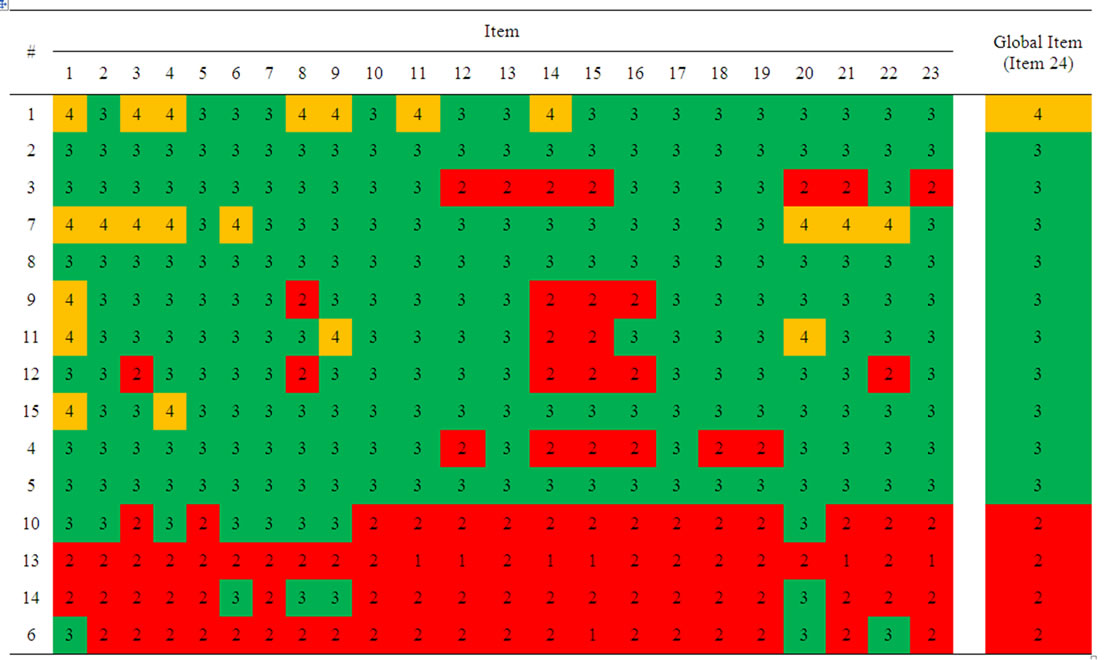
Table 4. First Quartile performance score and related performance grading.
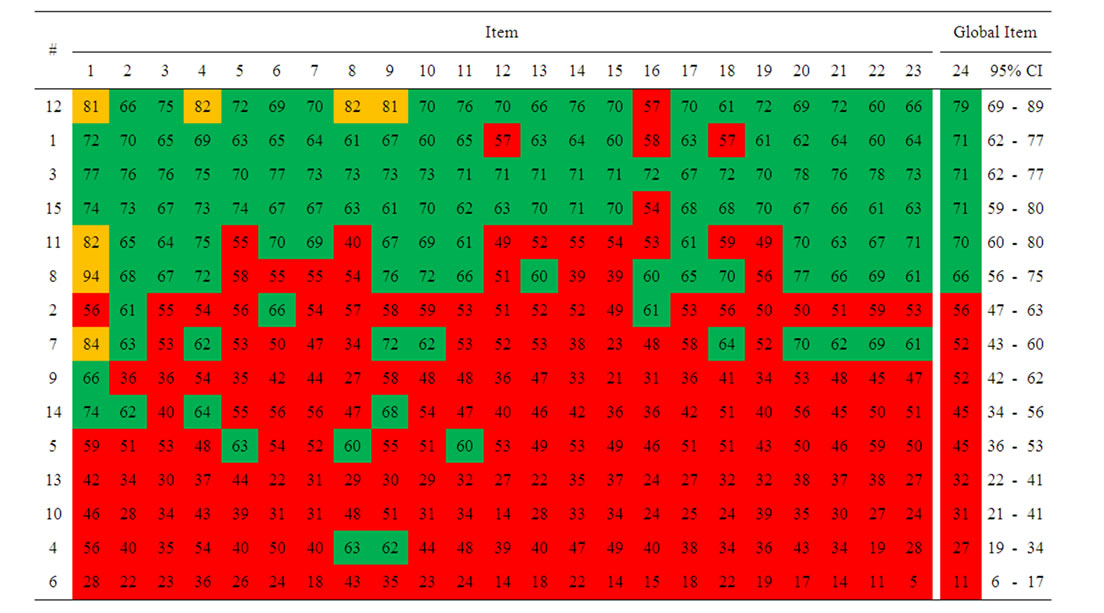
Table 5. Cumulative % of students with score with 4 & 5 and related performance grading.
Pooled Analysis
To derive semester/program level pooled results, global items in each of the 15 CES data sets from the nursing program can be considered to be equally important. This is because programs at UD are in the developmental phase, especially regarding academic accreditation by NCAAA. The pooled results, along with related confidence-intervals [27] at semester/year, as well as program level, are listed in Table 6. They are also depicted in diagrams (Figures 1(a) to (d)) to compare the distribution of total global items, and, that of total individual items in relation to their respective performance criteria of the mean, median, first quartile and cumulative % of students with rating score 4 or 5.
3. Results
The observations related to results on global items under the considered courses, along with consistency in its reporting, are described in section 3.1. Further, its utilization in deriving policy oriented clues at two higher levels (viz. semester/year and program) is reported in section 3.2.
3.1. Global Items Results and Related Consistency
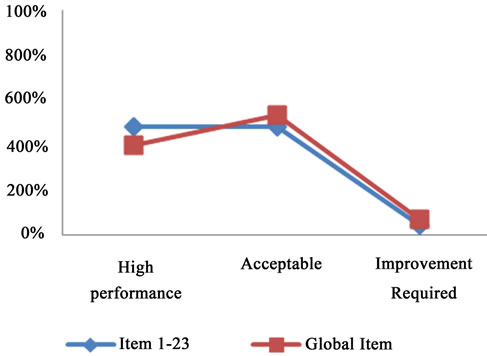
The results based on the mean grading criterion (Table 1 & Figure 1(a)) clearly demonstrate that the global item results and individual items results were positively and highly correlated. In other words, for each course, when a high proportion of individual items were rated as gold, its global item also was rated as gold. Similar observations were true for grading of items as green or red. To be more specific, performance gradings of individual items and that of their corresponding global item remained positively and highly correlated. These observations were further confirmed in Figure 1(a), where cumulative results of all considered courses were depicted according to satisfaction gradings of individual items and global items. Both results followed similar distribution in relation to satisfaction gradings.
Some shortcomings in the use of mean grading criterion of evaluation data involving an ordinal scale were previously reported [3]. Hence, the minimum threshold of satisfaction among at least 50% students was considered, i.e. the median grading criterion. Results are listed in Table 3. The relationship between global item results and other individual items results still remained similar as observed under the mean grading criterion. This relationship failed to hold true in case of course No.9. In any event, this may again support the reported shortcoming under mean grading criterion [3]. Interestingly, under the median grading criterion, a comparatively higher number of courses emerged with high performance as globally rated by the students. However, as true in case of the mean grading criterion, the results of global items and those of other individual items still followed similar distributions on satisfaction grading (Figure 1(b)).
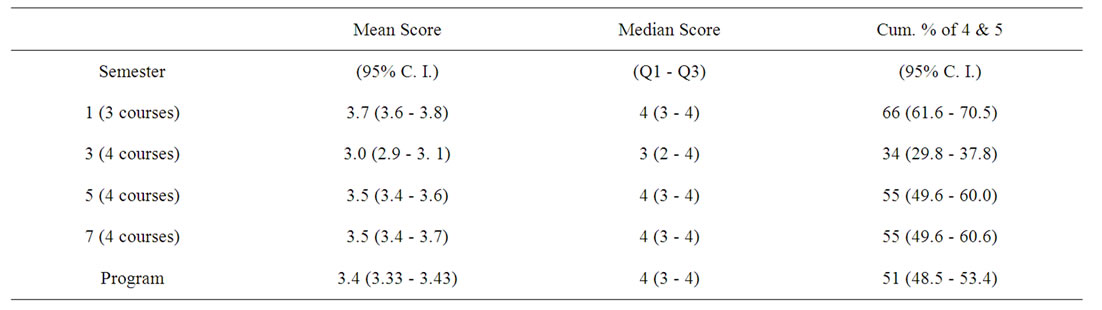
Table 6. Semester-wise pooled results of global item.
 (a)
(a)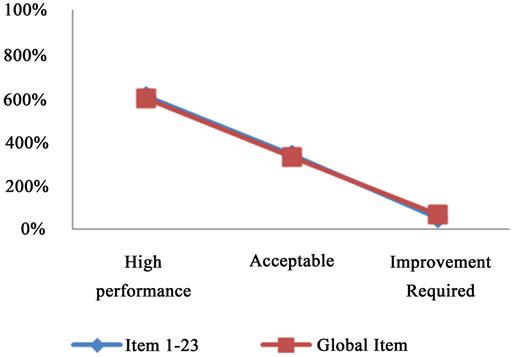 (b)
(b) (c)
(c) (d)
(d)
Figure 1. The % of items with High Performance, Acceptable Performance & Improvement Required. (a) Based on mean grading criterion; (b) Based on median grading criterion; (c) Based on first quartile grading criterion; (d) Based on grading criterion cumulative % of students with scores 4 & 5.
For further improvements, a raised threshold of satisfaction among at least 75% students was explored by using first quartile grading (Table 4). As observed in case of the mean and the median grading criteria, the relationship between global items results and other individual items results remained as positive and high correlation. Like course No.9 under the median grading criterion, course No.1 also failed to confirm this relationship under first quartile grading criterion. Further, as obvious because of the increased threshold, hardly any course achieved high satisfaction rating. However, again a positive and high correlation between results on global items and those on other items was established (Figure 1(c)). But, the majority of courses remained at acceptable level.
To adopt the example of good practice from globally reputed academic institutions, a further increase in the threshold of satisfaction to at least 80% of students was explored. The resulting items satisfaction gradings using cumulative % of students with score 4 & 5 are listed in Table 5. As in case of the mean grading criterion, under each course, there was positive and high correlation between global items results and other individual items results. It is further supported through their cumulative distribution of satisfaction on gradings (Figure 1(d)).
As evident from above descriptions, irrespective of the items grading criterion which was employed, the global items results and the other individual items results follow a similar distribution. In other words, the students surveyed remained objective and consistent while scoring global items. It may be worthwhile to mention here that, for each course, students responded to the global item immediately but only after completing all the individual items in the four areas of the questionnaire. Intuitively, evaluating only the global item can be expected to yield different results.
3.2. Utilization of Global Items Results
Bearing in mind the observed results in previous sections, to derive more meaningful and effective policy-oriented clues, one can straightway rely on global item results. For example, each course with gradings on the global item of only acceptable or improvement required, needs continuous focus on all the individual items in that course. Once a course’s grading on its global item attains high level (i.e. students are satisfied/strongly satisfied), then, in order to sustain its higher grading, one can re-visit the results of its individual items, searching for important clues related to further required improvements.
Cumulative results of courses in a semester/year can answer questions raised by policy planners, as to which semester/year needs more focus. As listed in Table 6, courses delivered in semester 1 indicated high performance under the mean as well as median grading criteria. However, the results in the same courses declined to acceptable level when the threshold of satisfaction among the students surveyed was raised. For courses considered together in the third semester, grading was acceptable. However, it declined to improvement required when raised thresholds of satisfaction were explored. The courses are taken together in 5th & 7th semesters separately. Both sets of the results remained at acceptable level in the mean, first quartile and the final grading criteria, but, attained high performance level under the median grading criterion. These observations suggest that semester-specific corrective measures are required.
Using a similar convention to address the program level, the results were derived after pooling all the courses together. As listed in bottom row of Table 6, under the mean and first quartile grading criteria, courses obtained acceptable level. They reached high level under median criterion, but, declined to improvement-required under cumulative % of students with score 4 & 5.
Thus, if the policy target was to achieve satisfaction among at least 50% students, then this program had no cause for concern. However, if an increased threshold of students’ satisfaction becomes mandatory, as a matter of policy, then, further effort at improvement will be required.
4. Summary and Conclusions
Academic developers need to look for alternative clues which can refine the decision-making process [23] about designing and implementing continuous quality improvement action plans in higher education [24]. As observed in the present article based on CES data, the global item results are positively and highly correlated with those of individual items. Indeed, one set of results seems to influence the other. These results and related issues remain to be confirmed. In the meantime, we suggest that the global item results offer a pragmatic starting point for academic program developers [23,24] provided two conditions are met.
First, as mentioned earlier, the sequencing of items on the questionnaire must be such that responses on individual items precede that on global items. Otherwise, global item results may provide an inaccurate picture, leading to inappropriate action plans. Secondly, starting corrective actions with global item results is expected to be more useful for institutional environments considered to be in developing phase of their academic programs.
Once the global satisfaction among students about a course attains a high level at a particular satisfaction threshold, there will be much utility value in drilling down to gradings assigned to individual items. In this case, lowgraded items can be given priority closer attention. This practice will help to develop and sustain high quality in higher education.
As also recommended by Abrami [23], for using global item results at five levels which are considered higher than “course” (i.e. semester, year, program, college and university level), the average of global items from courses covered in a semester can be aggregated. This approach will help in improving decision-making at these higher levels, especially if most of the courses have poor global item gradings. Once the majority of courses attain higher gradings, one can make a paradigm shift away from this practice and look at individual items at the chosen level. A transition phase will require a hybrid approach global items vis-à-vis individual items. Once all the courses in a program attain high global item gradings, evaluations using even sampling-based approach can be adequate to monitor the sustainability of the achieved quality in higher education.
5. Limitations
The present article considered exploratory CES data sets of only one program from only one College, Nursing, the University of Dammam [UD]. In addition to other aspects, each program/college in UD might be at varying levels of the developmental phase in terms of infrastructure and facilities related to information technology (IT), library, sports and religious prayer. Accordingly, each might require a different approach while making use of global item results.
6. Future Research
Each program as well as college involves varying levels of development [1-2]. Thus, each one of them requires such evaluations considering related CES data. Likewise, data under other evaluations also need to be explored to assess utility of global item results viz-a-viz other item results. The related clues from such explorations may be helpful to the academic program developers in expediting the decision-making about continuous quality improvements in high education.
7. Acknowledgements
The authors are thankful to the Dean, College of Nursing and officials at their Quality & Planning Unit, for cooperation in data collection. They thank Mr. Royes Joseph, (DQAA), for his help in analysis and Ms. Margilyn Ungson for secretarial input. Finally, they thank all students for their mature, balanced and objective response.
REFERENCES
- A. Al Rubaish, “On the Contribution of Student Experience Survey Regarding Quality Management in Higher Education: An Institutional Study in Saudi Arabia,” Journal of Service Science and Management, Vol. 3, No. 4, 2010, pp. 464-469.
- A. Al Rubaish, “A Comparative Appraisal of Timings for Program Evaluation Survey and Related Institutional Results in Saudi Arabia: Quality Management in Higher Education,” Journal of Service Science and Management, Vol. 4, No. 4, 2011, pp. 184-190.
- A. Al Rubaish, L. Wosornu and S. N. Dwivedi, “Using Deductions from Assessment Studies towards Furtherance of the Academic Program: An Empirical Appraisal of Institutional Student Course Evaluation”, iBusiness, Vol. 3, No. 2, 2011, pp. 220-228.
- P. Gravestock and E. Gregor-Greenleaf, “Student Course Evaluations: Research, Models and Trends,” Higher Education Quality Council of Ontario, Toronto, 2008.
- L. P. Aultman, “An Expected Benefit of Formative Student Evaluations,” College Teaching, Vol. 54, No. 3, 2006, pp. 251-285. doi:10.3200/CTCH.54.3.251-285
- T. Beran, C. Violato and D. Kline, “What’s the “use” of students ratings of instruction for administrators? One university’s experience,” Canadian Journal of Higher Educatuon, Vol. 37, No. 1, 2007, pp. 27-43.
- L. A. Braskamp and J. C. Ory, “Assessing faculty work: Enhancing individual and institutional performance,” JosseyBass, San Francisco, 1994.
- J. P. Campbell and W. C. Bozeman, “The value of Student Ratings: Perceptions of Students, teachers and administrators,” Community College Journal of Research and Practice, Vol. 32, No. 1, 2008, pp. 13-24. doi:10.1080/10668920600864137
- W. E. Cashin and R. G. Downey, “Using Global Student Rating Items for Summative Evaluation,” Journal of Educational Psychology, Vol. 84, No. 4, 1992, pp. 563-572. doi:10.1037/0022-0663.84.4.563
- M. R. Diamond, “The usefulness of structured Mid-Term feedback as a catalyst for change in Higher Education Classes,” Active Learning in Higher Education, vol. 5, No. 3, 2004, pp. 217-231. doi:10.1177/1469787404046845
- L. C. Hodges and K. Stanton, “Translating comments on Student Evaluations into language of learning,” Innovative Higher Education, Vol. 31, No. 5, 2007, pp. 279-286. doi:10.1007/s10755-006-9027-3
- J. W. B. Lang and M. Kersting, “Regular feedback from student ratings of instruction: Do college teachers improve their ratings in the Long Run?” Instructional Science, Vol. 35, No. 3, 2007, 187-205. doi:10.1007/s11251-006-9006-1
- H. W. Marsh, “Do University Teachers Become More Effective with experience? A Multilevel Growth Model of Students’ Evaluations of teaching over 13 years,” Journal of Educational Psychology, Vol. 99, No. 4, 2007, pp. 775-790. doi:10.1037/0022-0663.99.4.775
- R. J. Menges, “Shortcomings of research on evaluating and improving teaching in Higher Education,” In: K. E. Ryan, Ed., Evaluating teaching in Higher Education: A vision for the future (Special issue), John Wiley & Sons, Hoboken, 2000, pp. 5-11.
- A. R. Penny and R. Coe, “Effectiveness of consultations on student ratings feedback: A Meta-Analysis,” Review of Educational Research, Vol. 74, No. 2, 2004, pp. 215- 253. doi:10.3102/00346543074002215
- R. E. Wright, “Student evaluations of faculty: Concerns raised in the literature, and Possible Solutions,” College Student Journal, Vol. 40, No. 2, 2008, pp. 417-422.
- F. Zabaleta, “The use and misuse of student evaluation of teaching,” Teaching in Higher Education, Vol. 12, No. 1, 2007, pp. 55-76. doi:10.1080/13562510601102131
- A. S. Aldosary, “Students’ Academic Satisfaction: The Case of CES at KFUPM,” Journal of King Abdul Aziz University for Engineering Sciences, Vol. 11, No. 1, 1999, pp. 99- 107.
- M. Yorke, “‘Student Experience’ Surveys: Some Methodological Considerations and an Empirical Investigation,” Assessment & Evaluation in Higher Education, Vol. 34, No. 6, 2009, pp. 721-739. doi:10.1080/02602930802474219
- W. J. McKeachie, “Students Ratings: The Validity of Use,” American Psychologist, Vol. 51, No. 11, 1997, pp. 1218- 1225. doi:10.1037/0003-066X.52.11.1218
- M. Theall and J. Franklin, “Looking for bias in all the wrong places: A search for Truth or a witch hunt in student ratings of instruction?” In: M. Theall, P. C Abrami and L. A. Mets Eds., the Student Ratings Debate: Are They Valid? How can We Best Use Them? (Special Issue),” John Wiley & Sons, Hoboken, 2001, pp. 45-46.
- National Commission for Academic Accreditation & Assessment, “Handbook of Quality Assurance and Accreditation in Saudi Arabia, Part 2,” Internal Quality Assurance Arrangements, Dammam, 2007.
- P. C. Abrami, “Improving Judgements about Teaching Effectiveness Using Teacher Rating Forms,” John Wiley & Sons, Hoboken, 2001.
- C. Sid Nir and L. Bennet, “Using Student Satisfaction Data to Start Conversations about Continuous Improvement,” Quality Approaches in Higher Education, Vol. 2, No. 1, 2011.
- W. E. Cashin, “Students Do Rate Different Academic Fields Differently,” In: M. Theall and J. Franklin, Eds., Student ratings of instruction: Issues for improving practice (Special Issues),” John Wiley & Sons, Hoboken, 1990, pp. 113 -121.
- R. Gob, C. Mc Collin and M. F. Rmalhoto, “Ordinal methodology in the analysis of Likert scales,” Qualilty & Quantity, Vol. 41, No. 5, 2007, pp. 601-626. doi:10.1007/s11135-007-9089-z
- K. R. Sundaram, S. N. Dwivedi and V. Sreenivas, “Medical Statistics: Principles & Methods,” BI Publications Private Ltd., New Delhi, 2009.
Appendix 1: Course Evaluation Survey Questionnaire
Items
At the start of the course, I was made clear about:
1) The course outline including the knowledge and skills.
2) The things I had to do to succeed, including assessment tasks and criteria for assessment.
3) Sources of help for me, including faculty office hours and reference material.
During this course, my instructors:
4) Conducted the course consistent with the course outline.
5) Were available during office hours to help me.
6) Were enthusiastic about what they were teaching.
7) Cared about my academic progress, and, were helpful to me.
8) Were fully committed to the delivery. (e.g. On time start, regular presence, well prepared material, etc.).
9) Had thorough knowledge of the content of the course.
10) Used up-to-date and useful course materials. (Texts, handouts, references etc.).
11) Encouraged me to ask questions, and, develop my own ideas.
12) Inspired me to do my best work.
13) Made clear to me the links between this and other courses in my total program.
14) Gave fair grade to my Continuous Assessment [tests & assignments].
15) Gave the marks for the Continuous Assessment to me in time.
During this course, my college/department:
16) Provided the resources I needed (textbooks, library, computers etc.) & made them available for me when I needed.
17) Provided effective technology to support my learning.
18) Made sure that the things to be done by me (class activities, assignments, laboratories etc), were appropriate for the knowledge & skills the course was intended to develop.
19) Required a fair amount of work for the credit hours allocated.
Evaluation of the course: this course helped me to:
20) Learn what is important & will be useful to me.
21) Improve my ability to think & solve problems rather than memorize information.
22) Develop my ability to work as a member of a team.
23) Improve my ability to communicate effectively.
Overall evaluation:
24) Overall, I was satisfied with the quality of this course.