Journal of Geographic Information System
Vol.10 No.03(2018), Article ID:85336,14 pages
10.4236/jgis.2018.103013
Evaluation of Land Use & Land Cover Change Using Multi-Temporal Landsat Imagery: A Case Study Sulaimaniyah Governorate, Iraq
Karwan Alkaradaghi1,2,3, Salahalddin S. Ali2,4, Nadhir Al-Ansari1*, Jan Laue1
1Lulea University of Technology, Lulea, Sweden
2Department of Geology, College of Science, Sulaimani University, Sulaimaniyah, Iraq
3Kurdistan Institution for Strategic Studies and Scientific Research, Sulaimaniyah, Iraq
4Komar University of Science and Technology, Sulaymaniyah, Iraq

Copyright © 2018 by authors and Scientific Research Publishing Inc.
This work is licensed under the Creative Commons Attribution International License (CC BY 4.0).
http://creativecommons.org/licenses/by/4.0/


Received: May 28, 2018; Accepted: June 16, 2018; Published: June 19, 2018
ABSTRACT
Land use & land cover change detection in rapid growth urbanized area have been studied by many researchers and there are many works on this topic. Commonly, settlement sprawl in area depends on many factors such as economic prosperity and population growth. Iraq is one of the countries which witnessed rapid development in the settlement area. Remote sensing and geographic information system (GIS) are analytical software technologies to evaluate this familiar worldwide phenomenon. This study illustrates settlement development in Sulaimaniyah Governorate from 2001 to 2017 using Landsat satellite imageries of different periods. All images had been classified using remote sensing software in order to proceed powerful mapping of land use classification. Maximum likelihood method is used in the accurately extracted solution information from geospatial imagery. Landsat images from the study area were categorized into four different classes. These are: forest, vegetation, soil, and settlement. Change detection analysis results illustrate that in the face of an explosive demographic shift in the settlement area where the record + 8.99 percent which is equivalent to 51.80 Km2 over a 16-year period and settlement area increasing from 3.87 percent in 2001 to 12.86 percent in 2017. Accuracy assessment model was used to evaluate (LULC) classified images. Accuracy results show an overall accuracy of 78.83% to 90.09% from 2001 to 2017 respectively while convincing results of Kappa coefficient given between substantial and almost perfect agreements. This study will help decision-makers in urban plan for future city development.
Keywords:
Settlement Expansion, Geographic Information System (GIS), Land Use Land Cover (LULC), Land Use Classification, Satellite Images, Accuracy Assessment and Change Detection

1. Introduction
The earth’s surface passes through rapid land use & land cover (LULC) changes. Land use commonly refers to the modification of earth’s surface through human activities for decent urban management due to various socioeconomic activities and natural phenomena while the land cover illustrates the physical manifestation over the ground [1] . There is no doubt that the growth in population, socioeconomic, political and cultural, plays an important role in land cover change, thus, resulting in an observable pattern in the LULC over the time [2] .
Nowadays, rapid urbanization rate in most of the developing countries is on the priority of global problems, while this phenomenon has a significant impact on future environment and urban planning processes [3] [4] [5] .
Sulaimaniyah Governorate like the rest of other cities in Kurdistan region of Iraq encountered in the last 16 years rapid expansion in the urbanized area due to high population growth rate and economic prosperity [6] . Remote sensing and GIS technique are the main applications that attempt to use in direct desktop mapping for temporal analysis and quantification of change in LULC with better accuracy in less time and low cost and [7] [8] .
Landsat data enhanced imageries in the world with the ability of frequent revisit. Different satellite image sources are used in previous studies in land use classification to achieve historical trends of land cover changes [9] [10] [11] [12] [13] . Satellite image selection in different acquisition dates affects the results according to the vegetation life cycle [11] , classification of satellite image over the time for the same area effect on change in class’s area according to vegetation growth and welting on the bare soil. However, all selected satellite images in this study refer to the same season over the years to avert detecting false changes in the land cover due to vegetation phenology [9] [11] [14] [15] [16] .
Maximum likelihood is a supervised classification method and was used in this study to detect LULC change to present how the land use has been changed from the year 2001 to 2017. Each pixel in classified Landsat images varies according to land cover changes over the time [2] . Frequently, selected data during imagery classification preferred in approximately within the maximum vegetation growth during the annual season [14] [16] . Remotely sensed classified image requires accuracy assessment to prevent certainty limits for the results [17] [18] .
Accuracy assessment widely used in classified images by comparing the Landsat image with the results within quantitative evaluation, which is impossible to be implemented from visual evaluation [15] [18] [19] [20] [21] . Cohen’s kappa coefficient is used in this study as a standard measure of classification accuracy in order to take into account the correct class which specified purely by chance [22] [23] [24] [25] . Accuracy assessment is commonly processed in the reference Landsat images with classified images [15] [18] [19] [26] [27] [28] .
To achieve this objective, random sample points are located within geographic information system (GIS), accuracy assessment between each of reference Landsat images and classified images implement a confusion matrix (error matrix).
Iraq witnessed successive wars leading to economic, urban and human recession affecting all regions, including the city of Sulaimaniyah. According to food security and vulnerability in an in-depth survey of Sulaimaniyah Governorate after the events in 2003, Iraq witnessed a huge economic boom; Sulaimaniyah’s economy today relies on tourism, agriculture, factories, trade and construction development [29] .
There is no doubt urban that development will affect the environment and global climate by losses in vegetation biomass, deforestation and land use change from areas with high probability of urban expansion [30] .
This study is an attempt to assess the status of LULC change with the development of settlements in Sulaimaniyah governorate to detect the rate of land use and the changes that have occurred over the past two decades using geospatial techniques.
2. Study Area
Sulaimaniyah Governorate is located at the North East of Iraq Figure 1 Sulaimaniyah city (the capital of Sulaymaniyah Governorate) is one of the three major urban cities of Kurdistan Region. Geographically, the city is bounded by mountains from the northeast and situated in lower land over encompasses an area of around 470 km2 with total population of 829,245 in early 2017 according to the data achieved from Statistical Directorate in Sulaimaniyah. The study area is characterized by a distinct continental interior climate with hot summers and cold winters of the Mediterranean type with the average annual precipitation ranging from (500 to 700) mm.
3. Methodology
3.1. Landsat Images and Classification
Landsat Thematic Mapper (TM) images acquired from the years 2001, 2007, and 2011 was used with Landsat Operational Land Imager (OLI) at a resolution of 30m for the years 2016 and 2017 in LULC classification. Table 1 represents the available Landsat imagery with a spectral band used in this study. All required satellite imagery for the study area was downloaded from the official site of USGS earth explorer. The city plan was obtained from the Sulaimaniyah municipality corporation as a shape file of study area.
In this study, the remote sensing software ENVI 5.3 was used for image processing. During the process, the imagery geometrically corrected through pre-processing calibration, which consist of atmospheric and topographic correction
 (Source, Humanitarian Information Centre (HIC), Landsat, United States National Imagery Mapping Agency (NIMA). Contributor, OCHA Iraq.)
Figure 1. Location map of the study area.

Table 1. Available Landsat imagery with spectral band resolution for Landsat Thematic Mapper (TM) and Landsat Operational Land Imager (OLI).
[31] [32] . Image-processing techniques are statistical algorithms that change the visual appearance or geometric properties of the images, These corrections are required for selected multitemporal or multisensor Landsat images to improve visibility appearance and image quality and get more accurate results [9] [31] .
In Landsat Operational Land Imager (OLI) digital number values were converted to the surface reflectance with the fast line-of-sight atmospheric analysis of hypercubes (FLAASH) to remove atmospheric effects and create a surface reflectance image.
The pre-processed images were classified considering a supervised classification method. In this technique, the maximum likelihood was chosen which is based on Bayesian theory in estimating parameters of a probabilistic model [33] . Each pixel assigned for a class according to its probability. Mean vector and covariance metrics are the key component of maximum likelihood classification that can be retrieved from training data (signatures or region of interest ROI) [7] [14] . All data were used for this study were projected to the Universal Transverse Mercator (UTM) projection system with WGS 84 reference system. Figure 2 shows schematic workflow steps for land use land cover change LULC and accuracy assessment.
Landsat Thematic Mapper (TM) sensor was carried on Landsat 5 and images consist of six spectral bands with a spatial resolution of 30 meters for Bands 1 - 5 and 7 and one thermal band (Band 6). Landsat Operational Land Imager (OLI) and Thermal Infrared Sensor (TIRS) images consist of nine spectral bands with a spatial resolution of 30 meters for Bands 1 to 7 and Band 9 is useful for cirrus
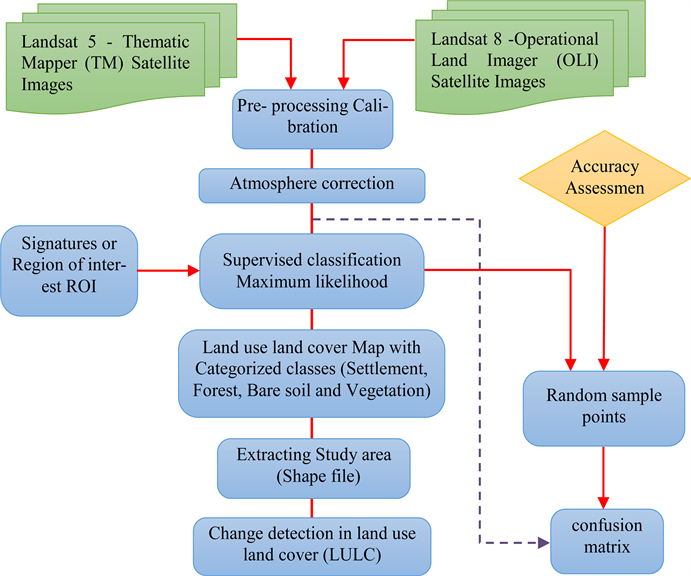
Figure 2. Schematic workflow used for LULC change detection.
cloud detection. The resolution for Band 8 (panchromatic) is 15 meters while thermal bands 10 and 11 resolutions are (100 * 30) meters [34] .
3.2. Create Accuracy Assessment Points
To create accuracy assessment 470 points selected in classified images with the congruent Landsat images 2001, 2007, 2011, 2016 and 2017 respectively, the classified images were compared with the reference images by means of the error matrix [19] [35] [27] [22] [36] .
Overall accuracy was calculated using Equation (1), while Kappa coefficient was calculated using equation (2) [18] [19] [20] .
(1)
where;
OA: overall classification accuracy;
C: number of correct points;
A: total number of reference points.
(2)
where;
r: number of categories (Classes);
N: total number of point (observations pixels);
xii: number of points on row i and column i;
xi+: marginal total of row i (from overall confusion/error matrix);
x+i: marginal total of column (from overall confusion/error matrix).
3.3. Accuracy Assessment
Cohen’s Kappa coefficient (K) is a strong statistical method used to measure the agreement between predicted and observed categorizations of a dataset. This statistic method is useful, especially in predictive accuracy of classification [36] . Random sample points were used in post-classification for accuracy assessment, 470 random sample points are located by Arc-map software then all points labelled under their category type in the classification. The reference points were compared with the classification results at the same locations. The output point shape file or feature class that contains the random 470 points was computed in the confusion matrix to ensure that each point had a valid class asset values for the classified and ground-truth point [14] [20] .
The producer accuracy and user accuracy for each class calculated from the matrix as well as an overall kappa index of agreement. When Kappa coefficient is equal to (1.00) it means perfect agreement and if the value close to (0.00) it means poor agreement. Table 2 represents the rating criteria of Kappa statistics [33] [37] . User accuracy represents the probability that a pixel classified into a given category actually which represents that category on the ground [38] .
Table 2. Fleiss kappa interpretation (Rating criteria of Kappa statistics).
4. Results and Discussion
4.1. Classification Results
Four land cover classes identified from maximum likelihood classification. These classes are forest, Settlement area, soil, vegetation and as shown in Figure 3.
Classification results gave the LULC raster image of the selected area, it is possible to calculate the area for each class separately according to pixel geometry and statistical distribution of pixels through the study area. The change detection in different LULC categories in the Sulaimaniyah Governorate from 2001 to 2017 as illustrated in Table 3.
4.2. Accuracy Assessment Results
The accuracy report from the matrix of all classified images is tabulated in Table 4. An overall accuracy and kappa coefficient was obtained for the years 2001, 2001, 2011, 2016 and 2017 respectively. Various measures of accuracy assessment such as producer accuracy, user accuracy, overall accuracy and Kappa coefficient were carried out and are represented in Table 2. Kappa coefficients generally rated as substantial agreement for all classified.
Producers Accuracy (Omission Errors) The results from dividing the number of correctly classified pixels in each category on the major diagonal matrix by the number of reference pixels “known” to be of that category (the column total), This value represents how well reference pixels of the ground cover type are classified, While users Accuracy (Commission Error) computed by dividing the number of correctly classified pixels in each category by the total number of pixels that were classified in that category (the row total), This value represents the probability that a pixel classified into a given category actually represents that category on the ground.
While Kappa reflects the difference between actual agreement and the agreement expected by chance Kappa results means there is 80% better agreement than by chance alone, Different values of kappa and overall accuracy from 2001 to 2017 return to the choice of reference data, interaction between sensor and desired classification scheme and Error matrix is foundation of accuracy assessment.

Figure 3. Maximum Likelihood Classification of the Sulaimaniyah Governorate 2001, 2007, 2011, 2016 and 2017.
Table 3. Change detection in the four classes identified in the Sulaimaniyah Governorate from 2001 to 2017.
Table 4. Accuracy assessment of the classified images.
PA: Producer Accuracy, UA: User Accuracy; OA: Overall Accuracy, K: Kappa coefficient.
4.3. Change Detection Analysis
During the 16 years period (2001 to 2017), settlement area increased by around 9%, which represent 51.80 km2. On the other hand, bare soil decreased by 44.77% in area. Forest recorded minimum change according to deforestation in land use in the study area, while vegetation increased by over 37% in the area as represented in Figure 4.
Increased vegetation area refers to two factors which are settlement growth at the same duration and the difference in Landsat acquisition date, although all available images were selected from the same season while there is a difference in duration for first and last Landsat Image by around one month duration which is sufficient for vegetation growth.
Maximum likelihood classification result gave the raster image, Settlement area calculated according to the pixel geometry from Table 1 and statistical pixels distribution in attribute table through the study area.
Change in settlement area between the years 2001 to 2017 increased from 3.87% area in 2001 to rich 12.87% area in 2017 as shown in Figure 5.

Figure 4. LULC change detection in area from the years (2001 to 2017).

Figure 5. Change in settlement area from the years (2001 to 2017).
Two rapid expansions in settlement area noted during evaluation of classified images between 2001 to 2017 and 2011 to 2016 respectively which are mainly caused by economic prosperity and population growth.
Change in settlement area returns to modification of land cover due to human processes while the change in land cover is the natural occurrence on the earth surface like Forest decreased in area from 2001 to 2017 according to Sulaimaniyah government plan to increase green area around the city but the consequences forest fire reduced the rate of forest development, as shown in Land cover variation tendency in Figure 6.
Bare soil decreased in area from 2001 to 2017 according to modification of land cover and Settlement expansion.
Vegetation and grassland development in the area after 2001 refer to economic prosperity and Human needs through population growth.

Figure 6. Land cover variation tendency from the years (2001 to 2017).
5. Conclusions
In situations of rapid land use change, the classified images provide detail information to understand the land use and land cover of the study area. Settlement area in Sulaimaniyah Governorate expended significantly from the years 2001 to 2017. This expansion occurred comes at the expense of the bare soil and forest shortage in area by 257.87 and 4.51 Km2 respectively. Thus, settlement recorded sprawl in the area according to the land use in bare soil and deforestation.
All satellite images were selected in this study referring to the same season over the years to produce series land use classification maps while there is a time deference in acquisition date in the first image in 2001 by 1 month earlier. Thus, vegetation appears with less area than soil from the begging; this causes false changes in the land cover due to phenology. Increased vegetation area mainly refers to two factors which are settlement development due to population growth and deferent in duration of Landsat acquisition date. However, all available images are from the same season.
The study area is affected by deforestation in 4.51 km2 over total area of 470 km2 between the years 2011 to 2017; this value impacts on future environment and urban management
This study will help planners and decision-makers for future development of the city.
Classification results have shown that Maximum likelihood classification is the robust technique and there are fewer chances of misclassification.
Accuracy assessment model is the significant method for validation in the land use classification. In addition, number of samples and distribution of random points are based on the density of each category in classified images. The Kappa coefficient indicates that the classification method is very well captured for the land use and land cover of the interest study area.
The main influence on land cover changes comes through the variety of interlinked factors which are the population growth and economic prosperity.
Cite this paper
Alkaradaghi, K., Ali, S.S., Al-Ansari, N. and Laue, J. (2018) Evaluation of Land Use & Land Cover Change Using Multi-Temporal Landsat Imagery: A Case Study Sulaimaniyah Governorate, Iraq. Journal of Geographic Information System, 10, 247-260. https://doi.org/10.4236/jgis.2018.103013
References
- 1. Comber, A.J. (2008) Land Use or Land Cover? Journal of Land Use Science, 3, 199-201. https://doi.org/10.1080/17474230802465140
- 2. Tilahun, A. (2015) Accuracy Assessment of Land Use Land Cover Classification Using Google Earth. American Journal of Environmental Protection, 4, 193-198. https://doi.org/10.11648/j.ajep.20150404.14
- 3. Clark, B.J.F. and Pellikka, P.K.E. (2009) Landscape Analysis Using Multiscale Segmentation and Object Orientated Classification. In: Roder and Hill, Eds., Recent Advances in Remote Sensing and Geoinformation Processing for Land Degradation Assessment, Taylor & Francis Group, London, 323-342.
- 4. Rathcke, B. and Lacey, E.P. (1985) Phenological Patterns of Terrestrial Plants. Annual Review of Ecology and Systematics, 16, 179-214. https://doi.org/10.1146/annurev.es.16.110185.001143
- 5. Song, C., Woodcock, C.E., Seto, K.C., Lenney, M.P. and Macomber, S.A. (2001) Classification and Change Detection Using Landsat TM Data: When and How to Correct Atmospheric Effects? Remote Sensing of Environment, 75, 230-244. https://doi.org/10.1016/S0034-4257(00)00169-3
- 6. Wu, C., et al. (2017) Land Surface Phenology Derived from Normalized Difference Vegetation Index (NDVI) at Global FLUXNET Sites. Agricultural and Forest Meteorology, 233, 171-182. https://doi.org/10.1016/j.agrformet.2016.11.193
- 7. Alexakis, D.D., Agapiou, A., Hadjimitsis, D.G. and Retalis, A. (2012) Optimizing Statistical Classification Accuracy of Satellite Remotely Sensed Imagery for Supporting Fast Flood Hydrological Analysis. Acta Geophysica, 60, 959-984. https://doi.org/10.2478/s11600-012-0025-9
- 8. Kim, D.H., Narashiman, R., Sexton, J.O., Huang, C. and Towns-hend, J.R. (2011) Methodology to Select Phenologically Suitable Landsat Scenes for Forest Change Detection. International Geoscience and Remote Sensing Symposium (IGARSS), Vancouver, BC, 24-29 July 2011, 2613-2616. https://doi.org/10.1109/IGARSS.2011.6049738
- 9. McIver, D.K. and Friedl, M.A. (2002) Using Prior Probabilities in Decision-Tree Classification of Remotely Sensed Data. Remote Sensing of Environment, 81, 253-261. https://doi.org/10.1016/S0034-4257(02)00003-2
- 10. Hassen, E.E. and Assen, M. (2018) Land Use/Cover Dynamics and Its Drivers in Gelda Catchment, Lake Tana Watershed, Ethiopia. Environmental Systems Research, 6, 4. https://doi.org/10.1186/s40068-017-0081-x
- 11. Rosenfield, G.H. and Fitzpatrick-Lins, K. (1986) A Coefficient of Agreement as a Measure of Thematic Classification Accuracy. Photogrammetric Engineering and Remote Sensing, 52, 223-227.
- 12. Foody, G.M. (2002) Status of Land Cover Classification Accuracy Assessment. Remote Sensing of Environment, 80, 185-201. https://doi.org/10.1016/S0034-4257(01)00295-4
- 13. Weil, G., Lensky, I.M., Resheff, Y.S. and Levin, N. (2017) Optimizing the Timing of Unmanned Aerial Vehicle Image Acquisition for Applied Mapping of Woody Vegetation Species Using Feature Selection. Remote Sensing, 9, 1130.
- 14. Mosammam, H.M., Nia, J.T., Khani, H., Teymouri, A. and Kazemi, M. (2017) Monitoring Land Use Change and Measuring Urban Sprawl Based on Its Spatial Forms: The Case of Qom City. The Egyptian Journal of Remote Sensing and Space Science, 20, 103-116.
- 15. Barsi, J.A., Lee, K., Kvaran, G., Markham, B.L. and Pedelty, J.A. (2014) The Spectral Response of the Landsat-8 Operational Land Imager. Remote Sensing, 6, 10232-10251. https://doi.org/10.3390/rs61010232
- 16. Morisette, J.T., et al. (2009) Tracking the Rhythm of the Seasons in the Face of Global Change: Phenological Research in the 21st Century. Frontiers in Ecology and the Environment, 7, 253-260. https://doi.org/10.1890/070217
- 17. Tilahun, A. (2015) Accuracy Assessment of Land Use Land Cover Classification Using Google Earth. American Journal of Environmental Protection, 4, 193. https://doi.org/10.11648/j.ajep.20150404.14
- 18. Congalton, R.G. and Green, K. (2009) Assessing the Accuracy of Remotely Sensed Data: Principles and Practices. 2nd Edition, CRC Press, Boca Raton.
- 19. Zhu, X. and Liu, D. (2014) Accurate Mapping of Forest Types Using Dense Seasonal Landsat Time-Series. ISPRS Journal of Photogrammetry and Remote Sensing, 96, 1-11. https://doi.org/10.1016/j.isprsjprs.2014.06.012
- 20. Gashaw, T., Tulu, T., Argaw, M. and Worqlul, A.W. (2017) Evaluation and Prediction of Land Use/Land Cover Changes in the Andassa Watershed, Blue Nile Basin, Ethiopia. Environmental Systems Research, 6, 17. https://doi.org/10.1186/s40068-017-0094-5
- 21. Congalton, R.G. (2005) Thematic and Positional Accuracy Assessment of Digital Remotely Sensed Data. Proceedings of the 7th Annual Forest Inventory and Analysis Symposium, Portland, 3-6 October 2005, 149-154.
- 22. Gashaw, T., Bantider, A. and Mahari, A. (2014) Evaluations of Land Use/Land Cover Changes and Land Degradation in Dera District, Ethiopia: GIS and Remote Sensing Based Analysis. International Journal of Scientific Research in Environmental Sciences, 2, 199-208.
- 23. Mosammam, H.M., Nia, J.T., Khani, H., Teymouri, A. and Kazemi, M. (2017) Monitoring Land Use Change and Measuring Urban Sprawl Based on Its Spatial Forms: The Case of Qom City. The Egyptian Journal of Remote Sensing and Space Sciences, 20, 103-116. https://doi.org/10.1016/j.ejrs.2016.08.002
- 24. Fleiss, J.L. (1971) Measuring Nominal Scale Agreement among Many Raters. Psychological Bulletin, 76, 378-382. https://doi.org/10.1037/h0031619
- 25. Landis, J.R. and Koch, G.G. (1977) The Measurement of Observer Agreement for Categorical Data. Biometrics, 33, 159. https://doi.org/10.2307/2529310
- 26. Foody, G.M. (2002) Status of Land Cover Classification Accuracy Assessment. Remote Sensing of Environment, 80, 185-201. https://doi.org/10.1016/S0034-4257(01)00295-4
- 27. Missions, L. (2013) Landsat 8 Data Product Information. 7-9.
- 28. Clark, B.J.F. and Pellikka, P.K.E. (2009) Landscape Analysis Using Multiscale Segmentation and Object-Orientated Classification. In: Roder, A. and Hill, J., Eds., Recent Advances in Remote Sensing and Geoinformation Processing for Land Degradation Assessment, CRC Press, Boca Raton, 323-342.
- 29. Planning, M.O.F., Cooperation, D. and Health, M.O.F. (2008) Comprehensive Food Security and Vulnerability Analysis in Iraq.
- 30. Seto, K.C. and Christensen, P. (2013) Remote Sensing Science to Inform Urban Climate Change Mitigation Strategies. Urban Climate, 3, 1-6. https://doi.org/10.1016/j.uclim.2013.03.001
- 31. Song, C., Woodcock, C.E., Seto, K.C., Lenney, M.P. and Macomber, S.A. (2001) Classification and Change Detection Using Landsat TM Data: When and How to Correct Atmospheric Effects? Remote Sensing of Environment, 75, 230-244. https://doi.org/10.1016/S0034-4257(00)00169-3
- 32. Schulz, J.J., Cayuela, L., Echeverria, C., Salas, J. and Rey Benayas, J.M. (2010) Monitoring Land Cover Change of the Dryland Forest Landscape of Central Chile (1975-2008). Applied Geography, 30, 436-447. https://doi.org/10.1016/j.apgeog.2009.12.003
- 33. Rosenfield, G.H. and Fitzpatrick-Lins, K. (1986) A Coefficient of Agreement as a Measure of Thematic Classification Accuracy. Photogrammetric Engineering and Remote Sensing, 52, 223-227.
- 34. Barsi, J.A., Lee, K., Kvaran, G., Markham, B.L. and Pedelty, J.A. (2014) The Spectral Response of the Land-sat-8 Operational Land Imager. Remote Sensing, 6, 10232-10251. https://doi.org/10.3390/rs61010232
- 35. McIver, D.K. and Friedl, M.A. (2002) Using Prior Probabilities in Decision-Tree Classification of Remotely Sensed Data. Remote Sensing of Environment, 81, 253-261. https://doi.org/10.1016/S0034-4257(02)00003-2
- 36. Pontius, R.G. and Millones, M. (2011) Death to Kappa: Birth of Quantity Disagreement and Allocation Disagreement for Accuracy Assessment. International Journal of Remote Sensing, 32, 4407-4429. https://doi.org/10.1080/01431161.2011.552923
- 37. Alexakis, D.D., Agapiou, A., Hadjimitsis, D.G. and Retalis, A. (2012) Optimizing Statistical Classification Accuracy of Satellite Remotely Sensed Imagery for Supporting Fast Flood Hydrological Analysis. Acta Geophysica, 60, 959-984. https://doi.org/10.2478/s11600-012-0025-9
- 38. Rientjes, T.H.M., Perera, B.U.J., Haile, A.T., Reggiani, P. and Muthuwatta, L.P. (2011) Regionalisation for Lake Level Simulation—The Case of Lake Tana in the Upper Blue Nile, Ethiopia. Hydrology and Earth System Sciences, 15, 1167-1183. https://doi.org/10.5194/hess-15-1167-2011