Journal of Geographic Information System
Vol.10 No.01(2018), Article ID:81588,24 pages
10.4236/jgis.2018.101001
Assessment of Potential Aerodrome Obstacles on Flight Safety Operations Using GIS: A Case of Murtala Mohammed International Airport, Lagos-Nigeria
A. O. Ayeni, A. Musah, S. K. Udofia
Department of Geography, University of Lagos, Lagos, Nigeria

Copyright © 2018 by authors and Scientific Research Publishing Inc.
This work is licensed under the Creative Commons Attribution International License (CC BY 4.0).
http://creativecommons.org/licenses/by/4.0/


Received: August 13, 2017; Accepted: January 2, 2018; Published: January 5, 2018
ABSTRACT
The study focuses on the spatial analysis of the threat of potential Aerodrome obstacles on flight safety operations, in Murtala Mohammed Airport, Ikeja Lagos State. The study arises from the cases of flight safety in Nigerian airports which begins from the time passengers board the flight to the take-off time and location, the taxing of the plane and ends at the landing. The research employs GIS to model the 3D obstacles of the aerodrome, which demonstrated the ability in classifying the various threats on the aerodrome. The data acquired for this study ranging from primary data which included georeferencing of the obstacles that are found along the aerodrome with a Differential Global Positioning System (DGPS) to secondary data which included all base maps and satellite images. The spatial data conversion and manipulations were done using the ArcGIS 10.3.1 software. The 3D simulation of the obstacles was done in the ArcScene environment. To examine the spatial patterns of the obstacles around the aerodrome, the Average Nearest Neighbour Analysis (ANN) was used as statistical function from ArcGIS. The obstacles found within the MM2 aerodrome were grouped into the tolerant and non-tolerant ones. However, the finding shows that MM2 aerodrome conforms to ICAO standards and recommended practices. The study thus recommends strict daily monitoring of flight route to mark objects for foundation on the non-tolerance zones.
Keywords:
Aerodrome, Obstacles, Limitation, Conformal, Non-Conformal

1. Introduction
For so many reasons human beings move from one location to another, transportation therefore can be termed the movement of people, animals and goods and even services from one geographical point to another. The various modes of transport include roads, railways, airways, waterways, pipelines and even canals, and various terminals, airports, railway stations, bus stations, trucking terminals, depots and seaports [1] . Terminals are sometimes used both to exchange travellers and goods for maintenance of these carriers [2] . Operations are concerned with the day to day usage of vehicles and the methods of their usage [2] . Within the sector of transportation operations and ownership of any facility can either be private or public, depending on government policies [1] .
Aviation industry (Air transport system) is a critical component of our national economy providing for the movement of people and goods throughout the world, which is also critical for economic growth. It is a fast-growing sector of the economy, providing a number of social and economic benefits [3] . In order for an aircraft to move from one place to another, aerodromes are constructed to facilitate such movement [4] . According to International Civil Aviation Organisation [4] , Aerodrome can be describe as locations on the earth surface designed for any activities of the aircraft which may involve landing, taking off of aircraft [5] . While, aircraft is any machine that can derive support in the atmosphere from the reactions of the air other than the reactions of the air against the earth’s surface. Civil Aviation [6] defined the airspace around the aerodromes to be maintained free from obstacles so as to permit the intended aeroplane operations at the aerodromes from becoming unusable by the growth of obstacles around the aerodromes [5] . The Nigerian Civil Aviation Authority (NCAA) is the agency of government that is mandated to regulate and stop construction of any form whose height and location possess danger or are an obstacle to safe operations.
There have been several cases of plane crashes resulting from aerodrome obstacle either Man-Made obstacle or Natural Relief features mostly around the airport vicinity. These include but not limited to ADC Airlines Flight 86 (Boeing 727-231) in November 11, 1996; Dana Air Flight 992 of June 3, 2012 which crashed in close proximity of the airport; on the 4th of September, 1971, an Alaska Airline flight 1866, crashed at Juneau into the mountain; Associated Aviation Flight 361 in October 3, 2013, and Nigeria Airways Flight 825 which crashed in November 20, 1969 [7] [8] [9] [10] [11] .
However, it is of interest to note that none of the previous studies have use GIS as a tool of investigation for Obstacle assessment and mitigation against reoccurrence of aircraft collision with fixed obstacles within aerodrome vicinity [12] . Therefore, the focus of this research is to exploit the possibility of using GIS as the tool for monitoring and assessing obstacles within aerodrome vicinity particularly in a busy commercial airport such as Murtala Mohammed International Airport (MMIA). More so the study is confined to the Special surfaces built around airport with the objective of controlling installation and implantation of buildings and structures that can be detrimental to flight safety around aerodrome vicinity. These surfaces are referred to as the Obstacle Limitation Surfaces which though is designed based on ICAO standard alongside those practices which are approved in the ICAO document of the annex 14 which is a manual guiding the construction and implementation of aerodrome and its facilities. Unfortunately, as a result of rapid development around the aerodrome environment, managing and checking of these structures around the aerodrome has become problematic. The regulating agency do not have enough resources and man power to monitor the fast-growing communities around the aerodrome vicinity therefore infringing on the pre-defined surfaces designed specifically to ensure flight safety especially during the two critical phases of flying which are take-off and landing phases.
2. Study Area
Ikeja is located between Longitude 3˚18'30''E & 3˚23'00''E, and Latitude 6˚39'30''N & 6˚33'00''N (Figure 1). Ikeja LGA has been separated into 7 different zones, zone one covers all areas within the north central portion of Ikeja Metropolis, this zone is consisting of majorly residential builtup areas, though it is used by bankers and other survive offices from time to time, this zone is cut through by Isheri-Agege road. The second zone is majorly industrial, the zone is located around WEMPCO, ACME, Lateef Jakande road; zone 3 can be defined as multi-use because it has both residential, commercial and industrial outfits within, it is areas located around the Oba Akran Av., Aromire Av., Adeyini Jones, and to Obafemi Awolowo way is the divide of zone 3 and zone 5 [13] . The Fourth zone is located at the Eastern portion of Ikeja, it is those areas around the secretariat road, Ikosi Rd to Oregun, to 7-up road finally ending up at Lagos/Ibadan Expressway extending to Ikorodu road. Zone 5 is the main commercial zone in Ikeja, it is the areas around Allen Avenue, Opebi rd, Ola Ayeni str, Toyin Str, Olowu str, Kodesho, Simbiat Abiola Rd, Otigba str, then Finall Opebi Lin rd [14] . Zone 6 covers the southern part of Ikeja, which is basically the GRA, Nigerian Army Barracks, Courts, etc. Properties along this road have gone through functional use change from residential to commercial [14] .
Ikeja local government area is where the Lagos International Airport (Murtala Mohammed) is located in Lagos State of Nigeria. The Architectural design of the airport was modelled after Amsterdam Airport, the official lunch of the Airport was done on 15th day of march 1979. The facilities that make up airfield include the runway and the taxiway. The runway is designated as 18R/36L which is for the runway on the International wing of the airport. On the local wing of the airport is the runway 18L/36R. The runway at the international terminal has a parallel taxiway attached to it while the runway at the local terminal has two parallel taxiways east and west of the runway. There is also an interconnection taxiway which links both the runways at the local and international terminal together.

Figure 1. Murtala Mohammed international runway in Ikeja LGA, Lagos State, Nigeria.
3. Data and Methodology
3.1. Data
The data shown on Table 1 below were used for the geospatial analysis of this research work; the table shows the data types, the description of the data and the uses for the data.
3.2. Data Processing
The satellite images collected acquired from Google earth was added to the ArcMap environment as a raster data format. The data was converted to vector data format using the on-screen digitization method. This was used for mapping of the aerodrome and other facilities within the airport. For the purpose of verification of current information on the ground, as shown in Figure 2 the shapefile was converted to KML file and this was uploaded and plotted on google earth real time image.
The GPS coordinates of all the obstacles within the airport was added to the ArcMap environment as event file then the file format was converted to shapefile for overlay on the aerodrome. The obstacles limitation was also overlaid on the other GIS datasets. The Digital Elevation Model and the contour lines, extracted

Figure 2. Overlay of KMZ file of the aerodrome on google earth real time image.

Table 1. Spatial data types and sources.
from the Nigerian topographical map series were used to create the topographic model which will represent real life topography showing the heights of the obstacles on the mean sea level around the aerodrome in the airport.
All the above spatial information were being checked for conformity with the regulation standards of the ICAO, using the Standards and Recommended practices on Obstacles and Limitation Surfaces of Annex 14 (Aerodromes) by an overlay function of the ArcGIS software .
3.3. Method of Data Analysis
The major analysis used for this research is overlay analysis; the overlay was used for the superimposition of all the multiple layers use for the research. To determine the proximity of some of the obstacles from the aerodrome, a buffer zone of about 50 m was created around the aerodrome especially those that will be within the approach way of flights.
The Average Nearest Neighbour Analysis (ANN) analysis is a function within the ArcGIS Toolbox; it is used to determine the spatial distribution pattern of obstacles within the aerodrome. The ANN measures and calculates the average distances between two or more geographical locations. The formula for the ANN is shown below,
where, Rn = Nearest neighbour vale,
D(Obs) = Mean observe nearst neighbour distance,
a = the area,
n = total number of points.
The interpretation key for the NNI is shown below.
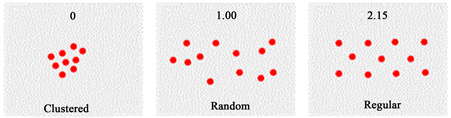
According to the ArcGIS help file 2015, whenever, mean distance is less than the mean for a hypothetical random distribution, of the feature of interest then result is taken as clustered, whenever the mean distance is greater than a hypothetical random distribution, then the result will taken as dispersed.
The ArcScene on ArcGIS was used was used for the mapping of the 3D surface. The height of all the obstacles where computed, hence the height where used to calculate the vertical exaggeration, then the base height was also created for it.
4. Results and Discussions
Identification Fixed Aerodrome Obstacles
As shown in Figure 3, five (5) surfaces are identified as Obstacle Limitation Surfaces (OLS) with Aerodrome.
A brief definition and the significance of OLS are as stated below.
1) The Take-off Climb Surface: A take-off climb surface is established for each runway direction that is meant to be used for take-off.

Figure 3. Murtala Mohammed obstacle limitation surfaces (OLS).
2) Approach Surface: An approach surface is design and created for each runway direction that is meant to be used to for aircraft landing.
3) Transitional Surface: Transitional surfaces are designed and created for any runway that will be used for aircraft landing.
4) Inner Horizontal Surface: The Plane is located 45 meters over the elevated surface of the aerodrome in a horizontal dimension (ICAO Annex 14 aerodrome vol.1). This is a bench mark for controls will be given for removal or masking of new and existing of obstacles for visual manoeuvring of airplanes around the aerodrome.
5) Conical Surface: This surface slopes upward and outward from the outside boundary of the inner horizontal surface. It is inclined at a slope angle of 5%, to a height of 80 to 145 m (ICAO, Annex 14, aerodrome vol. I).
In addition to location of features within the Obstacle Limitation Surfaces (OLS) as a parameter for identifying obstacles, the height of features within the OLS can also be used to know if the feature is an obstacle or not.
Obstacles within Murtala Mohammed International Airport (MMIA) Aerodrome Obstacle Limitation Surfaces
According to International Civil Aviation Organisation, Annex 14, obstacles are all temporary, permanent and moving objects that are found in areas that are meant for the taking off or landing of aircraft. These obstacles can be classified into tolerant and non-tolerant objects depending on their location relative to the aerodrome (Figure 4).
Tolerant Obstacles within MMIA: Being Tolerant means that despite that they are obstacles, they are very vital and relevant in ensuring flight operation within Murtala Mohammed aerodrome. The Tolerant Obstacles observed within MMIA Aerodrome includes Apron Light, Air Traffic Control tower, Meteorological mast, Very High Frequency Omini-directional Radio Range (VOR), Wind sleeve and Radar, Terminal building, Apron Light, Glide Path (GP) monitor and mast (Table 2 and Figure 5). Table 2 below shows the highest and the lowest elevation
Table 2. Elevation in meters for tolerant obstacles.

Figure 4. Obstacles within MMIA obstacles limitation surfaces (OLS).
of all the obstacles within the aerodrome, for the same obstacle that are more than one in number, but the obstacles that are just one in number has just the highest elevation without the lowest. That explains why their average elevation remains the same.
The Air Traffic Control Tower has the highest elevation value of 84.382 m while the Wind sleeve has the lowest elevation value of 46.1 m.

Figure 5. Tolerant obstacles within MMIA OLS.
Non-Tolerant Obstacles within MMIA: The Non-tolerant obstacles remain the focus of this study and therefore require regular monitoring in order to manage the continuous increase of these features due to improve in technology especially the telecommunication industry. The highest Non-Tolerant obstacle within the Murtala Mohammed aerodrome is the AIT Tower with the elevation value of 228.166 m while the lowest Non-Tolerant obstacle within the Murtala Mohammed aerodrome is the Bill Board with elevation value of 45.038 m (Table 3 and Figure 6).

Figure 6. Non-tolerant obstacles within Murtala Mohammed OLS.
The nearest neighbour index used to examine pattern of distribution [15] which stated that that should the index of the average nearest neighbour ratio be less than 1, then, the pattern shows clustering. But on the other hand, should the index be greater 1, and then the pattern tends towards dispersion. Based on this, the nearest neighbour index extension in the ArcGIS toolset was used to reveal spatial distribution pattern Obstacles within Murtala Mohammed Aerodrome vicinity.
The findings on the Non-Tolerant Obstacle shown that the overall Index generated from the Average Nearest Neighbour statistics of obstacles within Murtala Mohammed aerodrome Obstacle Limitation Surfaces Ratio is 0.550387 which implies that the distribution pattern of obstacles within this defined area is clustered (Table 4 and Figure 6). The reason for the clustering is because there are high concentrations of obstacles within this defined area (OLS). These obstacles include majorly Masts, Apron lights, and Pylons.
Table 3. Elevation in meters for non-tolerant obstacles.
Table 4. Summary of average nearest neighbor of non-tolerant obstacles in Murtala Mohammed international airport.
The findings on the 18L and 18R Take Off runway climb Surface shown that the distribution pattern of obstacles within this surface is clustered with the Nearest Neighbour Ratio of 0.825088 and 0.848159 respectively (Table 5, Figure 7 and Figure 8). The reason for the clustering is because there are high presences of Masts within this defined Take off surface area. The 18L and 18R Take off climb are located within Ifako Ijaye LGA and Agege LGA respectively. These LGAs are known to be residential and commercial areas with lots of buildings residents. This may account for the clustering nature of obstacles within Take-off climb surfaces of Murtala Mohammed.
The findings on the 36L and 36R Approach Obstacles shown that the distribution pattern of obstacles within these surfaces are dispersed and clustered with

Figure 7. 18L take off climb obstacles.
Table 5. Average nearest neighbour of 18L and 18R take off runway climb surfaces.

Figure 8. 18R take off climb obstacles.
the Nearest Neighbour Ratio of 1.246501 and 0.707290 respectively (Table 6, Figure 9 and Figure 10). The reason for disperse distribution pattern of obstacles within the 36L Approach path is that there are less numbers of Masts within this defined area. The obstacles that were prominent in 36L approach area include Localizer (LLZ), Doppler Very High Frequency Omini-directional Radio Range (DVOR) and buildings. The 36L Approach surface is located within Oshodi Isolo and Amuwo Odofin LGAs. The axis also characterised with industries with numbers of masts. The reason for the clustering in 36R approach area is because there are high presences of Masts within this defined area. The 36R Approach is located within Mushin, Surulere and Ajeromi Ifelodun LGAs. These areas are industrial in nature with lots of Industries and Masts.

Figure 9. 36L approach obstacles.
The findings on the Inner Horizontal Obstacles and Conical Obstacles shown that the distribution patterns of obstacles within these surfaces are clustered with the Nearest Neighbour Ratio of 0.514202 and 0.529373 respectively (Table 7, Figure 11 and Figure 12). The reason for cluster distribution pattern of obstacles within these areas is that there are lots of Masts especially along the Taxi wing of the Local runway. Other obstacles found within this defined area include Pylons, Towers and Buildings. The 36L Approach surface is located within Oshodi Isolo and Amuwo Odofin LGAs. The axis also characterised with industries with numbers of masts. The Inner Horizontal surface is located within Ikeja, Alimosho, Oshodi and Agege LGAs while Conical area covers the Ikeja, Alimosho, Oshodi, Agege, and Mushin LGAs. These LGAs are both residential and industrial in nature. This may account for the clustering nature of obstacles found within the two areas.

Figure 10. 36R approach obstacles.
Table 6. Average nearest neighbor of 36L and 36R approach obstacles.

Figure 11. Inner horizontal obstacles.
Table 7. Summary of average nearest neighbor of inner horizontal obstacles and conical obstacles.

Figure 12. Conical obstacles.
The findings on the Transition Surface Local runway and Transition Surface International runway obstacles shown that the distribution patterns of obstacles within these surfaces are clustered with the Nearest Neighbour Ratio of 0.476546 and 0.809207 respectively (Table 8, Figure 13 and Figure 14). The reason for cluster distribution pattern of obstacles within these areas is that there is high presence of obstacles which includes Apron Light, Street Light, Hangar, Windsleeve, trees and short Masts. The Transition Surfaces are located Agege, Alimosho and Ikeja LGAs.
Level of conformity of potential Aerodrome Obstacles to the International Civil Aviation Orgainsation (ICAO) Standards and Recommended Practices (SARDS)

Figure 13. Transition local obstacles.
Table 8. Average nearest neighbor of transition surface local runway and transition surface international runway obstacles.

Figure 14. Transition international obstacles.
Based on the ICAO Recommendation that objects or features found within the Inner Horizontal surface of an aerodrome Obstacles Limitation Surfaces (OLS) must be below 45 m (Annex 14 Aerodrome). Going by the limit of 45 m provided by the Inner Horizontal surface, the result of the research shows that most of the features found within the Inner Horizontal surface are greater than 45 m. This can be shown in Figure 15 below.
Figure 15 shown features that are in conformance and non-conformance with the set standard and recommended practices (SARPS) stipulated by the ICAO Those not in conformance were coloured as Black dots while those in conformance are depicted in Green colour. From the analysis, the total numbers of obstacles found within Murtala Mohammed aerodrome Obstacle Limitation Surfaces (OLS) are Nine Hundred and Three (903) out of which the obstacles that

Figure 15. Conformance and non-conformance obstacles.
conform by being less than 45 m in elevation are One Hundred and Sixty-three (163). Most of them that conform were within the Inner Horizontal surface. In percentage value the total obstacles that conform in relation to the total obstacles is One Hundred and Sixty-Three divided by Nine hundred and Three Multiplied by One hundred which is equal to Eighteen Percentage (18%) which is less than Fifty Percentage (50%) of the total Obstacles. This strike as a danger for Murtala Mohammed airport if not properly checkmate by adhering to alternate option as proffered by ICAO.
Safety Implication of the Location and distribution of Aerodrome Obstacles
The distribution pattern of obstacles within the aerodrome vicinity increases the chances or the probability of air crashes like in the case of September 27, 1973, Texas International Airlines Flight 655 which crashed into Black Fork Mountain. The Crash killed 8 passengers and 3 crew members. The pilot descended below the minimum safe Altitude (MSA) for the aerodrome while he was trying to circumnavigate a thunderstorm.
Calculating Minimum Safe Altitude (MSA) is achievable by determining the highest obstacles within the various segment of approach into an aerodrome. In approach procedure, pilot descends based on the parameters applicable to the different segment of approach which is classified into Initial Approach, Intermediate Approach and the Final Approach. For each segment of this approach the obstacles with the highest elevation is determined and are referred to as the controlling obstacles. Based on the segment in which these controlling obstacles are identified a specified buffer is added to help prevent aircraft from colliding with obstacles within these segments. For the Initial Approach, the highest obstacle which is the controlling obstacle is added a buffer of 300 m while for the controlling obstacles within the Intermediate and final Approach, the buffers of 150 m and 75 m respectively are added to help avert the risk of colliding with obstacles within these segments. Due to weather condition and poor visibility, it is important for pilot to adhere strictly to the instruction or clearances issued by the air traffic controller to help ensure that collision risk is averted as much as possible.
Due to the erection of new obstacles within the aerodrome vicinity (Murtala Mohammed aerodrome) new flight procedures may need to be changed by the Airspace and procedure designer. If a pilot has not be properly briefed by the Aeronautical Information Services (AIS) through publication such as Notice to Airmen (NOTAM) and Aeronautical Information Publication (AIP) concerning change in the flight procedures and instead used outdated flight procedures, the pilot stand a high risk of colliding with obstacles within the aerodrome vicinity. The impact of obstacles on procedure design is very well documented in the ICAO document 8168 which is referred to as procedures for Air Navigation Services-Aircraft Operations (PANS-OPS).
The performance of aircraft is affected by numerous procedures and turns embarked upon by the aircraft leading to waste of fuel and time. Instead of an aircraft going for a straight in approach, due to the erection of obstacles, such aircraft would have to manoeuvre to prevent colliding with the obstacle based on the procedure design as published in the Approach plate and this can affect the angle of descent for the aircraft making it difficult to touch down at the beginning of the runway which is known as the runway threshold. Depending on the category of the aircraft which is a direct relationship with the speed of the aircraft, such aircraft can overshoot its runway. This can be experienced by Heavy International aircraft such as Boeing 777 or Airbus 380. The only way to accommodate this crisis is to increase the runway length to further accommodate the speed limit of such aircraft on touchdown. For country like Nigeria, a huge sum of money would be required to carry out this runway extension.
5. Conclusion
This research is carried out to identify and map obstacles within the aerodrome of the MM airport Ikeja. The study reveals that there are still some obstacles within the flight approach part of the aerodrome; the buffer analysis tool was able to identify those obstacles within the aerodrome. The ANN was also able to show the degree of cluster of the obstacles. These findings show that Nigeria as a state has not fully conformed to the ICAO rules on the establishment of Fixed Obstacles and Obstacle limitation surface within aerodrome and airspace. The use of GIS as a tool for the mapping of the aerodrome and the 3D visualization of the obstacles was very powerful.
6. Recommendations
1) NCAA should establish an office, and appoints dedicated member of its staff to see to the daily filed monitoring and observation of all lights found within and outside the aerodrome, and report defaulters for necessary actions to be taken. This will ensure flight safety.
2) Objects within the approach surface should be cleared as soon as they are identifying for smooth flight operations.
3) All Obstacles found within the transitional surfaces should immediately be marked and lighted to check it adverse effect on the aerodrome meteorological minima.
4) The inner horizontal surface should be clearly marked.
5) Obstacle profile should be established based on the clear understanding of the performance requirements of the frequent aircraft on the aerodrome.
Cite this paper
Ayeni, A.O., Musah, A. and Udofia, S.K. (2018) Assessment of Potential Aerodrome Obstacles on Flight Safety Operations Using GIS: A Case of Murtala Mohammed International Airport, Lagos-Nigeria. Journal of Geographic Information System, 10, 1-24. https://doi.org/10.4236/jgis.2018.101001
References
- 1. Blanchard, G. (1996) Intelligent Transportation System and Highway Infrastucture. Report TP12836E, Special Infrastructure Report, Economic Transport Analysis Canada, Ottawa.
- 2. Ayinalem, B. (2015) Wheel/Rail Adhesion under Plastic Bags Contamination Condition. A Master’s Thesis, The School of Mechanical and Industrial Engineering, Addis Ababa University, Addis Ababa Institute of Technology School of Mechanical and Industrial Engineering, The Ashden Trust, London, ICAO 2001.
- 3. Whitelegg, J. (2000) Aviation: The Social, Economic and Environmental Impact of Flying. Stockholm Envt’l Institute, University of York England, Ecological Ltd., Lancaster.
- 4. International Civil Aviation Organisation ICAO (2009) International Standards and Recommended Practices. Annex 14 to the Convention on International Civil Aviation, Aerodromes, Volume 1 Aerodrome Design and Operations, 5th Edition.
- 5. CAR (2006) Aerodrome Design and Operations. Government of India Office of Director General of Civil Aviation Technical Centre. Opp Safdarjang Airport, New Delhi Civil Aviation Requirements Section-4, Aerodrome Standards & Air Traffic Services Series ‘B’, Part I, 31st July 2006.
- 6. Civil Aviation Act (2006) Civil Aviation Authority Report and Accounts. CAA, London.
- 7. The Nigerian Voice (2012) The Ethnic Origin of Plane Crashes: A Memo on Plane Crashes in Nigeria. https://webcache.googleusercontent.com/search?q=cache:XV4dFUOn8MAJ:https://www.thenigerianvoice.com/news/93234/1/the-ethnic-origin-of-plane-crashes-a-memo-on-plane-crashes-in-nigeria.html+&cd=1&hl=en&ct=clnk&gl=ng
- 8. Channels Television (2013) Timeline of Plane Crashes in Nigeria. https://www.channelstv.com/2013/10/04/timeline-of-plane-crashes-in-nigeria/
- 9. Air & Space Magazine (2013) Alaska’s Crash Epidemic: How Technology and an FAA Regional Office Ended It. http://www.airspacemag.com/flight-today/alaskas-crash-epidemic-70259395/#IFPvMm7cUztx4Bg8.99
- 10. Leadership (2015) 90 Years of Nigeria’s Aviation: Milestones. http://leadership.ng/news/474259/90-years-of-nigerias-aviation-milestones
- 11. Premium Times (2017) 10 Worst Plane Crashes Involving Nigeria. http://www.premiumtimesng.com/news/5556ten_worst_plane_crashes_involvin nig eria.html
- 12. Fricke, H. and Thiel, C. (2015) A Methodology to Assess the Safety of Aircraft Operations When Aerodrome Obstacle Standards Cannot Be Met. Open Journal of Applied Sciences, 5, 62-81. https://doi.org/10.4236/ojapps.2015.52007
- 13. Oni, A.O. (2007) Analysis of Accessibility and Connectivity of Ikeja Arterial Roads. 1st National Conference, Lagos, 25-27 September 2007.
- 14. Oni, A.F. (2015) Building-Use Conversion and the Perceptual Assessment of Utilities Serviceability in Lagos Metropolis, Nigeria. PhD Thesis, The School of Postgraduate Studies, University of Lagos, Lagos.
- 15. Clark, P.J. and Evans, F.C. (1954) Distance to Nearest Neighbour as a Measure of Spatial Relationship in Population. Ecology, 35, 445-453. https://doi.org/10.2307/1931034