Journal of Geographic Information System
Vol.08 No.03(2016), Article ID:66348,12 pages
10.4236/jgis.2016.83027
Urban Growth Modeling Using Neural Network Simulation: A Case Study of Dongguan City, China
Xinmin Zhang
Graduate School of Life and Environmental Sciences, University of Tsukuba, Tsukuba, Japan

Copyright © 2016 by author and Scientific Research Publishing Inc.
This work is licensed under the Creative Commons Attribution International License (CC BY).
http://creativecommons.org/licenses/by/4.0/


Received 1 March 2016; accepted 8 May 2016; published 11 May 2016
ABSTRACT
Dongguan is an important industrial city, located in the Pearl River Delta, South China. Recently, Dongguan city experienced a rapid urban growth with the locational advantage by transforming from traditional agricultural region to modern manufacturing metropolis. The urban transformation became the usual change in China under the background of urbanization which belongs to one trend of globalization in the 21st century. This paper tries to analyze urban growth simulation based on remotely sensed data of previous years and the related physical and socio-economic factors and predict future urban growth in 2024. The study examined and compared the land use/cover (LUC) changes over time based on produced maps of 2004, 2009, and 2014. The results showed that water and forest area decreased since the past years. In contrast, the urban land increased from 2004 to 2014, and this increasing trend will continue to the future years through the urbanization process. Having understood the spatiotemporal trends of urban growth, the study simulated the urban growth of Dongguan city for 2024 using neural network simulation technique. Further, the figure of merit (FoM) of simulated map of 2014 map was 8.86%, which can be accepted in the simulation and used in the prediction process. Based on the consideration of water body and forest, the newly growth area is located in the west, northeast, and southeast regions of Dongguan city. The finding can help us to understand which areas are going to be considered in the future urban planning and policy by the local government.
Keywords:
Urban Growth, Neural Network Simulation, Dongguan City

1. Introduction
With the development of urban growth around the world, China has also experienced rapid urban development. The phenomenon of urban growth has been expanded especially in the developing countries. Some studies estimated that more than three billion people will be living in urban areas by 2050, of which 80% will be inhabitants of cities in developing countries [1] [2] . Kamusoko et al. [3] summarized the whole emergency of urban growth in Asia and Africa: According to the United Nations [1] , the urban population in Asia is expected to increase from 1.8 billion in 2010 to 3.4 billion in 2050, while the urban population in Africa is projected to rise from 0.8 billion in 2010 to 3.4 billion in 2050. With the increase of urban population, it requires more rapidly urban expansion in the city and enough urban infrastructures to satisfy living needs for the urban population. What’s more, urban growth is the key phenomenon of urban development and it produces the related economic development to the whole city.
Urban expansion in China has been booming at a rapid rate. The annual expansion rate from 2007 to 2012 was reported to be 5.2% [4] . There is a lot of literature on the urban growth of Chinese cities that have been analyzed in recent years. Urban growth and its environmental impacts were investigated and compared in three regions of China: Jing-Jin-Ji, the Yangtze River Delta and the Pearl River Delta [5] . The three regions have been the popular areas studied by Chinese scholars. They tried to analyze urban growth in different cities at each of different scales and attempted to predict the development of urban growth in the future. The research of urban growth has also been observed in the Dongguan city of China where urban and industrial lands have been rapidly and continually expanding [5] .
Ecological security has become a major issue under the circumstance of fast urbanization in China and the fast urban development has caused significant threats to natural area protection [6] . With the development of urban expansion, this possibly has to an extent damaged ecological security [6] . Every city needs to consider and protect urban green space in order to protect and offer enough livable and comfortable environment to persons living in their city or community. This requires that planning of a city is more scientific and sustainable under the balanced condition between urban expansion and ecological security.
Tobler [7] was perhaps the first to approbate the advantage of Cellular Automata (CA) in solving complex geographical problems and applied CA models to simulate the expansion of Detroit region and first mention of the first law of geography. Couclelis et al. [8] [9] put forward the theoretical framework for geography-oriented CA and applied it to the simulation of urban expansion and population dynamics and discussed the potential interest of CA to geographers in the aspect of urban growth simulation. Batty et al. [10] [11] showed a series of researches in simulating urban growth and urban form based on fractal theory and CA and presented a class of urban models called DUEM and used it to simulate urban dynamics in Buffalo. White and Engelen [12] analyzed the CA application in the field of urban planning. White and Engelen [13] gave a spatially detailed representation of the evolution of urban land-use patterns of Cincinnati based on constrained CA. Clark and Gaydos [14] developed the SLEUTH model and it has been applied to two rapidly growing, but remarkably different urban areas in the San Francisco Bay and the Washington/Baltimore corridor, respectively. Wu et al. [15] [16] developed the MCE-CA model and has been successful in putting forward transition rules by AHP and Logistic Regression to simulate urban expansion of Guangzhou, China.
Chinese local scholars have high contributions on urban growth simulation. Li X. and Yeh A. G. O. et al. [17] [18] proposed transition rules/function of MCE, ANN, grey cells, genetic algorithm, ant colony algorithm etc. They also researched the uncertainty characteristic of CA and the concept of Geographical simulation and optimization systems firstly appeared [19] . Further MAS is the new approach that needs to be integrated with CA in recent decades. Li X. and Liu X. P. et al. [17] [18] integrated CA, MAS and spatial optimization for simulating urban expansion and searching the optimal facility sitting/transport development/natural protection, and taken applications in Fisher-based CA, Kernel-based CA, Support Vector CA, Rough Sets, Case-based CA, High-di- mensional Feature Space, ACO (Ant Colony Optimization) CA, simulated annealing, artificial immune system for simulating urban expansion. Three heuristic algorithms often used into the discipline of urban planning, which needs to basically integrate with CA for simulating land use and land cover, and these are the new innovation approaches for modeling LULC for our cities more sustainable and scientific.
The ANN-Urban-CA model can simulate and forecast the complex and non-linear spatial-temporal process of urban growth in a reasonably short computational time [20] . Thus, ANN-CA is adaptable choice to apply into the simulation process of urban growth. The related study on this city has indicated that Dongguan has transformed from a traditional agricultural county to a modern manufacturing metropolis over the last two decades [21] . This transformation became the usual change in China under the background of urbanization which belongs to one trend of globalization in the 21st century, most land categories transformed from non-urban to urban according to urbanization process.
The author summarized three purposes concerning the research work from two perspectives, and these were expressed as follows: 1) From the perspective of influenced factors, the influenced factors were divided into physical factors and socio-economic factors, thus this research aimed to simulate urban expansion of Dongguan city by integrating physical and socio-economic factors; 2) From the perspective of the research model, the author used ANN model into the study. It aimed to analyze urban development based on ANN model and the best result of kappa index was discussed and explored to the further analysis for predicting urban growth of Dongguan city in 2024.
The purpose of this paper is to analyze urban growth simulation based on remotely sensed data of previous years and the related physical and socio-economic factors, and predict urban growth in the projected year in 2024. The prediction can help us to find the future development plan of this city and the potential areas which are going to be considered into the future plan by the local government. Urban growth simulation is popular to be applied and used in the future plan from the perspective of urban planning. The observed urban expansion in China and particularly cities like Dongguan has prompted many researchers to develop and use simulation approaches to study urban expansion as a way of predicting the future and aid in future decision-making.
2. Research Area and Data Resources
2.1. Research Area: Dongguan City
Dongguan is an important industrial Chinese city located in the Pearl River Delta bordering the provincial capital of Guangzhou to the north, Huizhou to the northeast, Shenzhen to the south, and the Pearl River to the west. The study area is shown in Figure 1.

Figure 1. Study area: Dongguan city, China.
The location of Dongguan city has an advantage in the aspect of geography as it has absorbed more investments and commercial activities in this city. Dongguan city administration was considered especially progressive in seeking foreign direct investment. Since the implementation of reform and opening-up policy, Guangdong province had a chance to develop its economy under the supports of the Chinese government that created the greater gap and difference with other regions in China. This policy prompted enough labor coming and working in Guangdong province. According to the related labor bulletin data, Zhang H. [22] indicated that migration has become a quintessential feature prompting millions of young rural women who have left their home villages and migrated to urban areas for wage labor in the past two decades in China. These young labor created economic development and became newly growing economic labor sources in the rapidly developing regions. With the advantage of the geographical characteristic are located in the south of China, this region has become a rapid development province in China. What’s more, rapid development increased with rapid economic development and rapid urbanization.
Dongguan city has been studied and chosen as a classical research area by Li X. and Liu X. P. et al. [17] [18] and many influential methodologies and theories were mentioned and applied based on this city. As to the selection of this city, one of the most important reasons was regarding as hot spot area by Chinese scholars and easily compared with other studies, thus this city becomes the good choice for taking a case study.
2.2. Data Collection
Geographical studies should be considered on research area and its data. This study used many basic geographical data on the research area of Dongguan city. Most data was considered based on previous studies on the aspect of urban simulation. The data used in the study is described as follows:
1). Remote sensing data: Landsat TM and ETM+ data was downloaded from Earth Explorer of USGS (http://earthexplorer.usgs.gov/) with three imageries in 2004, 2009 and 2014 with 30-m resolution. Landsat images are unique in that they provide complete global coverage, they’re available for free, and they span nearly 40 years of continuous Earth observation. At the beginning of searching better satellite imageries which were going to be used on the analysis process, 10% cloud free was the important step for collecting the required data. The level 1T product type, which has been geometrically corrected were subsequently analyzed for LULC changes.
2). DEM (Digital Elevation Model) data. This data was downloaded from NASA with 30-m resolution. The USGS Digital Elevation Model (DEM) data files were digital representations of cartographic information in a raster form. DEMs consist of a sampled array of elevations for a number of ground positions at regularly spaced intervals. These digital cartographic/geographic data files were produced by the USGS as part of the National Mapping Program (http://data.geocomm.com/dem/). DEM reflects the altitude of earth points on research area and influences on the process of urban growth. Thus this factor was considered to be an indicator of analyzing urban growth simulation.
3). Slope data. The slope data was extracted from the DEM data under the platform of using ArcGIS. Slope reflects whether the surface holds on the steep situation or not, and influences in the evolution process of LULC changes. Steep areas could not transform from any category of LULC to urban especially achieves to the high degree of steep areas, that’s why this indicator should be considered in the simulation process.
4). Socio-economic data. These shape files reflect the basic urban infrastructures of the city, and this can be easily found from the situation of urban systems among the whole city. It includes national road, provincial roads, city center, town centers and railway stations. Most of these urban systems were regarded as important resources of urban growth. Some shape files were made by Google Earth for obtaining KML data, especially the shape files of provincial roads and national road, and these data could not directly download from the related officially geographical website.
According to the consideration of integrating the physical factors and the socio-economic factors among the urban growth simulation, it is better to help us understand the trend and mechanism of urban growth under the simulation of considering comprehensive factors on this city and provide better decision-making on the urban planning development for local government.
3. Methodologies
3.1. Basic Data for Simulation
The physical factors and socio-economic factors were used and considered in the simulation environment. The land use type included urban land, forest, agricultural land, bare land and water body. The physical factors include DEM and Slope. The socio-economic factors include distance to the central city, distance to towns, distance to railway stations, distance to national road and distance to provincial roads.
Figure 2 shows the Normalized Euclidean distance to the central city a), towns b), railway stations c), the national road d), provincial roads e) and the normalized value of DEM f) and Slope g), respectively. Figure 2(a) shows the central city from the central point; Figure 2(b) shows the normalized distance to the towns, these locations for each town can be found from these points; Figure 2(c) shows the normalized distance to the railway stations, 5 stations can be seen from these points in Dongguan city. Figure 2(d) shows the normalized distance to the national road. The national road goes through the central city and boarding Shenzhen city to the south and Guangzhou to the Northwest; Figure 2(e) shows the normalized distance to the provincial roads. The DEM imagine was downloaded from the SRTM data of USGS, and the Slope map was extracted from DEM imagine. The highest value of DEM (Figure 2(f)) and Slope (Figure 2(g)) were located at the east of Dongguan city. All of the normalized values were defined from 0 to 1.
3.2. Theory of ANN-CA
For neuron j in the receiver layer, the net input from the collection process is calculated by:

where Ii is the signal from neuron i of the sender layer; netj is the collection signal for receiver neuron j; and wij
 (a) (b) (c)
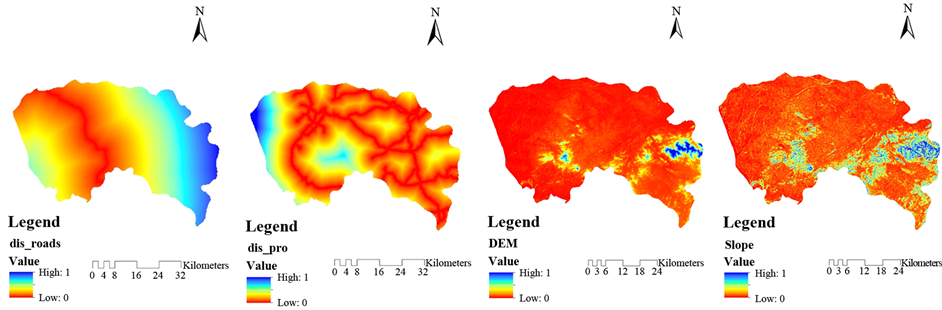 (d) (e) (f) (g)
Figure 2. Normalized Euclidean distance to (a) the central city, (b) towns, (c) railway stations, (d) the national road, (e) provincial roads and the Normalized value of (f) DEM and (g) Slope, respectively.
is the parameter or weight to sum the signals from different input neurons. The receiver neuron creates activation in response to the signal netj. The activation usually created in the form of sigmoid function.

The simulation is cell-based and each cell has a set of n variables as the inputs to the neural network. These variables can be obtained by using GIS buffer and overlay analysis, and these can be expressed as follow.

where xi is the ith site attribute and T is transposition.
Scaling each variable treats them as equally important inputs to neural networks and makes them compatible with the sigmoid activation function that produces a value between 0 and 1 [23] . The transformation is carried out by:

in the hidden layer, the signal received by neuron j from the input layer for cell k at time t is calculated by:

where netj (k, t) is the signal received by neuron j in the hidden layer; wi,j is the parameter or weight between the input layer and the hidden layer, and xi' (k, t) is the scaled site attribute associated with neuron i in the input layer with regard to cell k and time t. The activation of the hidden layer to the input signal is calculated by:

A high value means that the conversion probability from the existing type to the lth type of land use is greater. Conversion probabilities are calculated by the following formula according to the output function of neural networks:

where P (k, t, l) is the conversion probability from the existing to the lth type of land use for cell k at time t, and wj,t is the parameter or weight between the hidden layer and output layer.
A stochastic disturbance term is usually incorporated in CA simulation to generate more plausible results, the error term can be defined as [12] :

where y is a uniform random variables within the range of 0 and 1, and a is the parameter to control the size of the stochastic perturbation. a can be used as a dispersion factor in the simulation [23] . The disturbance is incorporated in the neural network based CA model for more realistic simulation, the conversion probability is revised as follow:

3.3. Model Comparison Techniques
The Kappa statistic is computed from a confusion matrix derived from a cell-by-cell comparison of the observed map and the predicted map [24] .
Van Vliet et al. [25] developed kappa simulation which uses adjusted information from the original land use map to test the agreement between the simulated land use map and the actual land use map. In this method, Van Vliet et al. [25] integrated conditional probabilities of expected agreement with the original Kappa statistic. Kappa simulation and its variations can be expressed as:


where Pe (Transition) is the expected fraction of agreement, given the sizes of the class transitions and Pmax (Transition) is the maximum accuracy that can be achieved given the sizes of the class transition [25] . The results of KSimulation and Ktransloc range from −1 to 1, where 1 indicates perfect agreement between simulated and actual land use class, 0 represents chance agreement due to random distribution and below 0 indicates less accurate than chance agreement due to random distribution. The value of KTransition varies from 0 to 1, where 0 indicates no class transition and 1 indicates perfect agreement between size of class transition in simulation and reality.
4. Results
4.1. Analysis on Dynamic Changes of LULC in Dongguan City
The three imageries were downloaded from USGS, which was managed by US geological survey. Based on the three imageries, it was easy to classify LULC through ArcGIS by using Maximum Likelihood (ML) classification method. The Spatial Analyst in ArcGIS contains a tool called the Maximum Likelihood classification tool which can be used to derive a thematic map from satellite images [26] . The classification results are shown in Figure 3. Five categories of LULC were classified on this city and Figure 3 shows LULC of Dongguan city in 2004 a), 2009 b), and 2014 c), respectively. The LULC categories included: urban land, crop land, bare land, forest and water on this city. Based on the consideration of moist climate in the South China, thus the minor of grassland was not considered in the 5 categories. The urban land (2009, 2014) was expanded compared with the previous urban land (2004, 2009) obviously according to three years.
Subsequently, a comparative study on different kinds of land cover was discussed in 2004, 2009 and 2014. Figure 4 shows the percentage of LULC changes in these three years. These values directly reflect the value of each LULC category in Dongguan city, and especially this type was expressed specific information in detail. It was easy to see the trend of the increase and decrease in 5 LULC categories. Figure 4 shows water and forest
 (a) (b) (c)
Figure 3. LULC maps of Dongguan city in 2004 (a), 2009 (b), and 2014 (c).

Figure 4. Percentage of land use changes in 2004, 2009, and 2014.
decreased from the past years, in contrast, the urban land increased from 2004 to 2014, and this increasing trend will continue to the future years among the urbanization process.
Figure 5 shows the spatial distribution of changes in the urban area based on observed maps of a) 2004 and 2009, b) 2009 and 2014. Each category for each map includes unchanged non-urban, unchanged urban and changed non-urban to urban these 3 categories. The two maps can help us obviously to see which area was non-urban, urban and the newly growing area compared the previous year in 2004 and 2009, respectively. Newly growing area was distributed on the basis of cropland and bare land because this area was easily converted from non-urban to urban.
The classification accuracy is an important way to evaluate the classification results what can be accepted and used in the analysis of LULC changes. The further analysis of urban growth simulation was applied in Dongguan city. Most values of classification accuracy for each category was kept high value than 85% and the total classification accuracy was high than 85%. Although some values were low than 85% or even low than 80%, this didn’t create bad influences to other results, thus these classification results have high acceptance in these three years.
4.2. Results of Urban Simulation and Comparison
Figure 6(b) shows the ANN-CA simulation result in 2014. The actual map (Figure 6(a)) and the simulated map (Figure 6(b)) look similarly on the two maps. It means that better simulation result obtained in 2014 was good. It needs to use quantitative methods to statistic the correctness and error. Subsequently, Figure 7 shows the spatial distribution map of simulation correctness and error based on three map comparison. We can see from this map, and find where hits, misses, false alarms and null successes are. It shows the percentage of overall simulated correctness and error in landscape. The percentage of hits, misses and false alarms shows small values on the simulation process. The value of Figure of Merit (FoM) was calculated to identify the simulation evaluation result [27] , and the value of FoM was calculated at 8.86%.
Pontius & Millones [28] developed a simpler and more useful approach to report disagreement between the observed map and predicted map. Kappa Transition is another index to evaluate the simulation results. The value of Kappa Transition varies from 0 to 1, where 0 indicates no class transition and 1 indicates perfect agreement between size of class transition in simulation and reality. The value of kappa transition was approximate to 0.5. These results show that ANN model was relatively accurate for simulating land use/cover quantity.
The value of Kappa transition varies from 0 to 1, where 0 indicates no class transition and 1 indicates perfect agreement between size of class transition in simulation and reality. On the calculation process, the kappa transition was calculated about 0.5. This index is another way to evaluate simulation result. At least this result can be accepted and used in urban growth prediction in Dongguan city. Based on the consideration of water body and forest, the newly growth area is located on the west, northeast, and southeast regions of Dongguan city in 2024. These areas are going to be the new planning area for urban planning department in future in Figure 8.
5. Conclusions
Urban growth has been the trend of urbanization in global cities. Dongguan city has increasingly been the most
 (a) (b)
Figure 5. Spatial distribution of change in urban area based on observed maps of (a) 2004-2009and (b) 2009-2014.
 (a) (b)
Figure 6. (a) Actual map and (b) ANN-CA simulation result in 2014.
rapidly growing city in China. The research result indicated that the urban growth process will be continued into the future among the urbanization process. According to the previous study in Dongguan city, some conclusions were made on the below. These contents were reflected the main ideas on the mechanism of urban growth in Dongguan city on this study.
1). The land use types of urban land increased from 2004 to 2014. Dongguan city has been undergoing rapid

Figure 7. Spatial distribution of simulation correctness and error based on three map comparison.

Figure 8. Spatial distribution of changes in urban area based on observed maps of 2014 and 2024.
urbanization compared from 2004 to 2014 year and this process will continue into the future on the urbanization process. Agricultural land and bare land were the mainly changed categories in the urban growth process based on the defined 5 categories of LULC. These two categories were easily converted to urban because agricultural land and bare land were distributed on the flat area which has a high probability for the evolution process.
2). Towns have an obvious trend of urban growth in Dongguan city. Towns have been the new increasing factor for the contribution of urbanization in Dongguan city, and that’s need to provide more help and policies by local government for urban development on these towns. This will gradually have a highly distribution of urban area and achieves the total urbanization on the whole city.
3). Provincial roads have high contributions to urban growth and constructing urban pattern based on the shape of provincial roads. It reflects a high relationship between the provincial roads and urban pattern. The national road didn’t have a high correlation with the urban pattern, thus it is indicated that the provincial roads have high contribution than the national road from the perspective of urban pattern. Emphasizing on the development of surrounding the towns and provincial roads will achieve highly urbanization and fulfill economic development in Dongguan city.
4). FoM is an important index to evaluate simulation result of urban growth, and FoM value 8.86% can be accepted in the simulation process and used in the prediction. Kappa transition of the artificial neural network has a perfect agreement between the size of class transition in simulation and reality. These two methods have been applied to evaluate the results of urban growth simulation.
5). Based on the consideration of water body and forest, the newly growth area is located in the west, northeast, and southeast regions of Dongguan city; these areas are going to be the new planning area for urban planning department in future. According to the results, cropland and bare land were the mainly changed categories in the urban growth process. These two categories were the main types easily converted from non-urban to urban because agricultural land and bare land were located on the flat area.
6). Compared the growth situation of past 3 years and the predicted year in 2024, the new growth area focused on the central area and southwest area of Dongguan city because of convenient traffic and flat terrain. Central area has high potential to expand urban boundary from central to outside based on the advantage of CBD and enough buildings in the entire city. DEM and slope always are the limited factors that are difficult to convert from non-urban to urban, and DEM and slope become the important factors that limit urban growth from forest area and high altitude area in Dongguan city. The forest area needs to keep original state for natural protection and provide enough forest to this city, then keep balance with the human being and urbanization. Two big forest areas with a high value of DEM and slope are difficult to convert from non-urban to urban in future.
Acknowledgements
The author would like to thank the highest appreciation to Prof. Yuji MURAYAMA who supervised my study in the master period in the University of Tsukuba.
Cite this paper
Xinmin Zhang, (2016) Urban Growth Modeling Using Neural Network Simulation: A Case Study of Dongguan City, China. Journal of Geographic Information System,08,317-328. doi: 10.4236/jgis.2016.83027
References
- 1. United Nations (2012) World Urbanization Prospects: The 2011 Revision.
http://esa.un.org/unpd/wup/index.htm - 2. Masser, I. (2001) Managing Our Urban Future: The Role of Remote Sensing and Geographic Information Systems. Habitat International, 25, 503-512.
http://dx.doi.org/10.1016/S0197-3975(01)00021-2 - 3. Kamusoko, C. and Gamba, J. (2015) Simulating Urban Growth Using a Random Forest-Cellular Automata (RF-CA) Model. ISPRS International Journal of Geo-Information, 4, 447-470.
http://dx.doi.org/10.3390/ijgi4020447 - 4. Long, Y. (2014) Automated Identification and Characterization of Parcels (AICP) with Open Street Map and Points of Interest, Slides at Beijing City Lab.
http://www.beijingcitylab.com - 5. Haas, J. and Ban, Y. (2014) Urban Growth and Environmental Impacts in Jing-Jin-Ji, the Yangtze, River Delta and the Pearl River Delta. International Journal of Applied Earth Observation and Geoinformation, 30, 42-55.
http://dx.doi.org/10.1016/j.jag.2013.12.012 - 6. Li, X., Lao, C., Liu, Y., Liu, X., Chen, Y., Li, S. and He, Z. (2013) Early Warning of illegal Development for Protected Areas by Integrating Cellular Automata with Neural Networks. Journal of Environmental Management, 130, 106-116.
http://dx.doi.org/10.1016/j.jenvman.2013.08.055 - 7. Tobler, W.R. (1970) A Computer Movie Simulating Urban Growth in the Detroit Region. Economic Geography, 46, 234-240.
http://dx.doi.org/10.2307/143141 - 8. Couclelis, H. (1985) Cellular Worlds: A Framework for Modeling Micro-macro Dynamics. Environment and Planning A, 17, 585-596.
http://dx.doi.org/10.1068/a170585 - 9. Couclelis, H. (1988) Of Mice and Men: What Rodent Populations Can Teach Us about Complex Spatial Dynamics. Environment and Planning A, 20, 99-109.
http://dx.doi.org/10.1068/a200099 - 10. Batty, M. (1991) Cities as Fractals: Simulating Growth and Form. Fractals and Chaos, Springer, New York, 43-69.
- 11. Batty, M., Xie, Y. and Sun, Z. (1999) Modeling Urban Dynamics through GIS-based Cellular Automata. Computers, Environment and Urban Systems, 23, 205-233.
http://dx.doi.org/10.1016/S0198-9715(99)00015-0 - 12. White, R. and Engelen, G. (1993) Cellular Automata and Fractal Urban Form: A Cellular Modelling Approach to the Evolution of Urban Land-Use Patterns. Environment and Planning A, 25, 1175-1199.
http://dx.doi.org/10.1068/a251175 - 13. White, R., Engelen, G. and Uljee, I. (1997) The Use of Constrained Cellular Automata for High-resolution Modelling of Urban Land-Use Dynamics. Environment and Planning B, 24, 323-344.
http://dx.doi.org/10.1068/b240323 - 14. Clarke, K.C. and Gaydos, L.J. (1998) Loose-Coupling a Cellular Automaton Model and GIS: Long-Term Urban Growth Prediction for San Francisco and Washington/Baltimore. International Journal of Geographical Information Science, 12, 699-714.
http://dx.doi.org/10.1080/136588198241617 - 15. Wu, F. and Webster, C.J. (1998) Simulation of Natural Land-Use Zoning Under Free-Market and Incremental Development Control Regimes. Computers, Environment and Urban Systems, 22, 241-256.
http://dx.doi.org/10.1016/S0198-9715(98)00044-1 - 16. Wu, F. (2002) Calibration of Stochastic Cellular Automata: The Application to Rural-Urban Land Conversions. International Journal of Geographical Information Science, 16, 795-818.
http://dx.doi.org/10.1080/13658810210157769 - 17. Li, X., Liu, X. and Li, S. (2010) Intelligent GIS and Spatial Optimization. Science Press, Beijing, 1-275.
- 18. Li, X., Yeh, A.G.O., Liu, X. and Yang, Q. (2010) Geographical Simulation Systems: Cellular Automata and Multi- Agent Systems. Science Press, Beijing, 1-312.
- 19. Li, X., Chen, Y., Liu, X., Li, D. and He, J. (2011) Concepts, Methodologies, and Tools of an Integrated Geographical Simulation and Optimization System. International Journal of Geographical Information Science, 25, 633-655.
http://dx.doi.org/10.1080/13658816.2010.496370 - 20. Guan, Q., Wang, L. and Clarke, K.C. (2005) An Artificial-Neural-Network-Based, Constrained CA Model for Simulating Urban Growth. Cartography and Geographic Information Science, 32, 369-380.
http://dx.doi.org/10.1559/152304005775194746 - 21. Yang, C. (2006) Overseas Chinese Investments in Transition: The Case of Dongguan. Eurasian Geography and Economics, 47, 604-621.
http://dx.doi.org/10.2747/1538-7216.47.5.604 - 22. Zhang, H. (2009) Labor Migration, Gender, and the Rise of Neo-Local Marriages in the Economic Boomtown of Dongguan, South China. Journal of Contemporary China, 18, 639-656. http://dx.doi.org/10.1080/10670560903033935
- 23. Li, X. and Yeh, A.G.O. (2001) Calibration of Cellular Automata by Using Neural Networks for the Simulation of Complex Urban Systems. Environment and Planning A, 33, 1445-1462.
http://dx.doi.org/10.1068/a33210 - 24. Hagen-Zanker, A. and Martens, P. (2008) Map Comparison Methods for Comprehensive Assessment of Geosimulation Models. In: Gervasi, O., Murgante, B., Laganà, A., Taniar, D., Mun, Y. and Gavrilova, M.L., Eds., Computational Science and Its Applications—ICCSA 2008, Springer, Berlin Heidelberg, 194-209.
http://dx.doi.org/10.1007/978-3-540-69839-5_15 - 25. Van Vliet, J., Bregt, A.K. and Hagen-Zanker, A. (2011) Revisiting Kappa to Account for Change in the Accuracy Assessment of Land-Use Change Models. Ecological Modelling, 222, 1367-1375.
http://dx.doi.org/10.1016/j.ecolmodel.2011.01.017 - 26. Rohland, R. (2008) Improving the Accuracy of Pixel Classification by Including Texture Information. Vol. 10, Papers in Resource Analysis, Saint Mary’s University of Minnesota University Central Services Press, Winona, 21 p.
- 27. Estoque, R.C. and Murayama, Y. (2012) Introducing New Measures of Accuracy for Land-Use/Cover Change Modeling. Tsukuba Geoenvironmental Sciences, 8, 3-7.
- 28. Pontius Jr., R.G. and Millones, M. (2011) Death to Kappa: Birth of Quantity Disagreement and Allocation Disagreement for Accuracy Assessment. International Journal of Remote Sensing, 32, 4407-4429.
http://dx.doi.org/10.1080/01431161.2011.552923