Journal of Geographic Information System
Vol.07 No.01(2015), Article ID:53553,18 pages
10.4236/jgis.2015.71001
A Comparison of Change Detection Analyses Using Different Band Algebras for Baraila Wetland with Nasa’s Multi-Temporal Landsat Dataset
Mohammad Ashraf1, Rabeya Nawaz2
1CSIR-NET (Earth Sciences), UGC-JRF (Geography), Department of Geography, Patna University, Patna, India
2M. Tech 2nd Year, Centre of Mining Environment, Indian School of Mines, Dhanbad, India
Email: ashrafpatna@gmail.com
Copyright © 2015 by authors and Scientific Research Publishing Inc.
This work is licensed under the Creative Commons Attribution International License (CC BY).
http://creativecommons.org/licenses/by/4.0/


Received 3 January 2015; accepted 25 January 2015; published 27 January 2015
ABSTRACT
Wetlands are those landscapes which are saturated with water or covered by water either perennially or for a major part of the year. Due to transforming nature of the wetlands from aquatic to terrestrial, the related physical features are not easy to be monitored. With the recent advancement in Remote sensing technique, the feature extraction of wetland with the help of different satellite derived band algebras including Normalized Difference Vegetation Index (NDVI), Normalized Difference Water Index (NDWI), Modified NDWI (MNDWI), Normalized Difference Moisture Index (NDMI) is being used by experts. The common diagnostic features of wetlands are surface water, swamps and aquatic vegetation. The present study is based on a comparison between these four indices. Baraila wetland of Vaishali district Bihar is selected as a site for the study because the surface water of this “BAT” shaped wetland has decreased rapidly in last half decade which is alarming for the related ecology and biodiversity.
Keywords:
Wetlands, Remote Sensing, NDVI, NDWI, MNDWI, NDMI

1. Introduction
One of the major area of remote sensing is to monitor different natural resources like land use/land cover, forest, vegetation, hydrology, river dynamics, wetlands, etc. Wetlands are one of the most important features of our natural environment. They retain water during dry season thus keeping the water table high and in rainy season with surplus water they help to reduce flood level. They are important for wildlife and waterfowls as they provide drinking, feeding and breeding ground for them. Wetlands create one of the most productive ecosystems around them which are the function of its both aquatic and terrestrial character. Hence, correct monitoring and accurate identification of wetland features are essential to prevent their loss and for their proper conservation.
Remote sensing satellites with different spectral, spatial, and temporal resolutions provide huge amount of data which are used as primary sources and are regularly used for wetland feature extraction. However, remotely sensed imagery has been used for long time for water resources assessment and coastal management [1] . These applications have involved the delineation of open water using thematic information from remote sensing imagery, which according to the number of bands used, are generally classified into two categories which are single and multi band methods.
The single band method normally includes choosing a band from a multispectral image to extract open water information [2] . A threshold is then determined for the band to discriminate water from land [1] . The subjective selection of the threshold value may lead to false estimation of open water area and the extracted water information is often mixed with errors. The reported errors in this method are because of mixing of water pixels with other cover types.
The multi-band method is more accurate because of the reflective differences of each band that is included. Normally, two approaches are used for multiband technique. First is analyzing signature attributes of each ground target among different spectral bands, finding out the signature differences between water and other targets based on the analysis, and then using an if-then-else logic tree to delineate land from open water [3] . And the other one which is used in this research article is called band-ratio approach using two or more multispectral bands. This method uses different reflective bands for improved surface water extraction [4] . For example, the Normalized Difference Water Index (NDWI) was developed for the extraction of water features from Landsat imagery [5] . Since water features extracted using the NDWI include false positives from built-up land, a modified NDWI (MNDWI) was developed in which the middle infrared (MIR) band was replaced with the near infrared (NIR) band [1] .
2. Overview of Study Area and Objectives
2.1. Study Area
Baraila Taal is an open wetland located between Latitude: 25˚44'57'' - 25˚46'57'' North and Longitude: 85˚31'22'' - 85˚35'2'' East, in Hazrat Jandaha Tehsil of Vaishali district Bihar (Figure 1). The wetland expands 12.5 km long

Figure 1. Locational aspect of the study area.
(east to west) and 8 km wide (north to south). The area of the wetland is nearly 15 km2. It is about 50 km from Patna and 30 km from Hajipur. This wetland is surrounded by four rivers e.g. Gandak, Nuna, Burhi Gandak and Ganga.
Baraila wetland is the budding ground for the host of floral and faunal species which form important trophic components of ecological pyramid. This wetland is a vast reservoir of large number of fishes. The ichthyofauna includes Catla catla, Labeo bata, Labeo calbasu, Labeo rohita, Notopterus notopterus, Puntius ticto, Puntius sophore, Puntius chrysopterus, Oxygaster Bacaila, Wallago attu, Mystus tengra, etc. The population of the adjoining areas is mostly fishermen and they are solely dependent on fishing for their livelihood. Aquatic vegetation consists of mostly reeds, grasses, azolla, and water hyacinth. The sub emergent, emergent and floating vegetation of Baraila attracts thousands of migratory waterfowls every year. It is one of the largest wintering grounds of the migratory birds in India. Different types of angles, vulture cocks, lapwings, pigeons, doves, keets, cuckoos and swifts have also been seen in and around the wetland area.
2.2. Objectives
The main objective of this study is wetland feature extraction by using different satellite derived band algebras including Normalized Difference Vegetation Index (NDVI), Normalized Difference Water Index (NDWI), Modified NDWI (MNDWI), and Normalized Difference Moisture Index (NDMI).
The other objective is to analyze the physical features and extent of the Baraila wetland during 1989-2014.
Comparison of these four radiometric indices with ground referenced data to get the most efficient index for the wetland mapping of north Bihar flood plain.
3. Dataset and Method
Survey of India Toposheet No. 72G, 72F and the latest in series G45N9 along with Landsat-2 tile (path 151, row 42, date 20/11/1975 from GLCF) are used to create the georeferenced base map of Baraila wetland. For georeferencing and shapefile creation and conversion GRgarmin along with ISRO’s Bhuvan were used and required ground truthing was done. An extensive field survey was done with the help of GPS in March 2014 to identify the random sample points (33 in numbers) for the comparison with the results obtained by different Radiometric Indices. Following base years and related Landsat satellite data were used for the analyses in the present study (Table 1).
The following band equations were used for acquiring the satellite derived indexes used for wetland feature extraction (Table 2).

Table 1. Details of satellite data.
Table 2. Details of satellite derived indices.
Four bands (GREEN, RED, NIR, MIR) of each selected year were incorporated for the band algebra except 1975 because of the unavailability of MIR channel in Landsat MSS. All the images obtained are of post monsoon season and most importantly they are much before the arrival of summer season so that the maximum surface water could be extracted by the application of different band indices. These radiometric indices were then classified into three categories e.g. open water, swamp and aquatic weeds with the help of ground referenced data and image specific thresholds for the visual interpretation.
Erdas Imagine was used for acquiring all the radiometric indices. The following method for NDWI is used for processing in Erdas Imagine and similarly other indices (MNDWI, NDMI, NDVI) were calculated according to their respective band formula (Flowchart 1)
After processing of all four indices in Erdas imagine, each index (in form of Landsat tile) was brought in ArcMap for clipping according to georeferenced base map of Baraila wetland and then the clipped images were classified using ISOCLUSTER unsupervised classification using three threshold classes according to ground referenced data. Numbers of Unsupervised classification pixels were acquired and then the area for each class was calculated using each radiometric index for 1989, 2001, 2005, 2009, and 2014 (Tables 3-10). The following software was used in present study (Table 11).
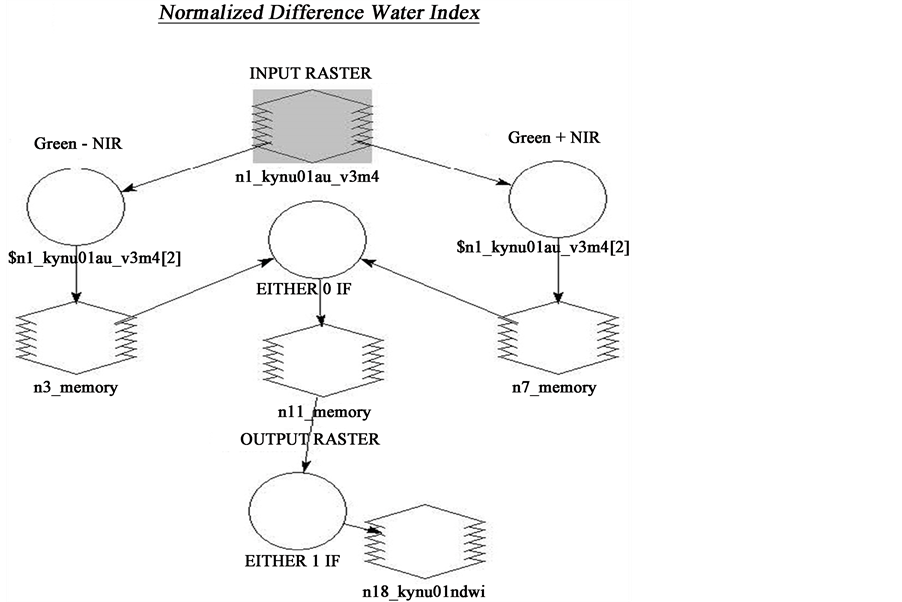
Flowchart 1. Adopted method for band algebra in Erdas imagine.
Table 3. Number of unsupervised classification pixels for each feature class used in MNDWI classification.
Table 4. Number of unsupervised classification pixels for each feature class used in NDMI classification.
Table 5. Number of unsupervised classification pixels for each feature class used in NDVI classification.
Table 6. Number of unsupervised classification pixels for each feature class used in NDWI classification.
Table 7. Statistical analysis of Baraila Wetland physical features change detection during 1989-2014 using MNDWI radiometric index.
Table 8. Statistical analysis of Baraila Wetland physical features change detection during 1989-2014 using NDMI radiometric index.
Table 9. Statistical analysis of Baraila Wetland physical features change detection during 1989-2014 using NDVI radiometric index.
Table 10. Statistical analysis of Baraila Wetland physical features change detection during 1989-2014 using NDWI radiometric index.
Table 11. Details of software used in study.
Change detection of Baraila Wetland for the base years 1989, 2001, 2005, 2009, and 2014 using MNDWI Radiometric index is shown below (Figures 2(a)-(e)).
Change detection of Baraila Wetland for the base years 1989, 2001, 2005, 2009, and 2014 using NDMI Radiometric index is shown below (Figures 3(a)-(e)).
Change detection of Baraila Wetland for the base years 1989, 2001, 2005, 2009, and 2014 using NDVI Radiometric index is shown below (Figures 4(a)-(e)).
Change detection of Baraila Wetland for the base years 1989, 2001, 2005, 2009, and 2014 using NDWI Radiometric index is shown below (Figures 5(a)-(e)).
4. Results and Discussions
The most important objective of this study was to compare all four radiometric indices with the help of ground referred data. An extensive field survey was done with the help of GPS in March 2014 to identify the random sample points for the comparison with the results obtained by different Radiometric Indices. Because of the unavailability of ground referred data from (1989-2009) the study was solely dependent on the satellite data and indices derived from it for previous years. The comparative results of all these indices show great variations in results related to extracted features. With the help of ground referred data for the year 2014 it was found that NDWI is the most efficient and accurate index for this north Bihar flood plain wetland’s feature extraction. To validate the accuracy of NDWI for the present year the total number of random survey points were 33, out of which NDWI was accurate on 26 locations for all three classified feature classes. Comparing other three indices only NDMI could manage to extract good ground results as well as the satellite derived result for surface water feature.
Beside the present year (2014) in which the comparison between these popular indices and ground referred
 (a)
(a) (b)
(b) (c)
(c) (d)
(d) (e)
(e)
Figure 2. (a) MNDWI-1989; (b) MNDWI-200; (c) MNDWI-2005; (d) MNDWI-2014; (e) MNDWI-2014.
 (a)
(a) (b)
(b) (c)
(c) (d)
(d) (e)
(e)
Figure 3. (a) NDMI-1989; (b) NDMI-2001; (c) NDMI-2005; (d) NDMI-2009; (e) NDMI-2014.
 (a)
(a) (b)
(b) (c)
(c) (d)
(d) (e)
(e)
Figure 4. (a) NDVI-1989; (b) NDVI-2001; (c) NDVI-2005; (d) NDVI-2009; (e) NDVI-2014.
 (a)
(a) (b)
(b) (c)
(c) (d)
(d) (e)
(e)
Figure 5. (a) NDWI-1989; (b) NDWI-2001; (c) NDWI-2005; (d) NDWI-2009; (e) NDWI-2014.
data were done and the accuracy was checked, it was assumed that NDWI index is best suited for the present site. However, all the Radiometric results show a definite decline in surface water of the wetland in this period, most noticeably in last five years the brisk rate of reduction in surface water has resulted in lowering it to nearly half of its size. The statistical result on the basis of most accurate index which is NDWI reveals that total wetland area in 1989 was 15.116 km2 out of which most abundant wetland feature was surface water which was nearly 55% of the whole wetland area. This wetland feature is reduced heavily in last five year and now it covers only 24.53% of the total wetland. The area with Swamp has more than doubled from 21.40% to nearly 45% in last quarter decade while area with aquatic weeds has also increased from 3.584 km2 in 1989 to 4.605 km2 in 2014 (Graphs 1-5).

Graph 1. Baraila wetland features change detection during 1989-2014 using MNDWI.

Graph 2. Baraila wetland features change detection during 1989-2014 using NDM.

Graph 3. Baraila wetland features change detection during 1989-2014 using NDVI.

Graph 4. Baraila wetland features change detection during 1989-2014 using NDWI.

Graph 5. Temporal pattern of change in different radiometric indices during 1989-2014.
5. Conclusions
All these radiometric indices have their own signature features and values for identifying the targets among different spectral bands (Graph 5). The MNDWI can enhance surface water features by using MIR in place of NIR resulting in overestimating the actual open water area. A wetland area is a combination of open water, swamp and aquatic vegetation. This index underestimates other wetland features except surface water. The NDMI is primarily used for soil moisture investigation. In NDMI, the high value indicates the existence of more soil moisture under water bodies and low value indicates low soil moisture contents. However in this study, the accuracy of this index was poor and it only performed well in extracting the surface water in 2014.
The results for extracted wetland features were very close for NDWI and NDVI from 1989 to 2009 (Graph 3 and Graph 4). However, NDWI performed better than other indices in all related base years and it had also the best accuracy with the ground referred data obtained from field survey for 2014. The majority of the results showed an intense decreasing trend in the wetland surface water area in last five years. If such a decreasing trend in Baraila wetland continues, the lake will lose its entire surface water in near future or in others words the surface water will be permanently converted into swamp or area with aquatic weeds. This is very critical because the wetlands surface water (lake area) provides many benefits to the neighboring population which is more or less dependent on it for their livelihood. Therefore, appropriate measures need to be taken by the local administration and government to prevent further decline of the wetland surface water area and to restore it to its original condition.
References
- Xu, H. (2006) Modification of Normalized Difference Water Index (NDWI) to Enhance Open Water Features in Remotely Sensed Imagery. International Journal of Remote Sensing, 27, 3025-3033. http://dx.doi.org/10.1080/01431160600589179
- Rundquist, D., Lawson, M., Queen, L. and Cerveny, R. (1987) The Relationship between the Timing of Summer-Season Rainfall Events and Lake-Surface Area. Water Resources Bulletin, 23, 493-508. http://dx.doi.org/10.1111/j.1752-1688.1987.tb00828.x
- Yu, J., Huang, Y. and Feng, X. (2001) Study on Water Bodies Extraction and Classification from SPOT Image. Journal of Remote Sensing, 5, 214-219.
- Du, Z., Linghu, B., Ling, F., Li, W., Tian, W., Wang, H., Gui, Y., Sun, B. and Zhang, X. (2012) Estimating Surface Water Area Changes Using Time-Series Landsat Data in the Qingjiang River Basin, China. Journal of Applied Remote Sensing, 6, Article ID: 063609. http://dx.doi.org/10.1117/1.JRS.6.063609
- McFeeters, S.K. (1996) The Use of the Normalized Difference Water Index (NDWI) in the Delineation of Open Water Features. International Journal of Remote Sensing, 17, 1425-1432. http://dx.doi.org/10.1080/01431169608948714
- Gao, B.C. (1996) NDWI―Normalized Difference Water Index for Remote Sensing of Vegetation Liquid Water from Space. Remote Sensing of Environment, 58, 257-266. http://dx.doi.org/10.1080/01431169608948714
- Wilson, E.H. and Sader, S.A. (2002) Detection of Forest Harvest Type Using Multiple Dates of Landsat TM Imagery. Remote Sensing of Environment, 80, 385-396. http://dx.doi.org/10.1016/S0034-4257(01)00318-2
- Rouse, J.W., Haas, R.H., Schell, J.A. and Deering, D.W. (1973) Monitoring Vegetation Systems in the Great Plains with ERTS (Earth Resources Technology Satellite). Proceedings of 3rd Earth Resources Technology Satellite Symposium, Greenbelt, 10-14 December, SP-351, 309-317.