Journal of Geographic Information System
Vol.5 No.6(2013), Article ID:40629,10 pages DOI:10.4236/jgis.2013.56049
The Necessity of Using Cloud Computing in Monitoring Metropolitan Performance—Case Study: Tehran Metropolitan Urban Observatory
Department of Environment and Energy, Faculty of Science and Research Branch of Islamic Azad University, Tehran, Iran
Email: *alimadadmsbk@yahoo.com
Copyright © 2013 Ali Madad et al. This is an open access article distributed under the Creative Commons Attribution License, which permits unrestricted use, distribution, and reproduction in any medium, provided the original work is properly cited.
Received October 24, 2013; revised November 24, 2013; accepted November 30, 2013
Keywords: Metropolitan Management; Urban Observatory; SDSS; OGC; Web GIS; Cloud Computing
ABSTRACT
Due to the metropolitan area of immense diversity and breadth of their construction activities, the performance of activities at districts level, cannot be precisely evaluated. Therefore, generally, it monitors only the indices which are defined for those functions. Furthermore, district-based development policy, and decentralization of governance, necessitate more local autonomy, which requires closer monitors of districts for being sure of its movements in the frame of urban developing plans. The advancement of technology has created the expectation that we can monitor all details of the metropolitan administrative processes and involve them in decision support systems for urban management. In this study, a web based SDSS prototype has been implemented to monitor the Tehran development plans progress at districts level. This interactive system presents a map of Tehran which indicates the realization of each component of the city master plan in different parts of town. The design of system lets all districts produce and support their own reporting maps, and it presents them in their dedicated place of city map by snapping all districts reports, when a city report arises. Also it elaborates the problem of implementing and proposes “cloud computing facilities” as a solution.
1. Introduction
Worldwide, metropolitan regions (also referred to as “urban regions” or “city regions”) are rapidly becoming the predominant form of human settlement. In 1800 only 2% of the world’s population lived in urban areas. The United Nations predicts that from 2005 to 2030, 90% of all global population growth will take place in urban regions of the global South [1]. Yet it has been recognized that urban growth is associated with many socioeconomic and environmental problems [2]. Cities have become synonymous with growth, and they are increasingly subject to dramatic crisis, especially in developing countries [3]. High rapid development and growth of a metropolis, force the managers to apply the best of science and technologies in their management processes.
Otherwise, soon severe infrastructure needs will cause ignorance of environmental and social issues [4]. Tehran Metropolitan with 800 km2 area and 11 million population has its first comprehensive plan at 1970, when it had just 180 km2 extent and 2.7 million habitants. From then till now it had about four different urban plans. None of them includes any performance evaluation method, due to lack of monitoring plans progress and their enhancements. Besides this oblivion, the second barrier on monitoring urban plans and enhancing them in Tehran is poor use of technology in designing required software. Although Tehran had nice mutation in intelligent urban management during passed decay, the governance of its urban development plans in city was so little, and it grows basically upon personal decisions. This causes so much pressure on city managers and creates irreparable defects for the city.
Tehran Urban Planning and Research Center has mentioned these on several studies for revival of the city development plans, and utilizing them. This study is one of them which presents a method to evaluate the governance of plans in city activities and find out its weakness and strength. Instead of defining indicators and monitoring them, which result in coarse conclusions, this study works upon our own states of each activity in city. The relations and weights between each project in city and its upstream plans are nominated. This linkages and weightings continue with city objective goals and missions. By initializing the progress of projects, the amount of their related upstream plans progress will be calculated. Since this huge amount of data and process will be so massive and may require giant hardware to support it, this study implements a web-based SDSS, in which each districts of regions will response to its own issues by snapping them from each other. The region reports and then the city reports are prepared.
According to the survey of monitoring urban development projects in the areas of the city (districts) which is supposed to service interactive system SDSS in the metropolis through the districts areas of servers in the Web platform, experience has shown that supplying specialist to administer and maintain servers in areas is very costly and unlikely. It is suggested to use cloud computing facility for local servers to carry out steering issues and maintenance systems in municipality data center.
2. High Resolution Monitoring
The rapid expansion of urban areas due to rise in population and economic growth is increasing additional demand on natural resources thereby causing land-use changes especially in megacities [4]. Therefore, serious problems associated with rapid development such as additional infrastructure, informal settlements, environmental pollution, destruction of ecological structure and scarcity of natural resources has been studied carefully using remote sensing and GIS technologies for a rapidly grown megacity [5]. Dispersed urbanization, urban planning and management instruments such as zoning, and urban expansion zones, have become increasingly consistent in leading cities toward an uncertain and chaotic future [6]. By more attention to the decentralization policy in city management the importance of careful supervision to the details activity of the city and lead them toward the desired purpose in city development is increased. The purpose of this attention is to prevent the profit-seeking decision of local rulers that cause fragmentation from the Sustainable development of the regions.
2.1. Classification
Administrative divisions play different roles in various social and economic environments, and are one of the important tasks in urban-regional governance [7]. Tehran Metropolitan has divided in 22 regions and each region has divided into several districts. The city contains about 130 districts which each one has its own municipality. The concept of metropolitan area government itself has substantially changed in the past 20 years. Most of the models envisaged or experimented with in the 1980s are now seen from the perspective of governance, rather than government [1]. The roles and responsibilities of local government are no longer simply to manage daily operational functions of a city and provide basic infrastructure. Local governments are now required to undertake economic planning, manage urban growth; be involved in major infrastructure planning; and even engage in achieving sustainable development objectives [4]. Increasingly cities and regions conceive of their economies as regional innovations systems. Within these new approaches there is a preference for identifying and exploiting opportunities for growth, rather than ameliorating the consequences of decline. A further feature of the new paradigm is the prominence of negotiated multilevel governance with a stronger role for local and regional actors [10]. Municipal decentralization and participatory democracy would imply open doors government, with effective transference of power to the grassroots. In the future, the municipal cabinet would meet publicly, facing the neighborhoods and open to social demands and proposals. It would mean, as well, an absolute transparency in the use of public funds and managerial practices [8]. On the other hand this open policy needs high res monitoring of activities, due to prevent personal decisions which may cause fragmentation from sustainable development.
Well-designed performance indicator systems can help the quality of decision making by reducing information asymmetries, and can promote the accountability of public services to national, sub-national, and citizens’ priorities [9]. The use of indicators to achieve major results can be appropriate but in this case that requires careful monitoring of Executive operations in the city, we cannot be satisfied with the monitoring of indicators, it is necessary for the activities to be monitored in details.
2.2. Development Planning
To make the best of everyone’s desire to make a difference, group members need to create a shared vision, develop a mission statement, and commit to identified goals, objectives and plan of action. That means a cycle of implementing a plan, evaluating and reviewing it [10].
The lack of proper communication platform between design and execution in metropolis causes the gap between goals and Executive activities. Figure 1 displays the bject within a chart.
Unable to monitor construction in the metropolis makes feedback to plan impossible and ultimately it causes the lack of monitoring. No matter how much this platform is fluent and smooth, in the same amount the feedback details and diversity and review can be increased. On the other hand whatsoever this platform be incapable and inappropriate, the supervision capability to activities
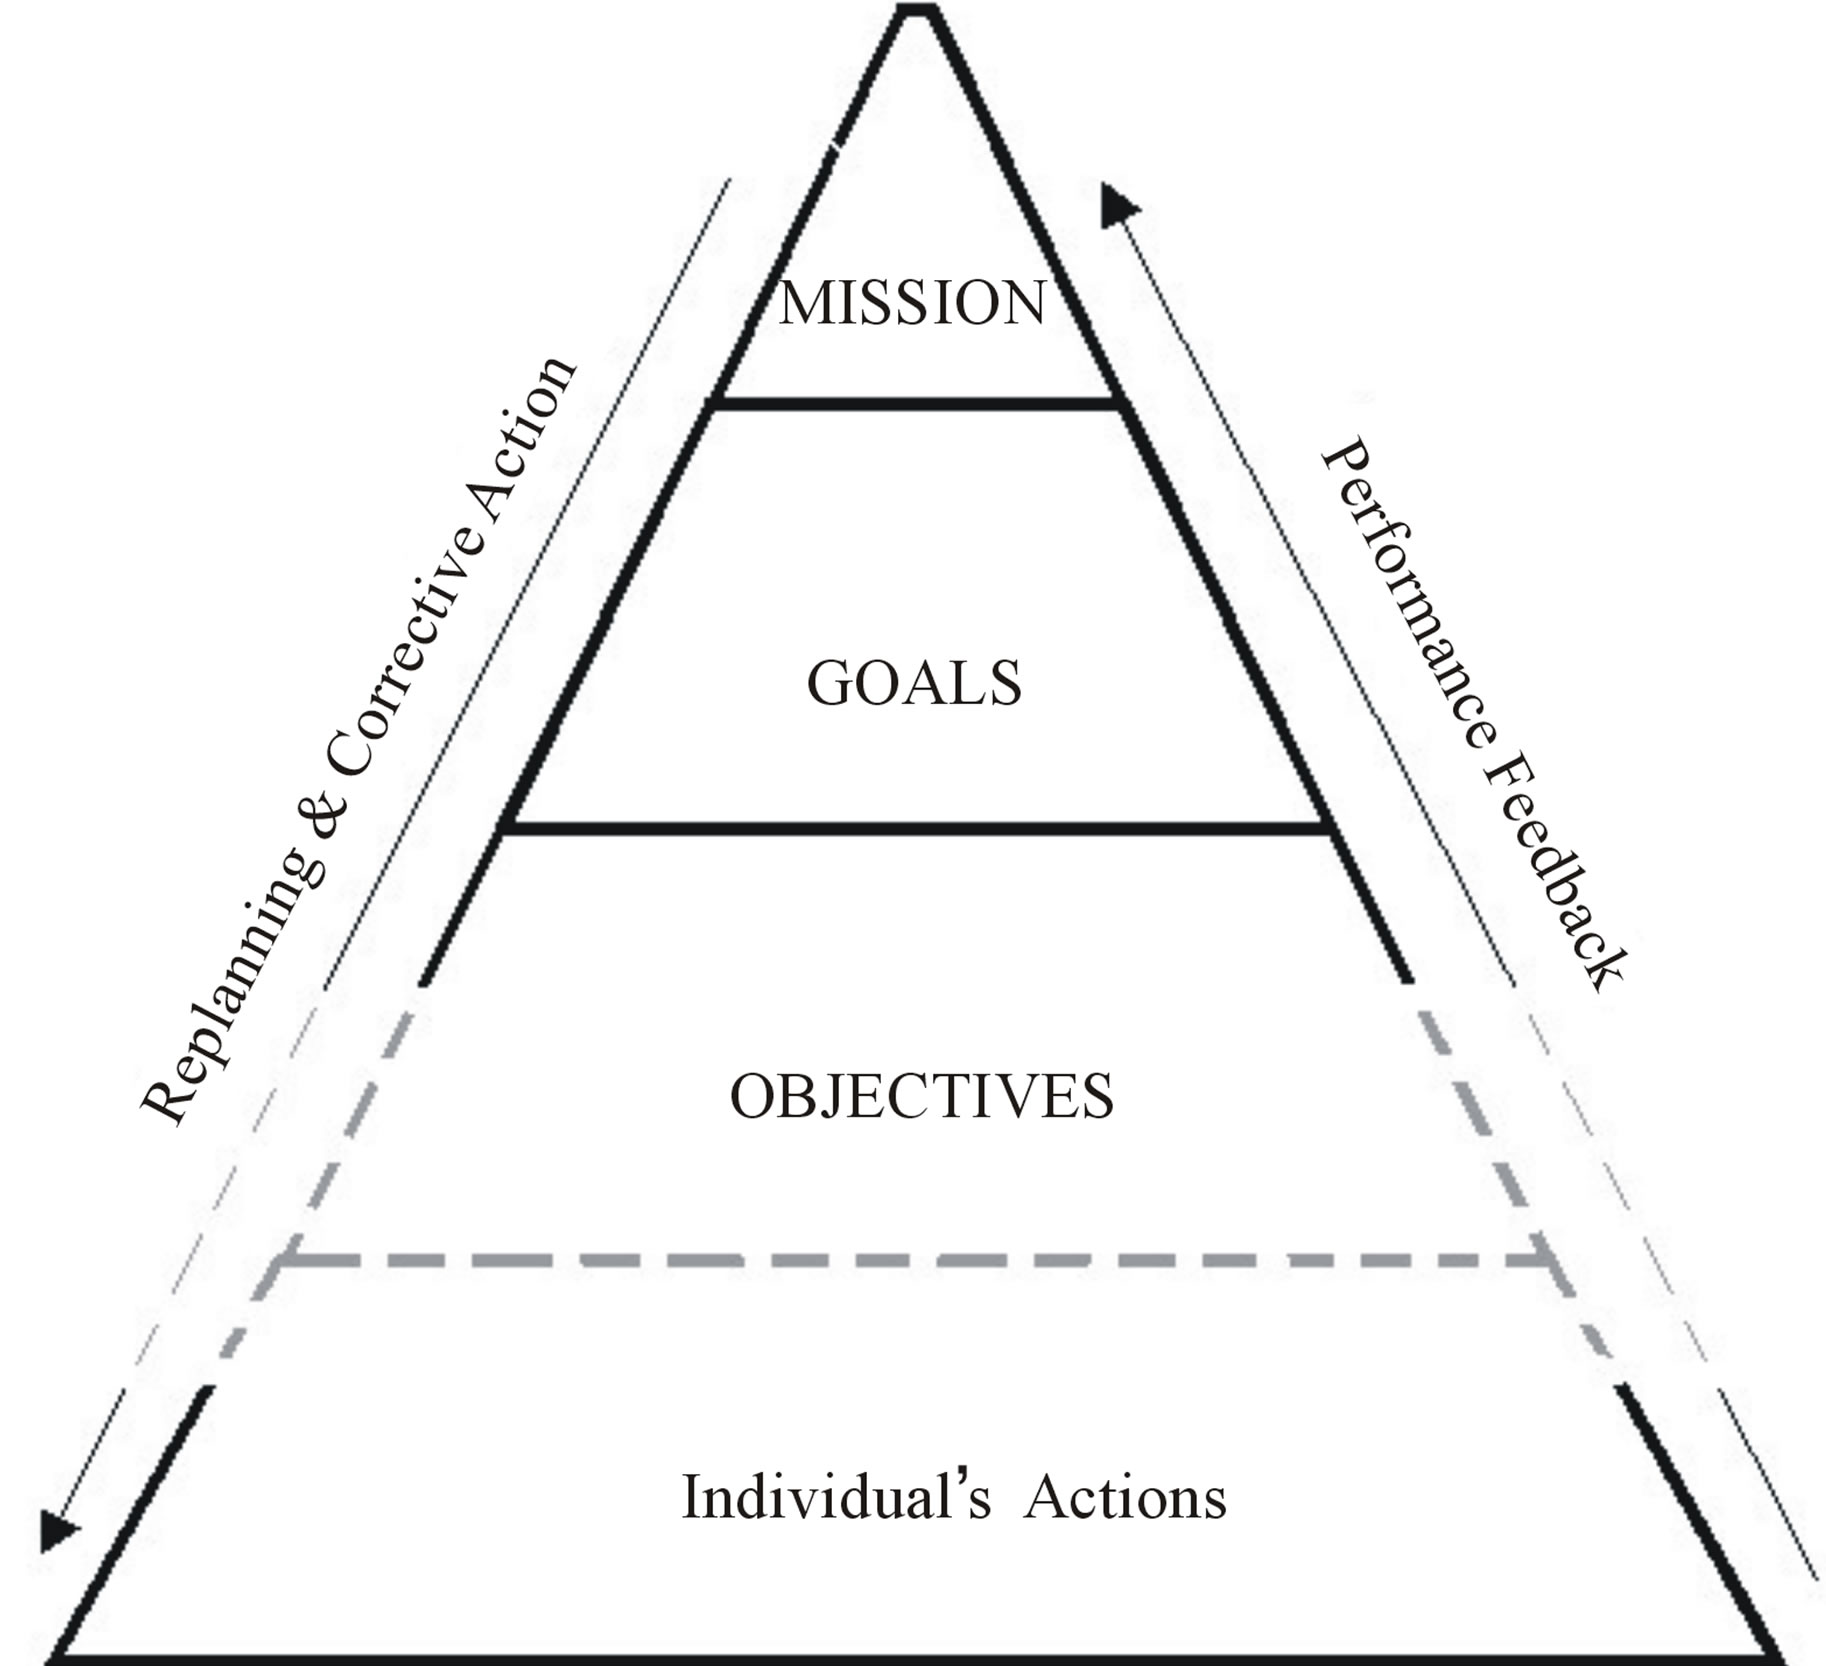
Figure 1. Gap between top and bottom.
and leading them to desired goals of urban development will be limited. To establish this platform at first it is necessary to determine that how much each of goals is in harmony with each perspective. For this reason communication between objectives and desired goals is established.
As shown in the Figure 2, this action will continue throughout the Executive projects around the city. With applying the amount of progress in the process of projects, the amount of goals and missions can be calculated. With applying the location of projects we can show the realization of plan throughout the city.
3. Web SDSS
In the late 1960s and early 1970s, few firms and scholars began to develop Decision Support Systems (DSS), which became characterized as interactive computerbased systems that help decision makers utilize data and models to solve ill-defined or ill-structured problem [11].
The Web-based DSS definition can be extended such that a web-based SDSS includes web-GIS as a problem solver using geographic data query, display, and analysis processes. Although complex programs are still difficult to integrate, various techniques are available to create web-based SDSS applications [12].
At below a brief of SOA and OGC services will be describe as basic components of Web SDSS, and Geoserver will be present as a Web GIS Server.
3.1. SOA (Service Oriented Architecture)
Web Services are the software components that can be accessed through the Internet in other applications. GIS Web services are the software components that can provide the hosted spatial data and GIS functionalities and
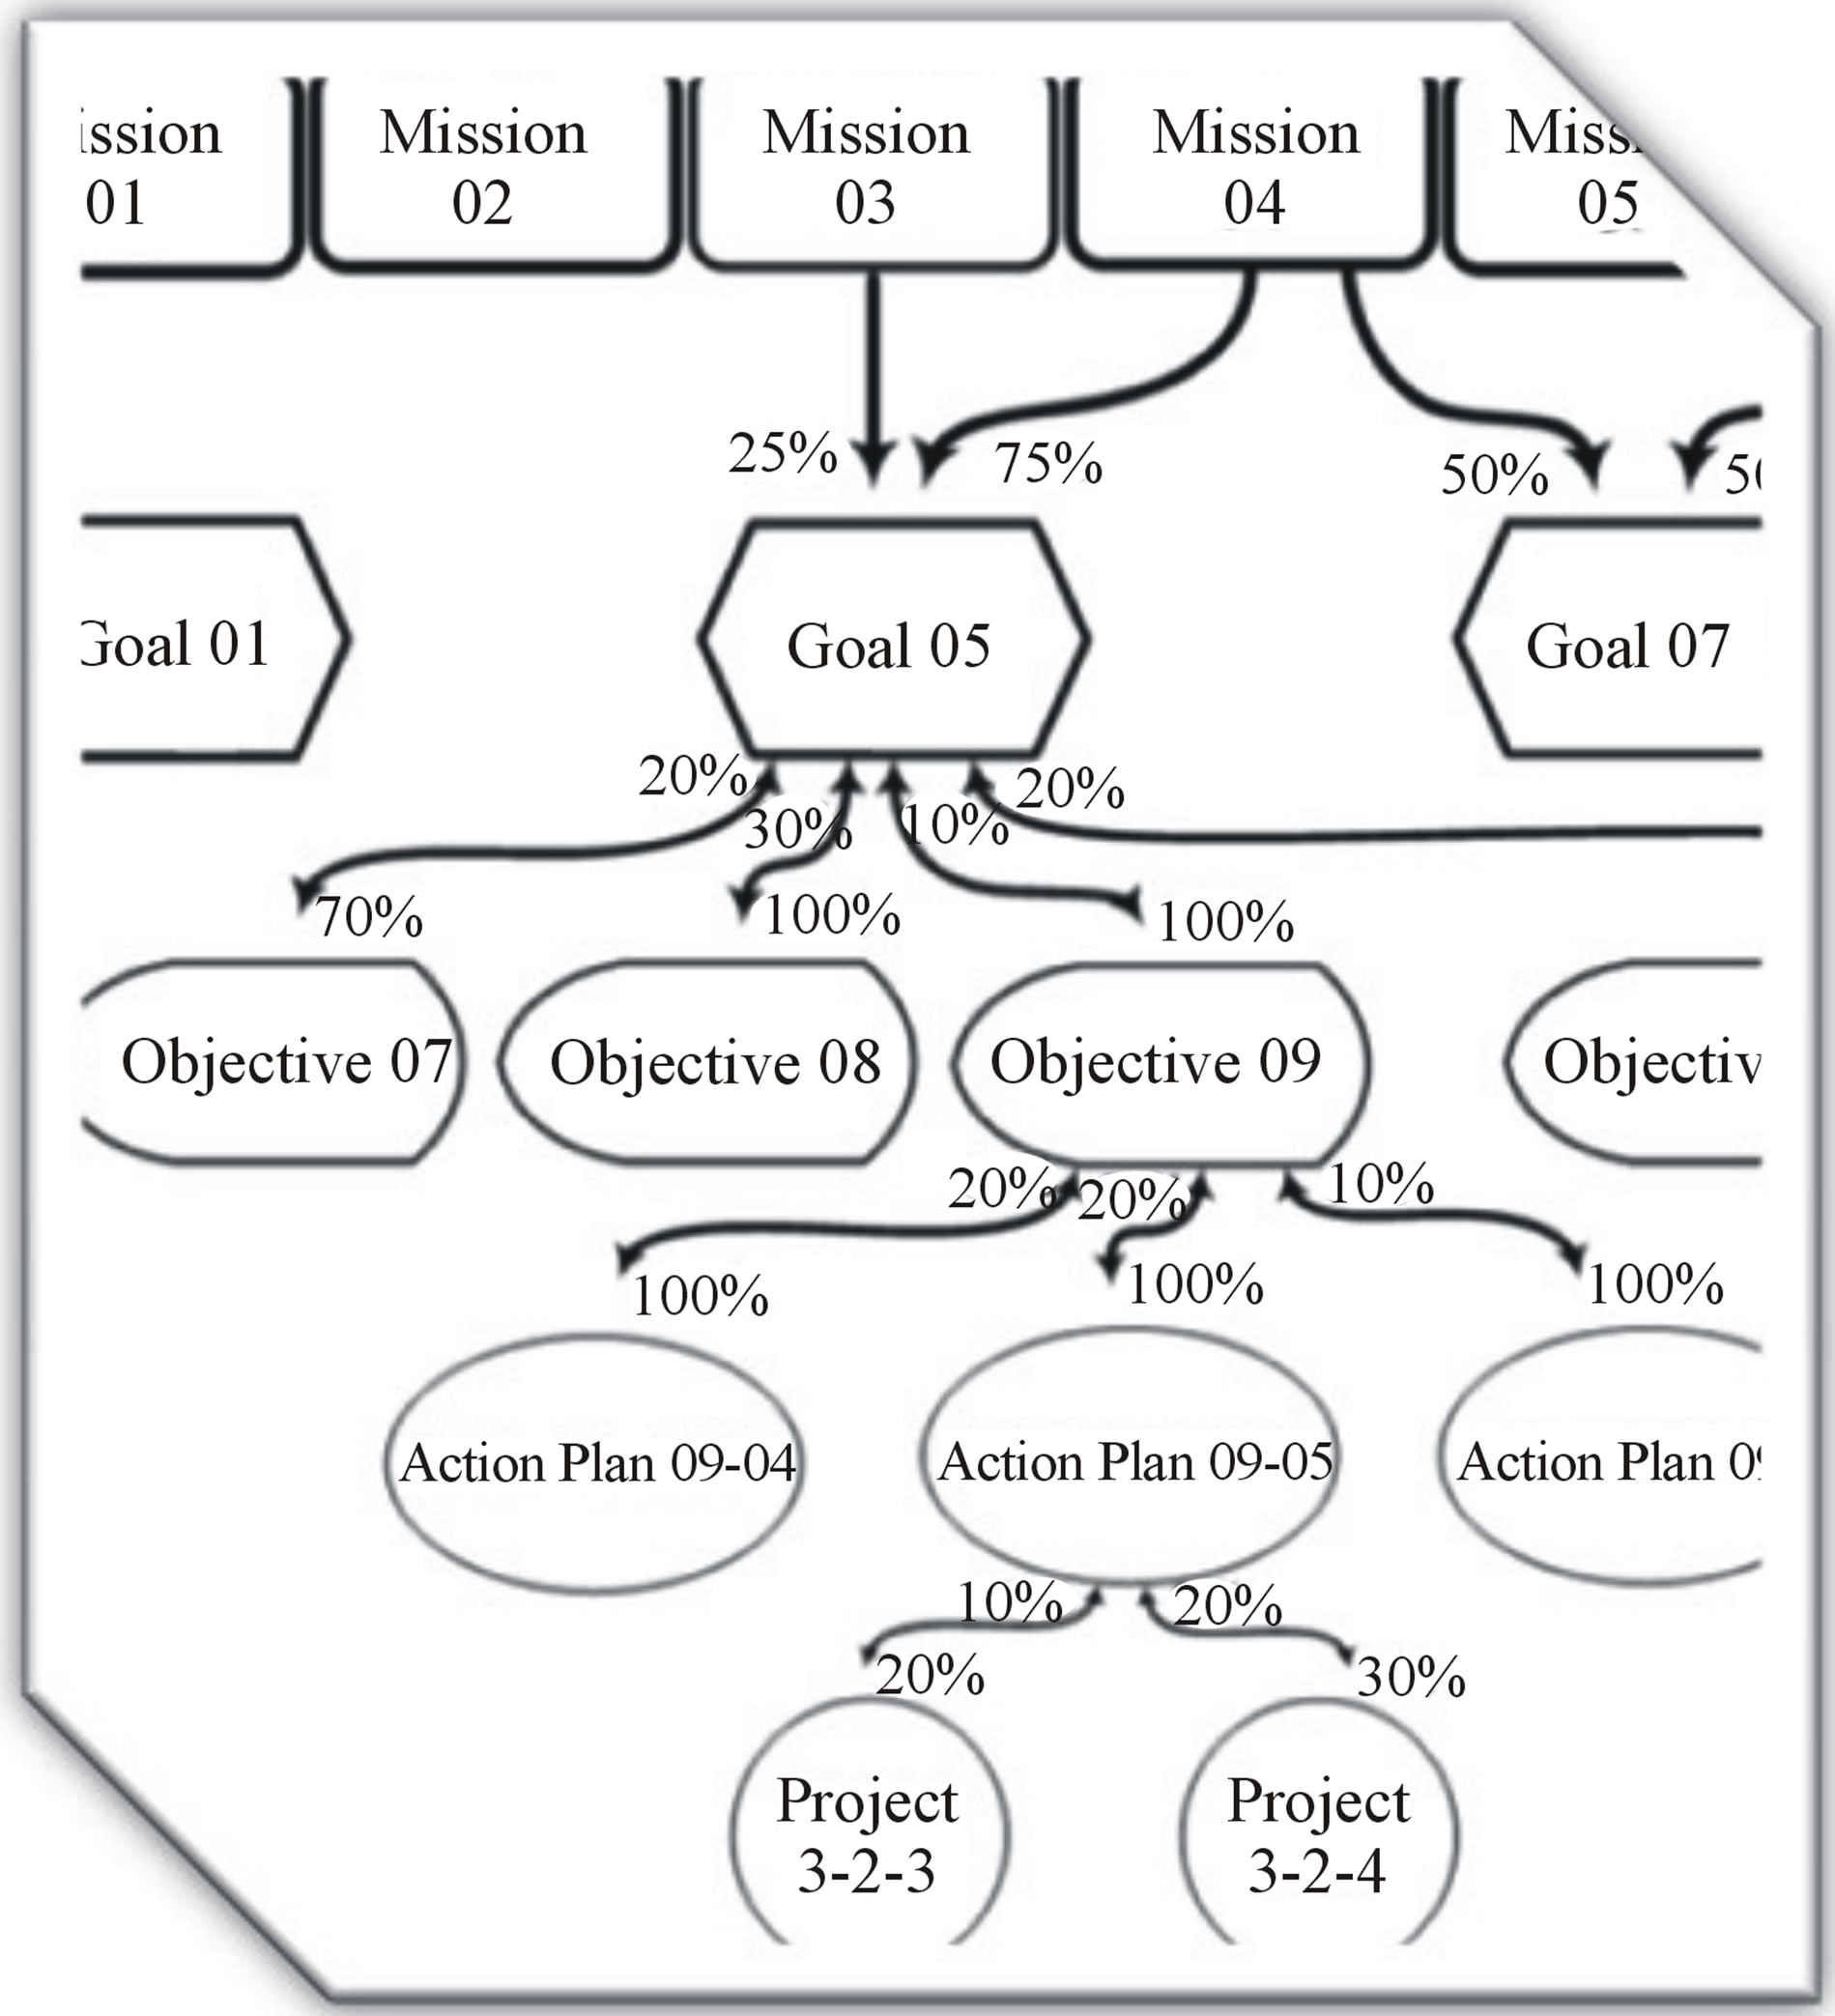
Figure 2. Links between plan components.
can be accessed and integrated to the practical customized GIS applications. Developers can apply the GIS Web services to perform geographical information processing and return the results to the customized applications without maintaining the basic GIS system or the geographical data. The service-oriented architecture is a very promising architecture for practical implementation of the next generation geographical information systems. The goal of the Service Oriented Distributed GIS platform is to provide both the dynamic GIS service components for publication vector and raster maps to Internet and interactive viewing on web browsers [13].
3.2. OGC Services
The Open Geospatial Consortium (OGC), an international voluntary consensus standards organization, originated in 1994. In the OGC, more than 400 commercial, governmental, nonprofit and research organizations worldwide collaborate in a consensus process encouraging development and implementation of open standards for geospatial content and services, GIS data processing and data sharing [14]. OGC services are geo web based services which works in a service oriented architecture framework.
OGC standards are technical documents that detail interfaces or encodings. Software developers use these documents to build open interfaces and encodings into their products and services. These standards are the main “products” of the Open Geospatial Consortium and have been developed by the membership to address specific interoperability challenges. Ideally, when OGC standards are implemented in products or online services by two different software engineers working independently, the resulting components plug and play, that is, and they work together without further debugging [15].
In this study the WMS (Web Map Service) service has been used to implement a Web GIS. WMS is a widely supported format for maps and GIS data accessed via the Internet and loaded into client side GIS software. This service illustrates vector based maps as raster images which include feature identification ability. The WMTS (Web Map Tile Service) service is same as WMS but it is so useful for presenting massive spatial data. It uses Rater pyramid and Raster tiling method to enhance the speed of presenting huge amount of spatial data.
3.3. Geoserver
In performing the GIS analysis tasks, Web GIS is similar to the client/server typical three-tier architecture. The geo processing is breaking down into server-side and clientside tasks. A client typically is a Web browser. The server-side consists of a Web Server, Web GIS software and Database [16]. Some of Web GIS servers are OGC complaints and supports OGC services. Applying standard web services in protocols will cause convenient server interoperability. Each server can use other server services for responding to its clients requests. Vast relationships between several OGC GIS servers will form SDI (Spatial Data Infrastructure).
Geoserver is an open source Web GIS server written in Java that allows users to share and edit geospatial data. Designed for interoperability, it publishes data from any major spatial data source using open standards. Being a community-driven project, Geoserver is developed, tested, and supported by a diverse group of individuals and organizations from around the world. Geoserver is the reference implementation of the Open Geospatial Consortium (OGC) Web Feature Service (WFS) and Web Coverage Service (WCS) standards, as well as a high performance certified compliant Web Map Service (WMS). Geoserver forms a core component of the Geospatial Web [17]. Geoserver internally uses OpenLayers as its web server. OpenLayers is a free Java script base web server.
3.4. SDSS
SDSS (Spatial Decision Support System) are interactive, computer-based diagnostic tools designed to support a user or group of users in achieving consensus-based and collectively acceptable outcomes in decision making while solving a semi-structured spatial problem [18]. Traditionally, GIS are key to (spatial) data management, but lack problem domain modeling capability. This means additional processing or analytical capabilities are needed to extend functionality for decision making [11]. Internet-based SDSS can overcome difficulties in data collection, model operation, and results interpretation, especially for local communities. A computational model is a core component of web-based SDSS. A computational model performs calculations using numerical algorithms for a DSS-specified purpose [12].
3.5. SLD (Styled Layer Descriptor)
The SLD is an OGC standard. Geospatial data has no intrinsic visual component. In order to see data, it must be styled. Styling specifies color, thickness, and other visible attributes used to render data on a map. In Geoserver, styling is accomplished using a markup language called Styled Layer Descriptor, or SLD for short. SLD is an XML-based markup language and is very powerful, although somewhat complex.
The final output of the proposed SDSS is a thematic map, which shows the favorability values with a gradient color ramp. Every vector layer stored in the Geoserver has a style (defined using the SLD) associated with it. This style, cannot be directly modified by the client, thus cannot be adapted to meet specific user’s preferences. However, the SLD can be applied for advanced and dynamic map rendering. The WMS specification allows sending an additional parameter called SLD_BODY, which accepts a literal SLD definition (e.g., stored in a string variable), which is used for styling the WMS layer. However, the size of this definition may become an important limitation. For these reasons it is more convenient and safer to store the SLD file externally. the external SLD definition needs to be generated dynamically. A simple PHP script can be efficiently used for this purpose. The script will dynamically create an SLD definition using values passed via an URL. In this way, using a mash-up of the JavaScript, PHP, WMS, and SLD frameworks, a custom thematic map can be dynamically generated and smoothly rendered in the client’s browser [19].
4. Cloud Computing
Cloud computing refers to the recent advancement of distributed computing by providing “computing as a service” for end users in a “pay-as-you-go” mode; such a mechanism had been a long-held dream of distributed computing and has now become a reality [20]. With the emergence of new methodologies and technologies it has now become possible to manage large amounts of environmental sensing data and apply new integrated computing models to acquire information intelligence. Observations advocates the application of cloud technologies to support the information, communication and decision making needs of a wide variety of stakeholders in the complex business of the management of urban and regional development [21]. One of the basic elements for Integrated Environmental Monitoring (IEM) is the processing of “data”, which in the case of urban environments is mostly geo-tagged (e.g. in space and time) and combined with socio-economic and demographic elements. In this respect the OGC provides a sound foundation of standards in the distributed geo-processing domain. Recently OGC highlighted the significance of cloud computing for the geospatial computing world by indicating a number of application areas where cloud computing is well suited, including the modeling of complex environmental applications, the fusion of existing preserved data and new sensor data for decisionmaking, enterprises, scientific and governmental storage and compute-intensive applications. Integration of fragmented environmental information can result in better environmental monitoring in order to mitigate various environmental challenges such as issues related to urban management. Cloud computing can play a major role in achieving environmental information integration by providing on-demand processing and storage capabilities [21].
Cloud computing is rapidly gaining acceptance as a highly flexible means of managing resources. This is certainly true in what has become the cloud computing mainstay of providing resources for Internet facing services, but is also true within enterprise network environments where so-called “private cloud” infrastructures are increasingly being utilized. Such ubiquity of cloud resources hold the promise of enabling new service models (ubiquitous cloud computing infrastructure), where resources are seamlessly utilized at the time and location that are best suited to the needs of the current workload, while at the same time optimizing business objectives such as minimizing cost and maintaining service quality levels [22]. Some main subjects in Cloud Computing such as Structure, Methods and Services will be describing at below.
4.1. Structure
Cloud computing is based on two main techniques: 1) Service Oriented Architecture and 2) Virtualization [23].
Since the paradigm of Cloud computing perceives of all tasks accomplished as a “Service” rendered to users, it is said to follow the Service Oriented Architecture. This architecture comprises a flexible set of design principles used during the phases of system development and integration. The deployment of a SOA-based architecture will provide a loosely-integrated suite of services that can be used within multiple business domains. The enabling technologies in SOA allow services to be discovered, composed, and executed. For instance, when an end-user wishes to accomplish a certain task, a service can be employed to discover the required resources for the task. This will be followed by a composition service which will plan the road-map to provide the desired functionality and quality of service to the end-users [24]. The concept of Virtualization is to relieve the user from the burden of resource purchases and installations. The cloud brings the resources to the users. Virtualization may refer to Hardware (execution of software in an environment separated from the underlying hardware resources), Memory (giving an application program the impression that it has contiguous working memory, isolating it from the underlying physical memory implementation), storage (the process of completely abstracting logical storage from physical storage, Software (hosting of multiple virtualized environments within a single Operating System (OS) instance), Data (the presentation of data as an abstract layer, independent of underlying database systems, structures and storage) and Network (creation of a virtualized network addressing space within or across network subnets) [25].
4.2. Methods
Public Cloud is the traditional mainstream Cloud deployment technique whereby resources are dynamically provisioned by third party providers who share them with the users and bill the users on a fine grained utility computing basis. It offers easy resource management; scalability and flexibility with an economical pay-as-you-go model which is extremely viable especially for small businesses [23]. Amazon’s Web Services and Google’s AppEngine are few examples of public Clouds, also known as external Clouds. Open Stack is an open source cloud which is able to provide all kinds of clouds.
In Private Cloud deployment technique, the computing infrastructure is solely dedicated to a particular organization or business. These clouds are more secure because they belong exclusively to a particular organization [26].
Hybrid Cloud deployment technique integrates the positive attributes both the Public cloud and Private cloud paradigm. For instance, in a Hybrid Cloud deployment, critical services with stringent security requirements may be hosted on private clouds while less critical services can be hosted on the public Clouds [23]. The criticality, flexibility and scalability requirement of a service governs its classification into either the Public or Private Cloud domain. Hybrid cloud deployment is definitely the current trend amongst the major leading cloud providers currently [27].
Community Cloud deployment technique is similar to Public Clouds with the only difference being the distribution of the sharing rights on the computing resources. In a community Cloud, the computing resources are shared amongst organization of the same community. So this Cloud covers a particular group of organizations, which have the same functionalities [28].
4.3. Services
Cloud computing providers offer their services according to several fundamental models. They include SaaS (Software-as-a-Service), PaaS (Platform-as-a-Service), HaaS (Hardware-as-a-Service), DaaS ([Development, Database, Desktop] as a Service), IaaS (Infrastructure-as-a-Service), BaaS (Business-as-a-Service), FaaS (Frameworkas-a-Service), OaaS (Organization-as-a-Service) amongst others.
5. Implementation
For implementing a web based SDSS for metropolitan management, which be able to monitor development activities, compared with their related plans, some specifications had been considered as below:
• Using Web environment for interaction.
• Using SOA for more covering software interactions.
• Using OGC services for interoperability with global map servers.
• Using Open Source facilities in system developments.
The other issue which had been considered was selecting a suitable evaluation model such as MCE with the ability of calibration. Figure 3 schematically shows these configurations.
A Database server stores and manages the Spatial Data. By using Database, the GIS Server will produce spatial analysis. The clients will use these abilities via web connections. In additional a modeling application, prepares required evaluations by its relations to GIS server and Database.
5.1. Conceptual Model
For implementing a high resolution monitoring of activities in town, a system designed in which each districts will equipped by a Geoserver and will monitor its projects. As Figure 4 shows, in each Region a Geoserver will snap all related districts maps and by adding Region projects in them a Region monitoring will be produced.
At the end, in Tehran Urban Observatory All Regions outputs will build a Metropolitan Monitoring. Figure 5 shows a conceptual model diagram of this process.
5.2. System Block Diagram
To be more familiar with different parts of system, a block diagram is shown in Figure 2. As it shows, the system included of two main sections: 1) The Urban Management SDSS, and 2) City & Citizen. The Urban Management SDSS contains 2 main parts too. The first one is about defining the inter relations and weights of
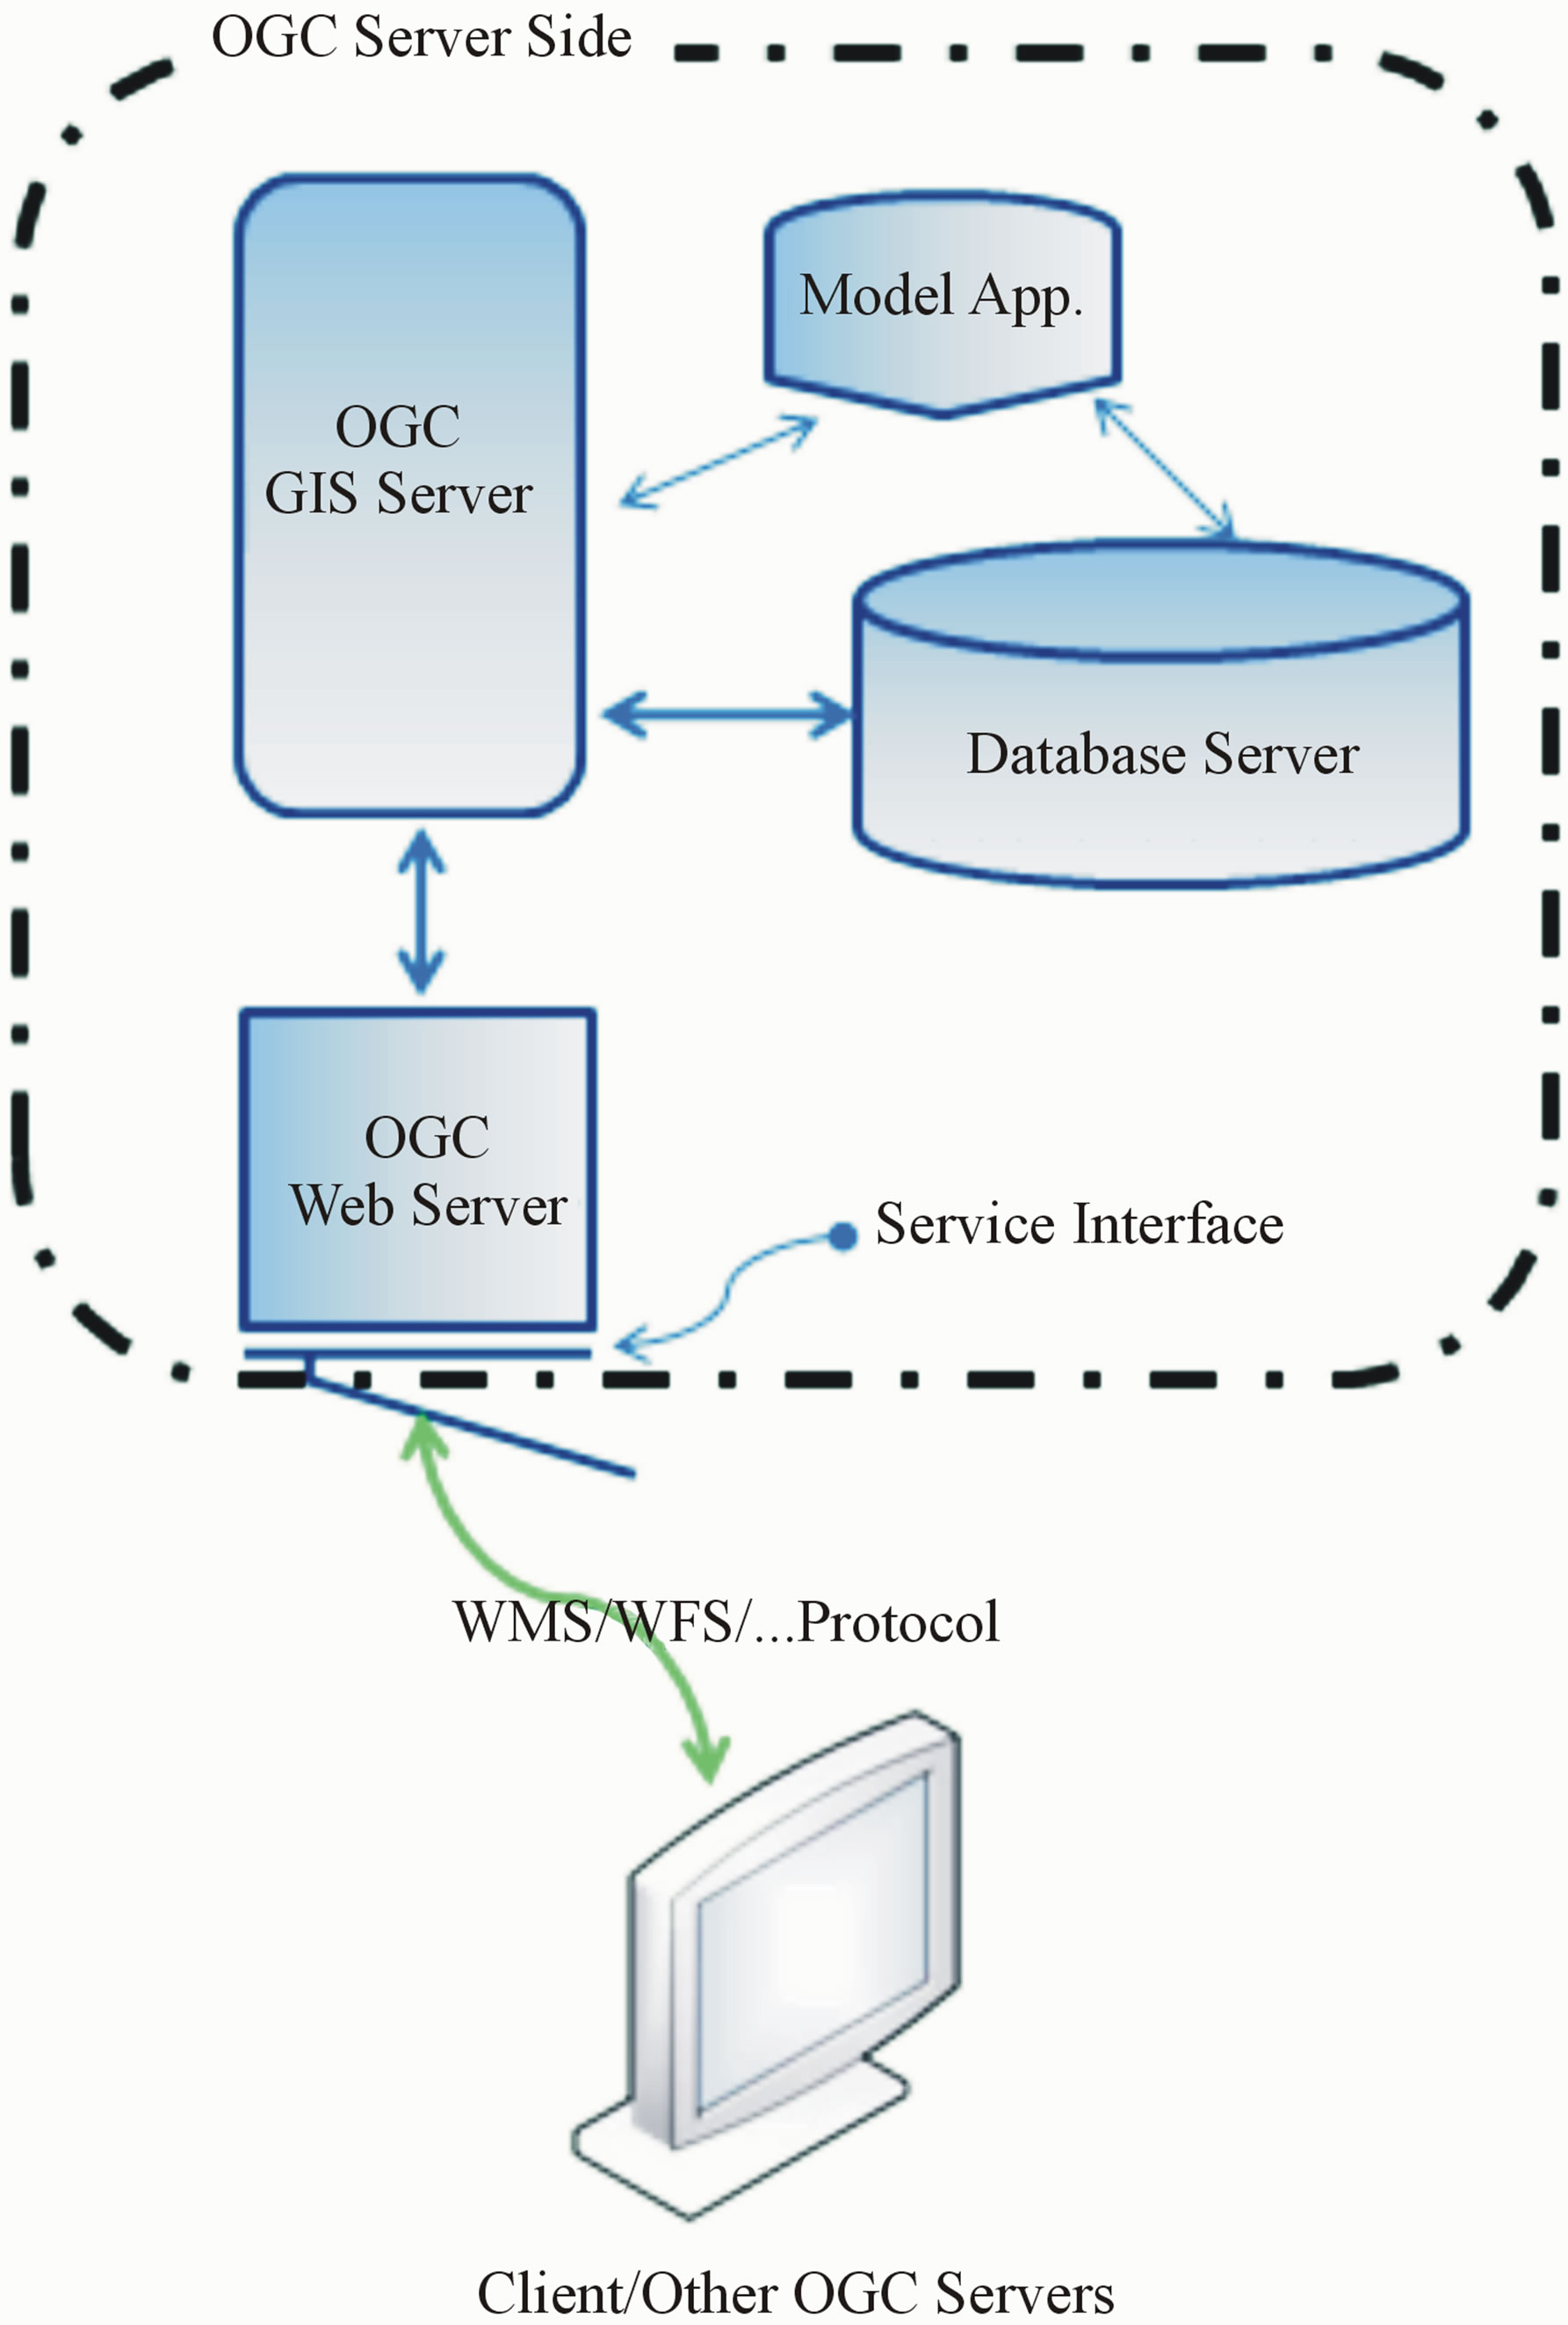
Figure 3. OGC web based SDSS.
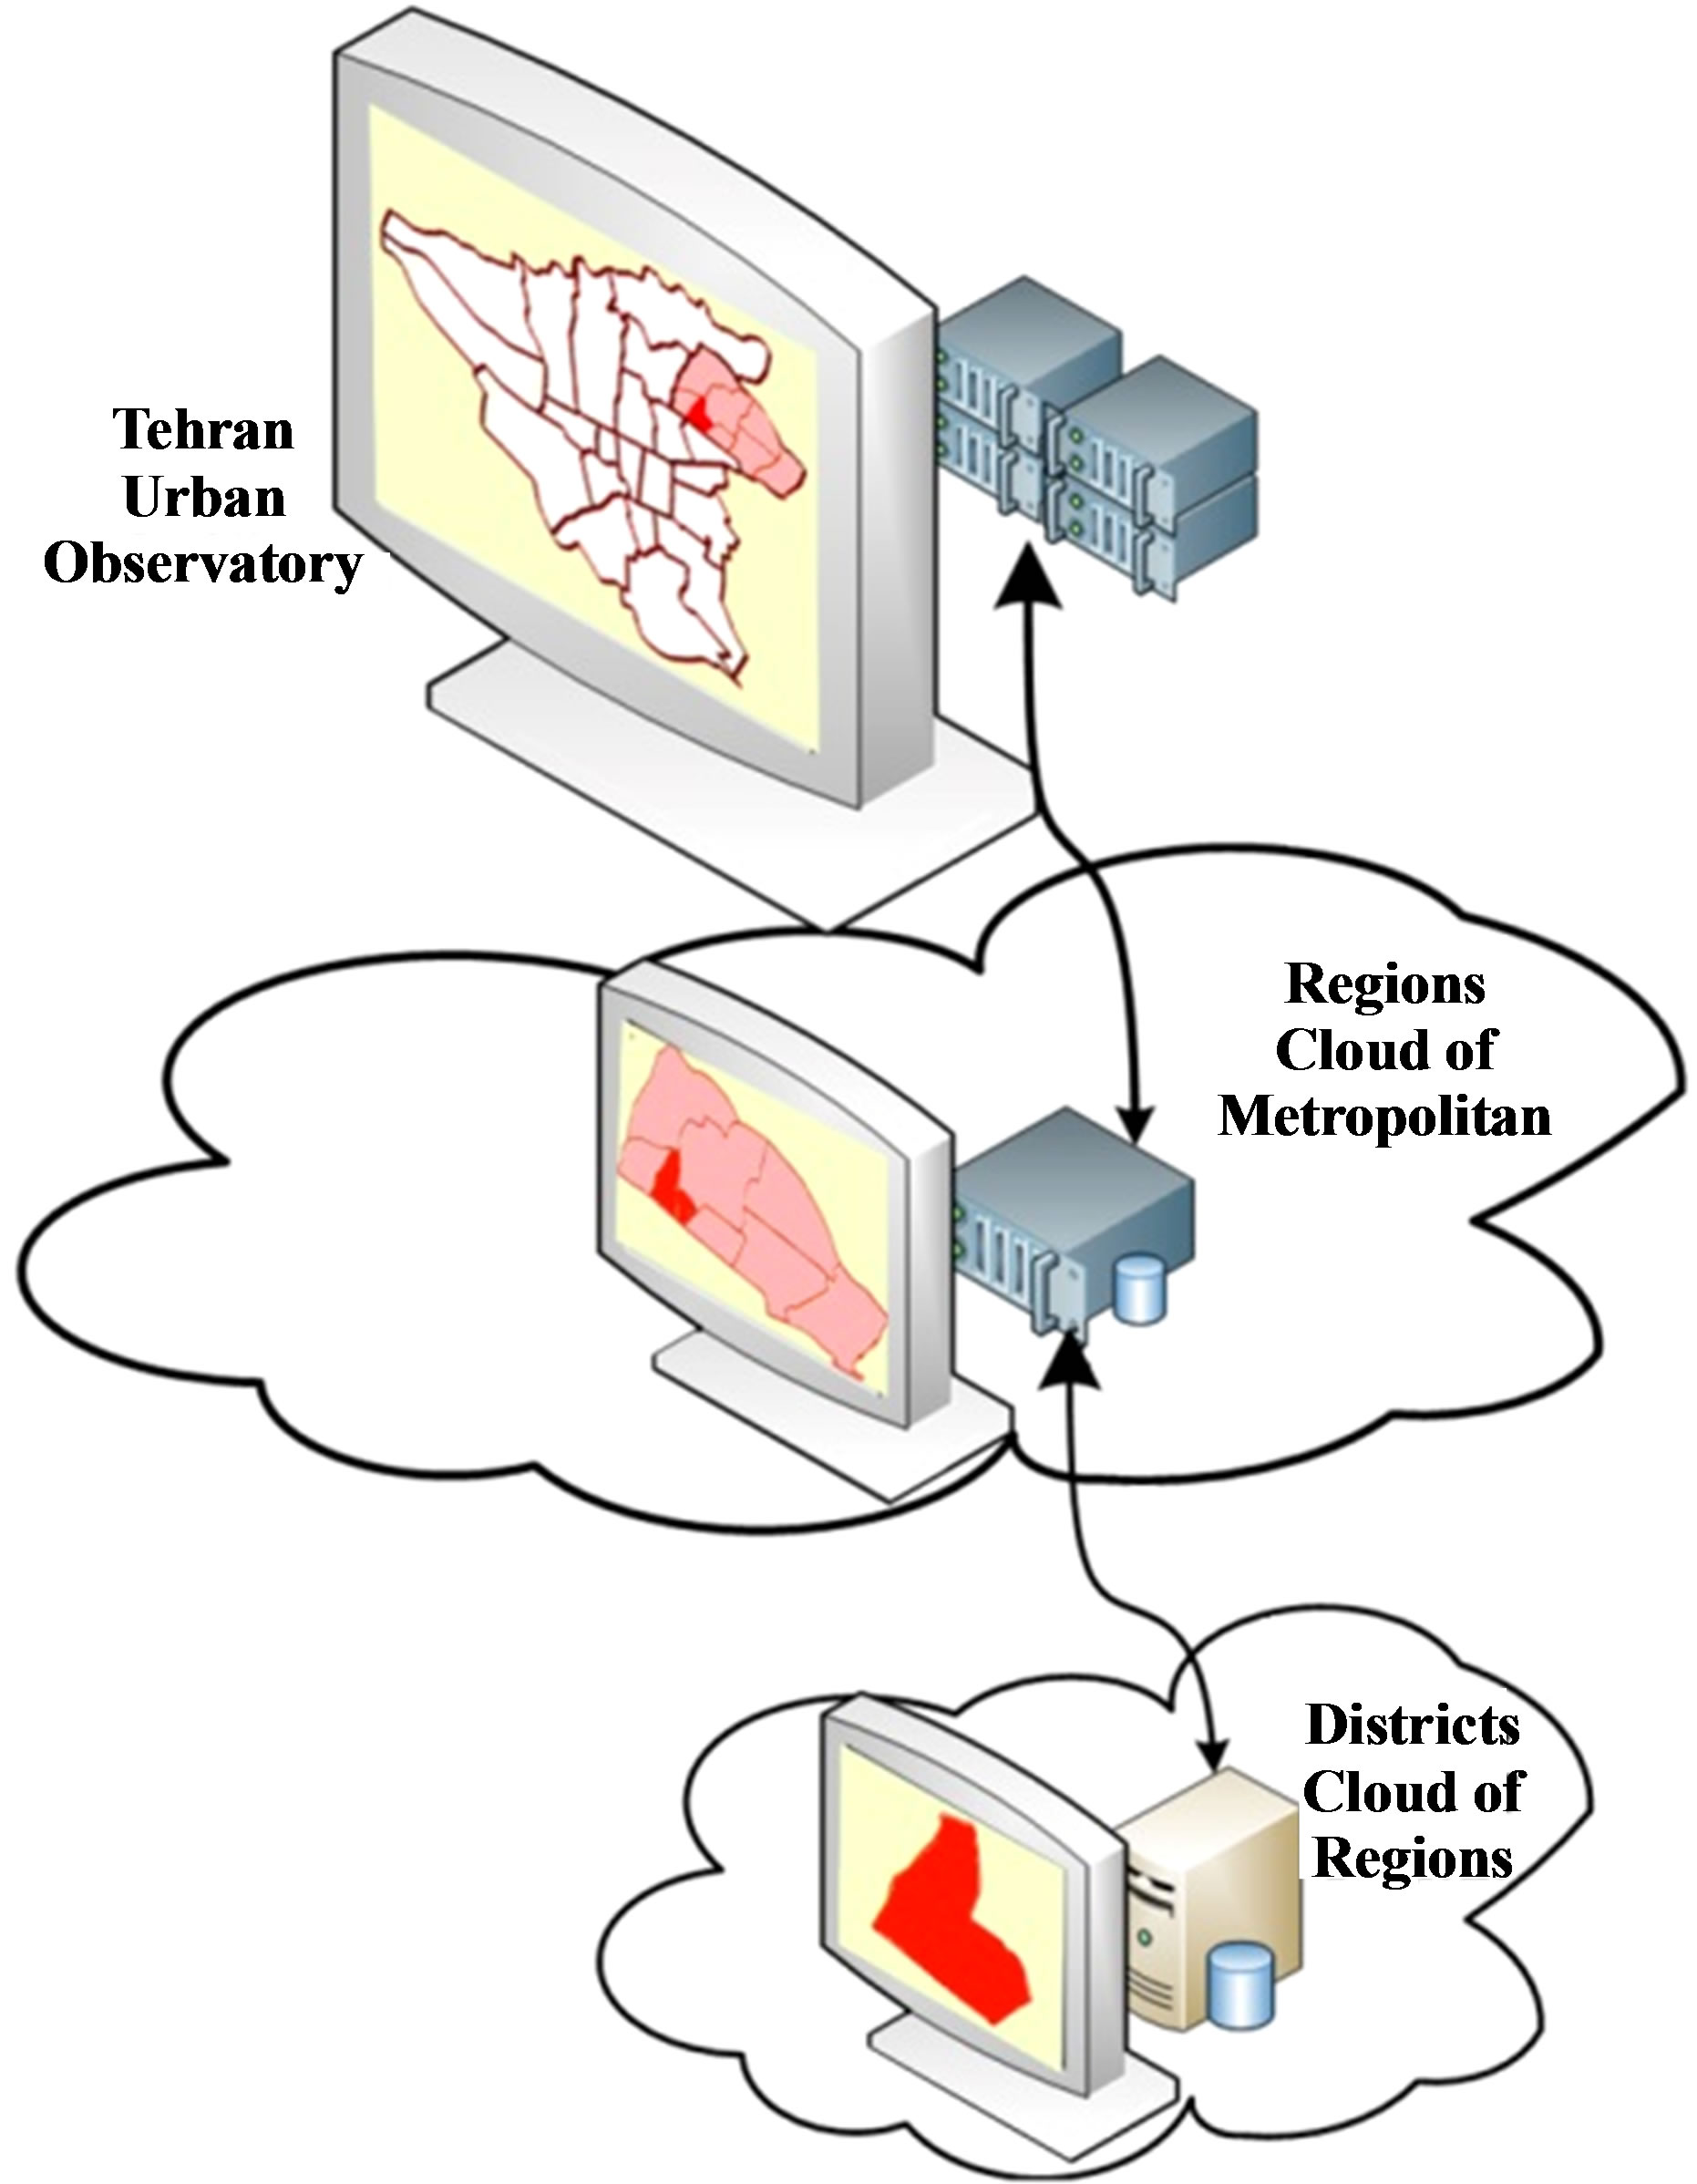
Figure 4. Tehran monitoring conceptual model.
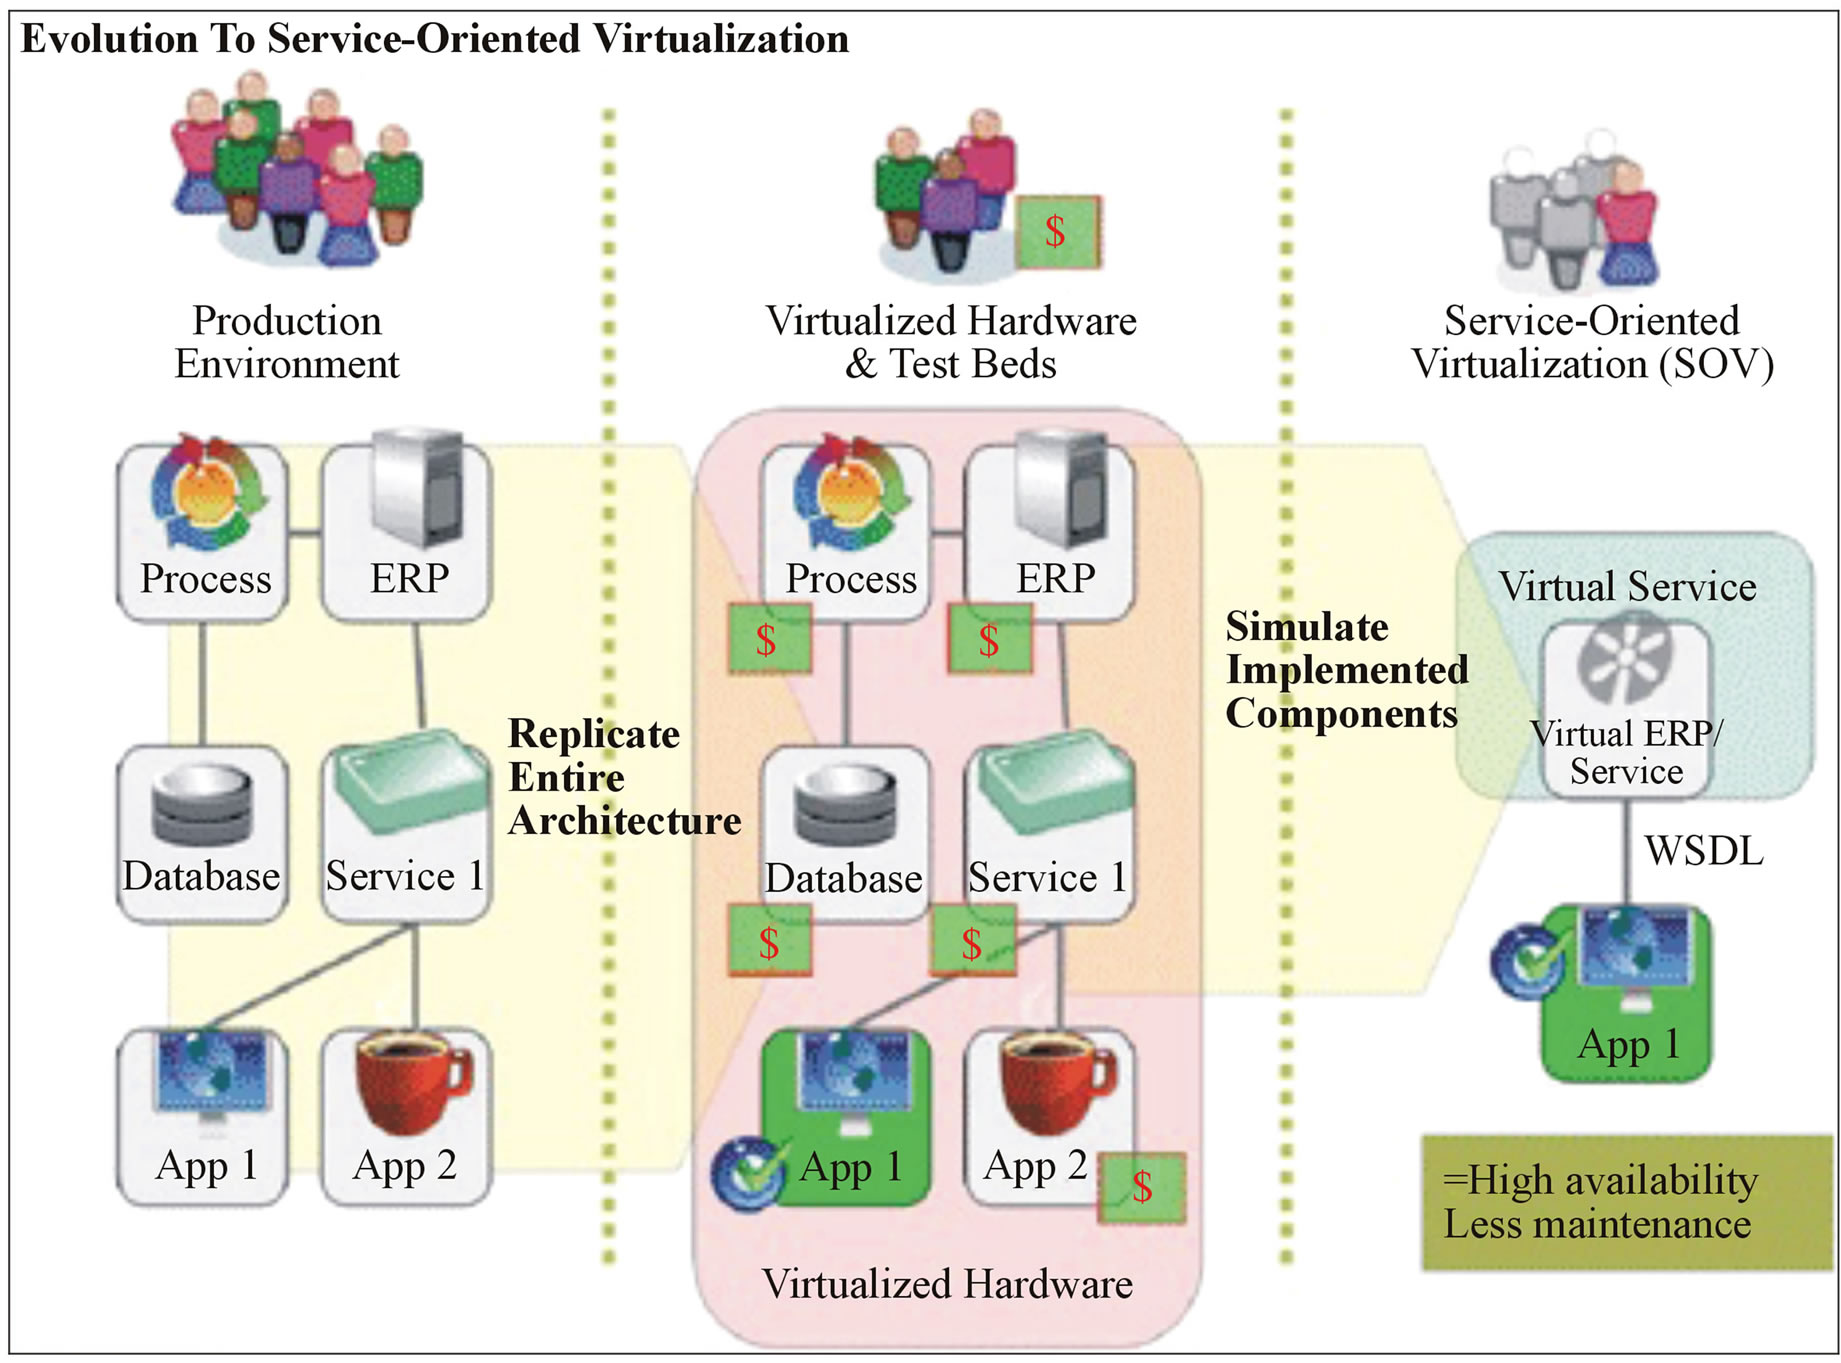
Figure 5. Evolution to service oriented virtualization (Aberdeen Group, Inc).
Plan principles and Plan project, and the second one is defining the locations of Projects. By considering the amounts of projects progresses and calculating their related Action Plans, Objectives and Goals progresses, the realization of each components of urban plans at different parts of city may be observed.
The next section is an SDSS which serves to citizens. One can define priorities between different land uses and the system shows the suitable places for those priorities. Figure 6 illustrates the system block diagram.
5.3. Methods and Materials
Implementing the system contains of five main different environments as below:
1) Web based non spatial programs in C# for defining the relationships between principles of Tehran Enhancement Plan and weighting them.
2) Generating TIN layers and Spatial Analysis has been done in ArcGIS10.
3) OGC web services have been done by Geoserver 2.1.
4) Connection between Server and Client has been done by OpenLayers.
5) Delphi 7 has been used for writing some temporary programs.
5.4. Spatial Analysis
After defining the relationships between different components of Tehran Enhancement Plan and specifying their weights, the progresses of projects have been initialized, and the progresses of their related plans calculated. A point feature dedicated to each project record which indicates its location.
By using the values of progress fields in projects attribute tables, a 3D TIN model surface generates. To spreading the TIN layer for covering all corners of the city area, four false projects with progress values of zero was placed at outer cadre of city border. it is possible to clip the produced Tin layer by city border, later.
The generated surface can be produced upon all Goals, specified Goal, specified Objectives and specified Action Plan. Figure 7 shows a sample of each one.
5.5. Presenting TIN Models in Geoserver
The Geoserver software does not support the TIN model layers. For presenting the results of spatial analysis by Geoserver below steps had been done:
By using the Create Fishnet function a Grid layer generated from TIN layers. The distance of cells in Grid has been defined as 500 meters. Each cell contains a point feature at its center. The generated Grid had been clipped by city border. By using Interpolate Shape function the center points converted to 3D features which their Z values were filled by the amount of TIN surface elevation in those places. At the end a Buffer function built circles with radius 250 meters around center points. This operation generates a vector layer circles which their attribute records contain the value of their related progress amounts (Figure 8).
Now these vector layers can be presented in Geoserver
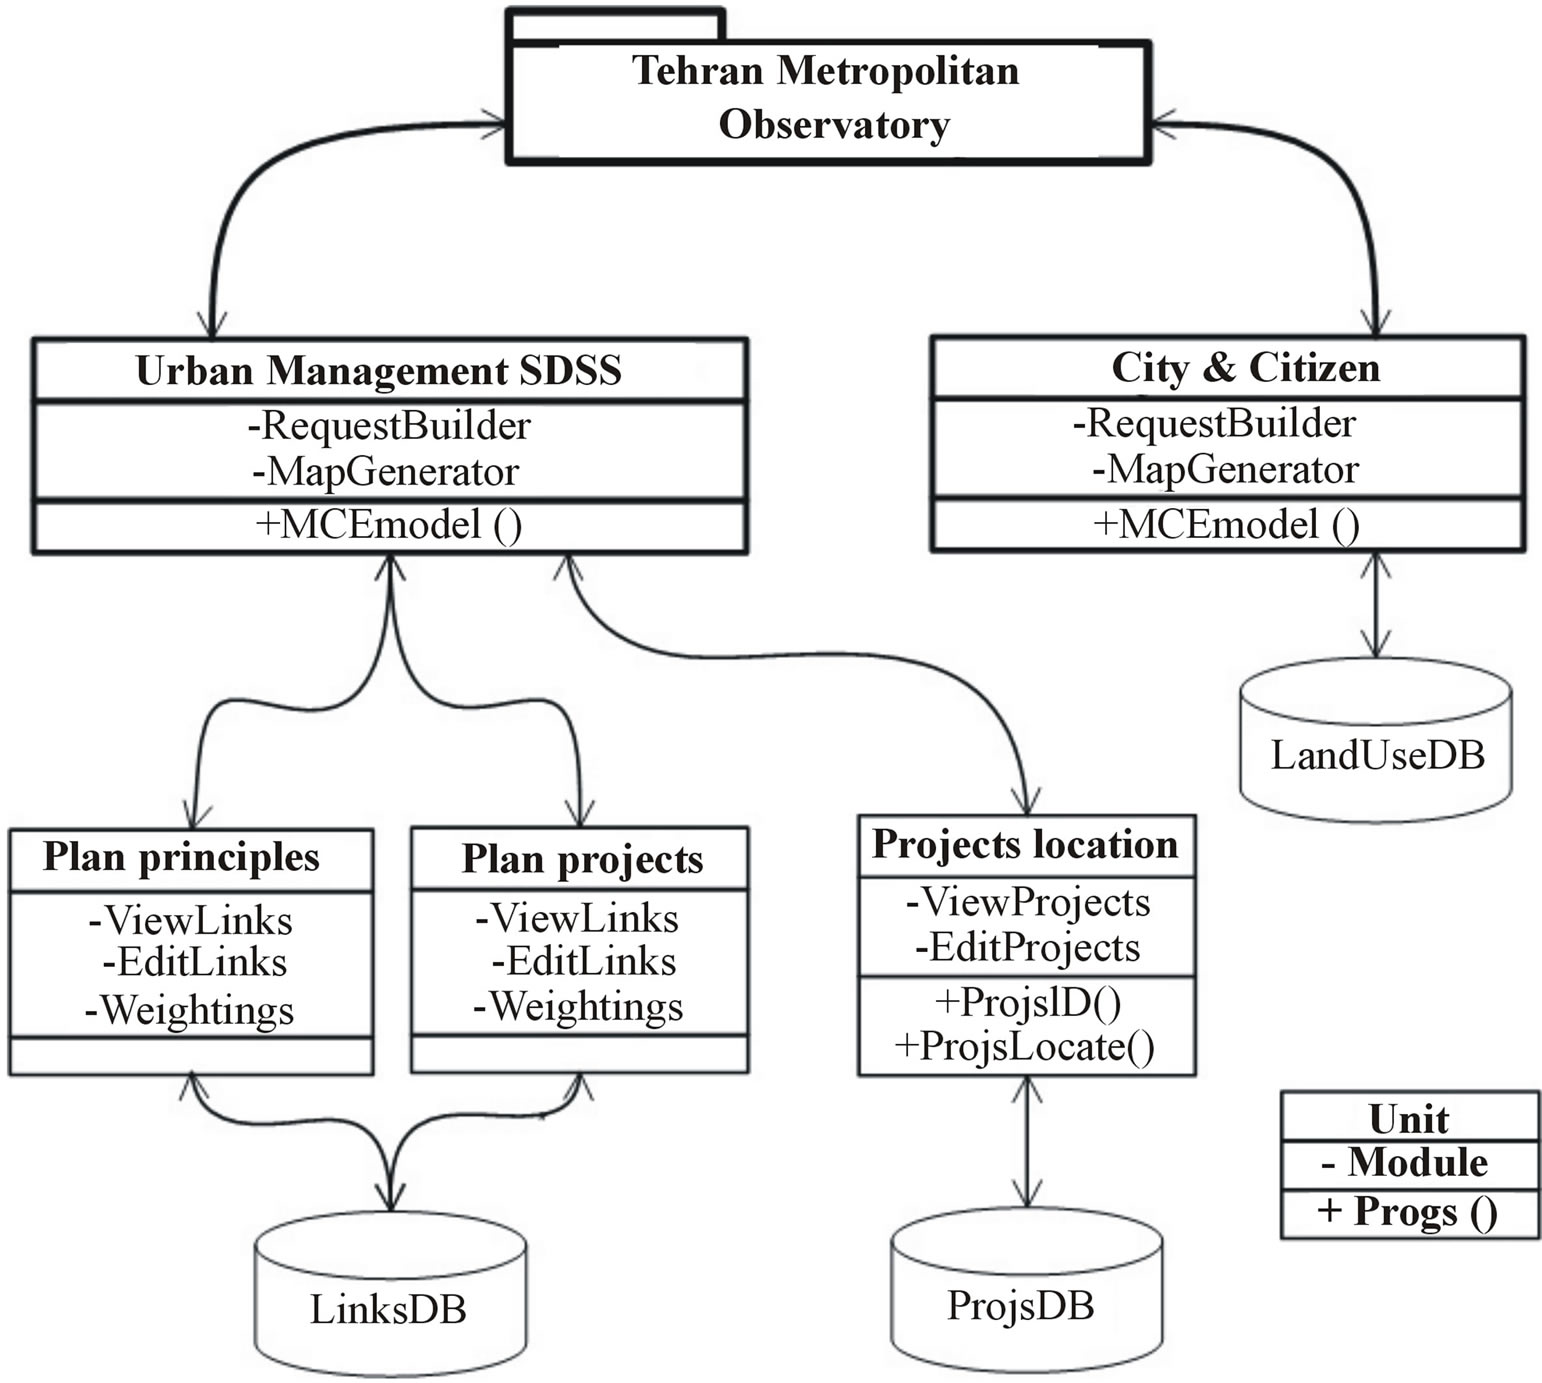
Figure 6. System block diagram.
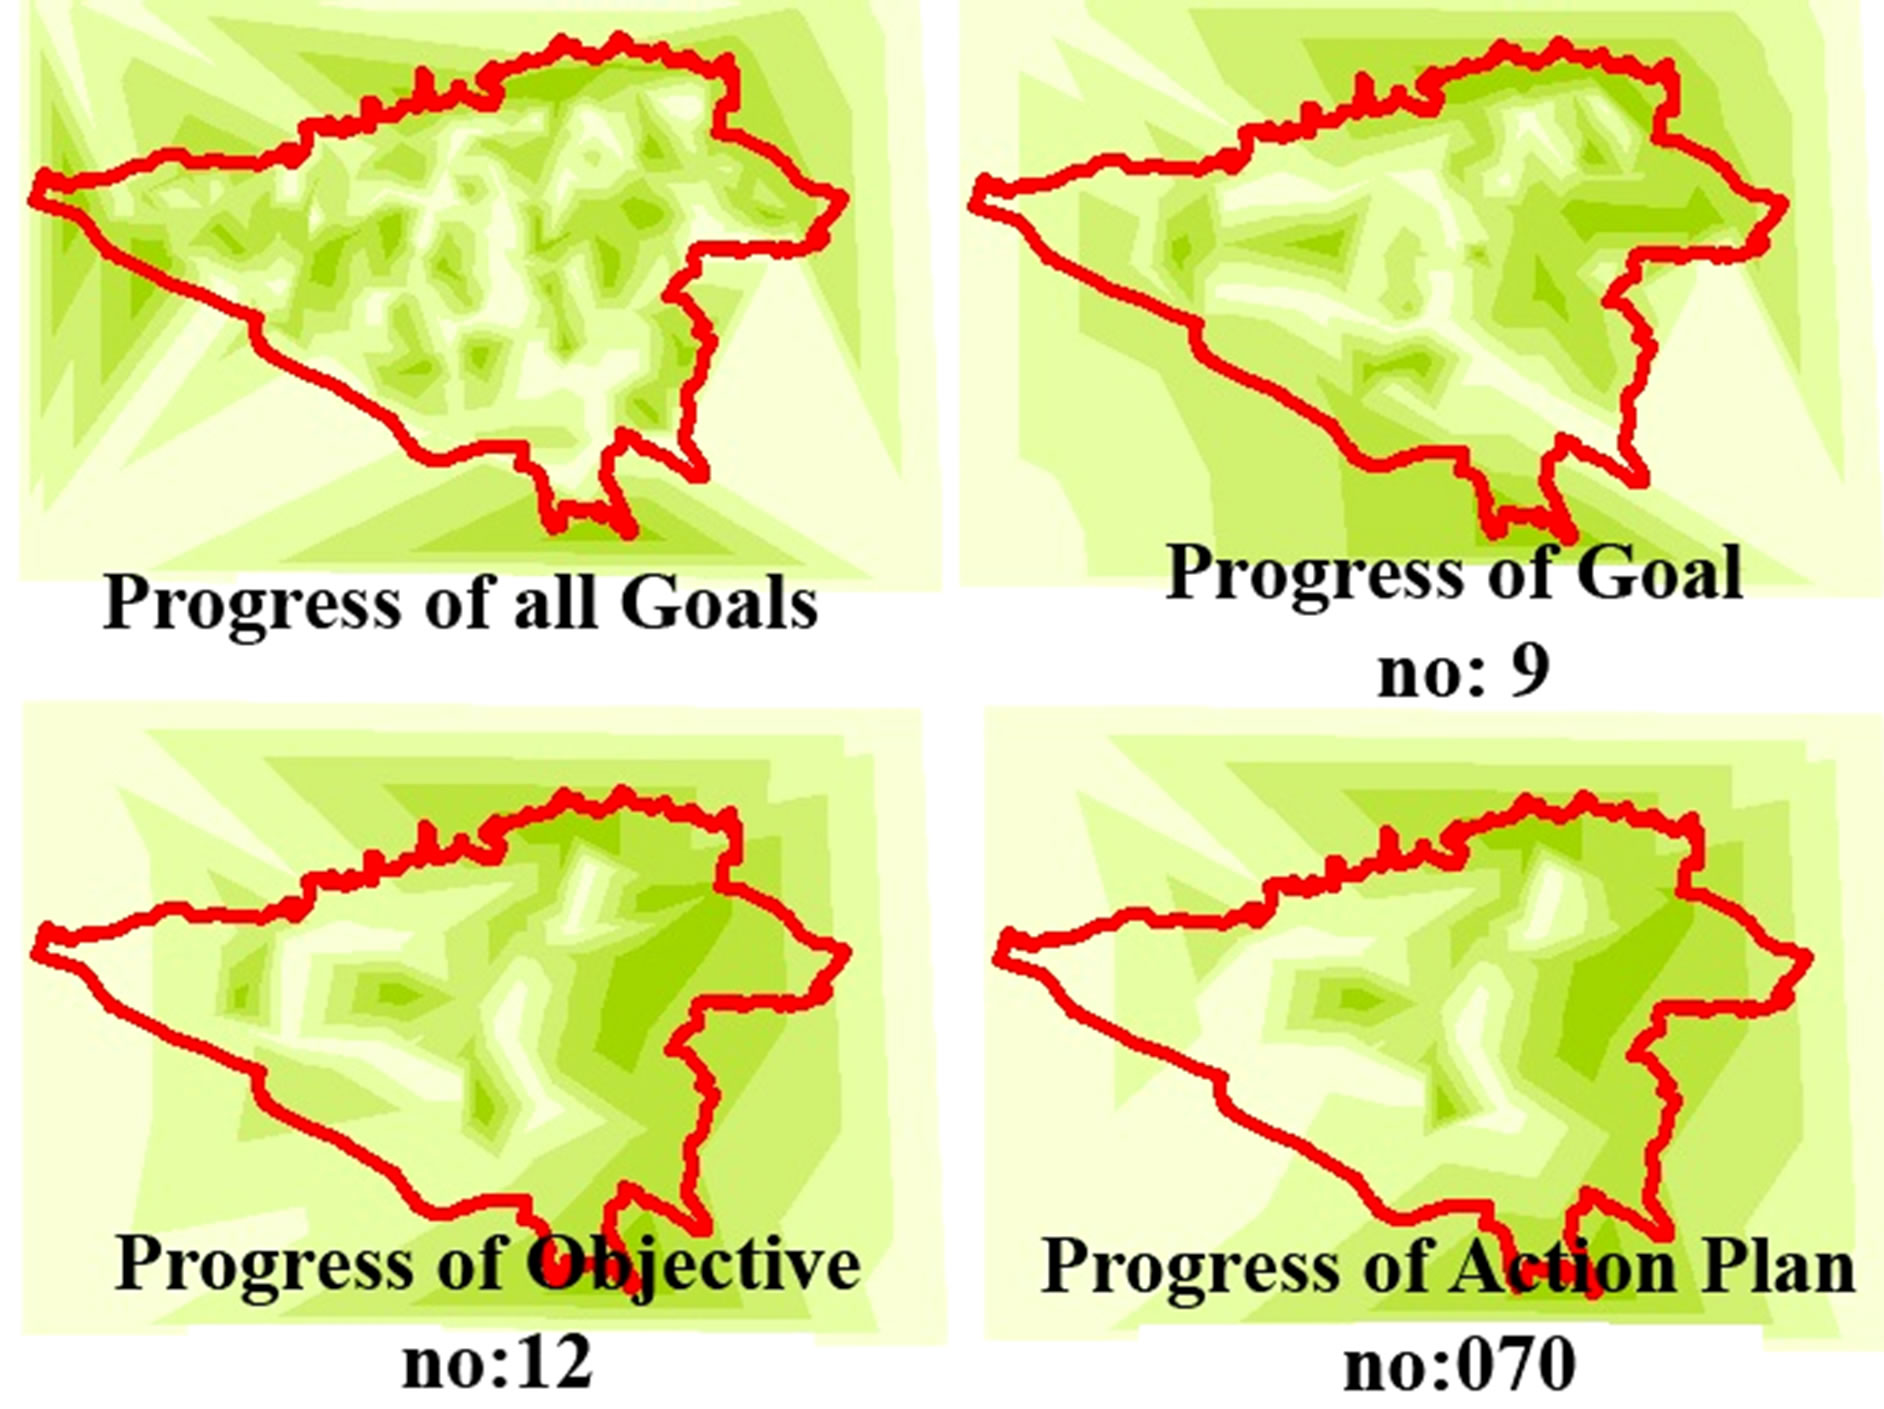
Figure 7. Spatial presentations of plans progress.
and by using some conditional statements such as: PropertyIsGreaterThanOrEqualTo in their SLD files, it is possible to render them as thematic maps.
For showing more than one layer by just requesting once Getmap function, the Layers Group feature of Geoserver may be used. Figure 9 shows a sample of this kind of maps in web.
With the same method, an SDSS application made for citizens. They can define their priorities on different land uses such as Metro stations, Hospitals and Schools, and ask the system to illustrate the most suitable places in town. For each one of land uses a raster layer was made by Euclidean Distance function. Then by building Grid and generating circle buffers the results were presented
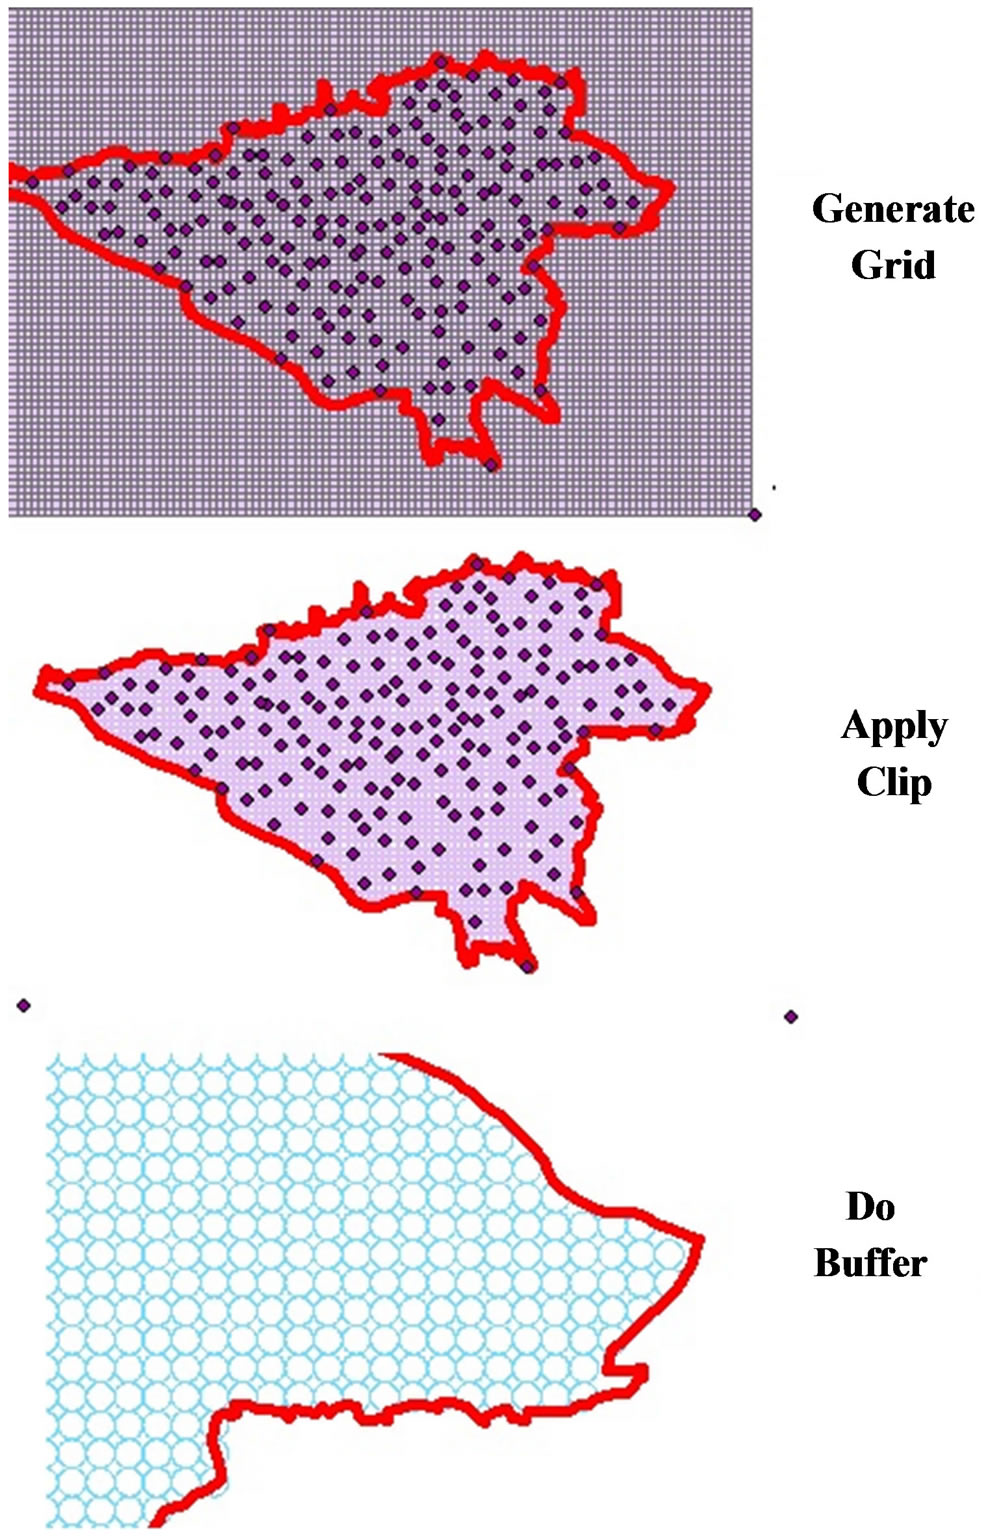
Figure 8. Steps for preparing TIN layers.
to clients (Figure 10).
5.6. The Necessity of Cloud
This study finished its job by implementing above pro-
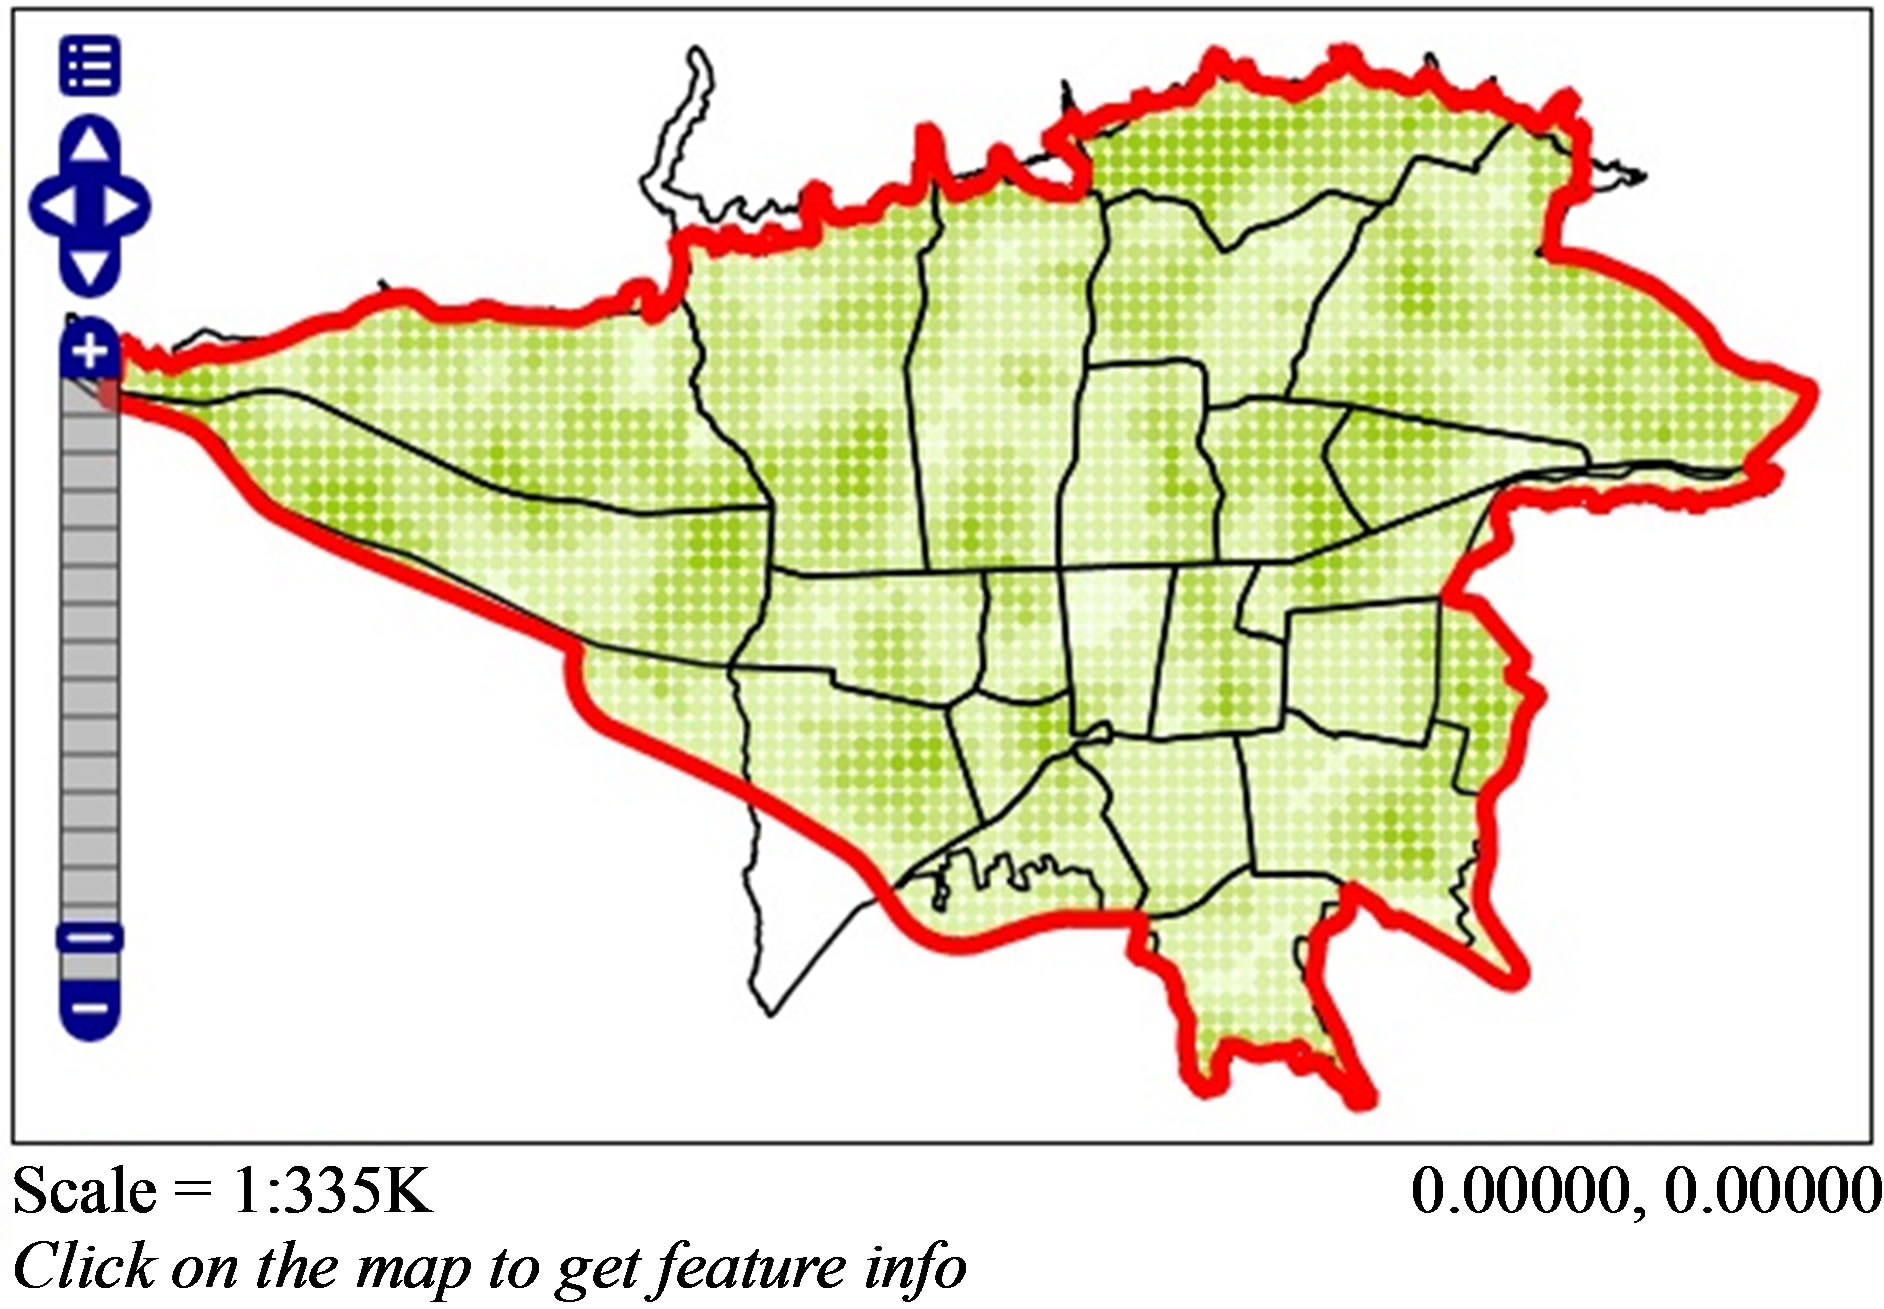
Figure 9. Presenting thematic maps in web.
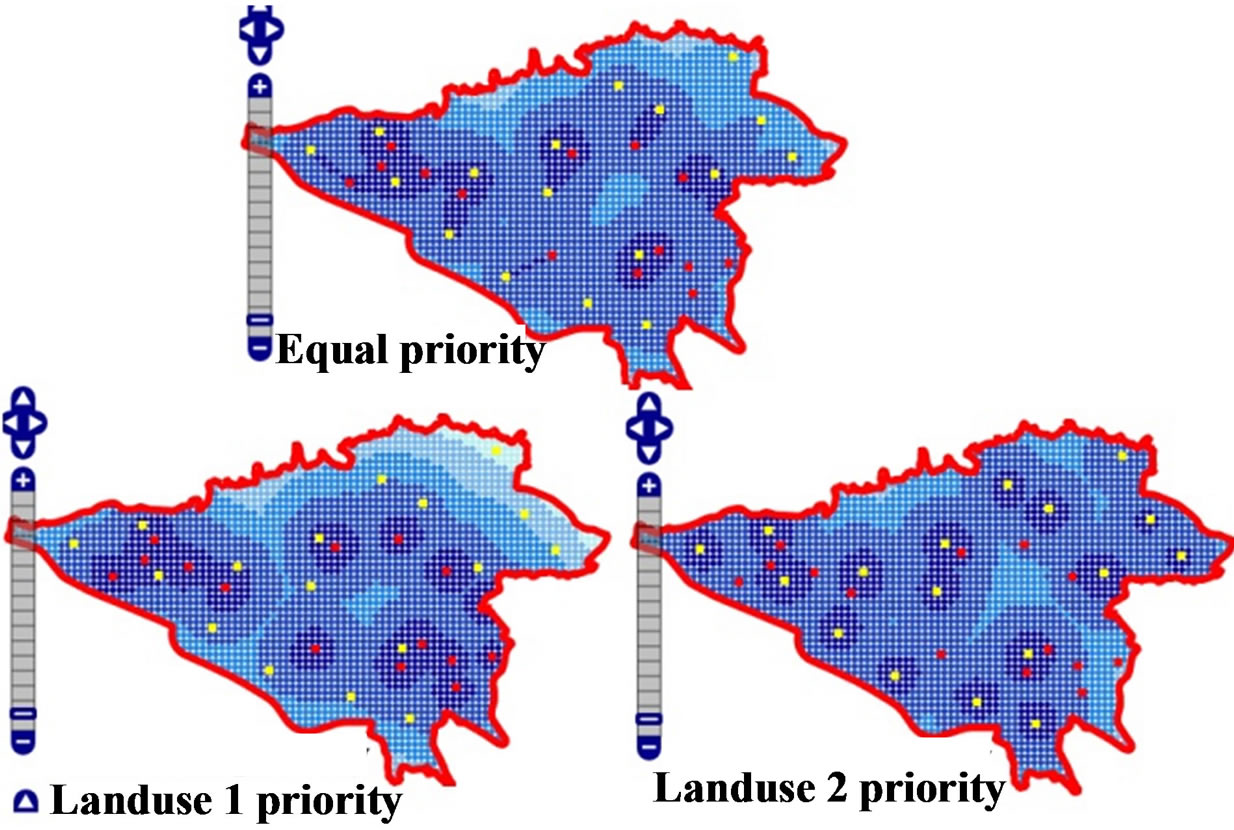
Figure 10. Suitable place upon different priorities.
totype, which supposes that each server in District levels will be equipped with Geoserver software and presents its report to upper Region server via WMTS service. Each Region will add its special reports on it, and all will be represented to Tehran Urban Observatory server in the same way. Upon the IT section of Tehran Municipality points of view, it is bit impossible to provide the required server administer and hardware maintenances at districts level. Perhaps it is also difficult even at Region levels too. On the other hand, for preparing a high resolution monitoring, it is needed that each District, handle its own system, and reflects the states of its domain projects for the related Region. By appearance of cloud computing technique, it is convenient to build a private Cloud in Tehran Data Center servers and dedicate a virtual machine for each District. These virtual machines will be preinstalled by Geoserver and other required peripherals software. So upon the above explanations, the offer of this study was to implement an Open Stack private Cloud Computing in Tehran Municipality Data Center and dedicate a machine instance for each one of districts and regions. All instances will have preinstalled Geoserver. In this way, the hardware maintenance difficulties will be centralized in a specialized environment, and districts will focus just on their operation issues.
6. Conclusions
In this study, a prototype of a web-based SDSS system has been implemented. It is able to support managers on evaluating the progress of urban development plans. Since Metropolitans are so vast and contain enormous different activities, controlling all of them by a single application is not possible. Tehran Metropolitan contains 22 regions and each Region contains several districts. The whole city has about 130 districts. For having a high resolution monitoring, it is needed that each District handles its own activities and proposes them to its related Region. Subsequently, the regions may add their regional projects to them and propose them all to Tehran Urban Observatory.
But in practice it costs too much to provide server administer and hardware maintenances at districts level. It is even hard to be done at regions level too.
As described in Cloud Computing section of this paper, one of the valuable features of Cloud Computing has computational processes without involving in difficulties of hardware maintenances and software installations. So it proposed to implement a private cloud in Tehran Data Center and dedicate a virtual machine for each District or Region. With this arrangement, it is possible to implement high resolution monitoring for Tehran Metropolitan, while being far from difficulties of preparing so many expert people for server administrator in districts and regions of city.
In this study, the relations between each components of Tehran Enhancement Plan and their weights have been defined. It will be good as a future work in this subject, if each of components can be seen as objects which are compound of several attributes. The attributes may store more features for each component and it will be possible to predict the result of each decision in town. By this way, Metropolitan will be far from too many test error decisions.
REFERENCES
- G. R. Stephens and N. Wikstrom, “Metropolitan GOVERNMENT and Governance: Theoretical Perspectives, Empirical Analysis, and the Future,” Oxford University Press, New York, 2000.
- D. Triantakonstantis and G. Mountrakis, “Urban Growth Prediction: A Review of Computational Models and Human Perceptions,” Journal of Geographic Information System, Vol. 4, No. 6, 2012, pp. 555-587. http://dx.doi.org/10.4236/jgis.2012.46060
- “Monitoring Human Settlements with Urban Indicators,” Habitat, Kenya, 1997.
- B. Au-Yeung, et al., “Brisbane Urban Growth Model: An Integrated Infrastructure Management. Green Technologies: Concepts, Methodologies, Tools and Applications,” 2011, p. 283.
- M. Mohan, et al., “Dynamics of Urbanization and Its Impact on Land-Use/Land-Cover: A Case Study of Megacity Delhi,” Journal of Environmental Protection, Vol. 2, No. 9, 2011, pp. 1274-1283.
- M. Polidoro, J. A. de Lollo and M. V. F. Barros, “Urban Sprawl and the Challenges for Urban Planning,” Journal of Environmental Protection, Vol. 3, No. 9, 2012, pp. 1010-1019. http://dx.doi.org/10.4236/jep.2012.39117
- J. Zhang, et al., “The Administrative Division and Regional Governance in Urban Agglomeration Areas,” City Planning Review, Vol. 9, 2002, p. 012.
- E. Canel, “Municipal Decentralization and Participatory Democracy: Building a New Mode of Urban Politics in Montevideo City?” Revista Europea de Estudios Latinoamericanos y del Caribe/European Review of Latin American and Caribbean Studies, 2001, pp. 25-46.
- Foundation, “Trends in Urbanisation and Urban Policies in OECD Countries: What Lessons for China?” OECD Publishing, 2010.
- Killam, “Vision, Mission, Goals & Objectives ... oh My!” Group Works, #6107, 2003.
- C. Pelizaro and D. McDonald, “Spatial (GIS-Based) Decision Support System for the Westernport Region,” Applied GIS, Vol. 2, 2006. http://dx.doi.org/10.2104/ag060017
- J. Choi, et al., “Utilizing Web-Based GIS and SDSS for Hydrological Land Use Change Impact Assessment,” Transactions of the ASAE, Vol. 48, No. 2, 2005, pp. 815- 822.
- X. Lu, “An Investigation on Service-Oriented Architecture for Constructing Distributed Web Gis Application,” IEEE International Conference on Services Computing, Vol. 1, 2005, pp. 191-197.
- Wikipedia, “Open Geospatial Consortium,” 2013. http://en.wikipedia.org/wiki/Open_Geospatial_Consortium
- OGC, “OGC Standards and Supporting Documents,” 2013. http://www.opengeospatial.org/standards
- A. Alesheikh, H. Helali and H. Behroz, “Web GIS: Technologies and Its Applications,” Symposium on Geospatial theory, Processing and Applications, 2002.
- Geoserver, “Welcom to Geoserver,” 2013. http://geoserver.org/display/GEOS/Welcome
- F. Akinyemi, “Preliminary Design of a Spatial Decision Support System for Poverty Management,” International Archives of Photogrammetry Remote Sensing and Spatial Information Sciences, Vol. 35, No. 2, 2004, pp. 313-318.
- J. Burdziej, “A Web-Based Spatial Decision Support System for Accessibility Analysis—Concepts and Methods,” Applied Geomatics, Vol. 4, No. 2, 2011, pp. 75-84.
- C. Yang, et al., “Spatial Cloud Computing: How Can the Geospatial Sciences Use and Help Shape Cloud Computing?” International Journal of Digital Earth, Vol. 4, No. 4, 2011, pp. 305-329.
- Z. Khan, et al., “An Architecture for Integrated Intelligence in Urban Management Using Cloud Computing,” Journal of Cloud Computing, Vol. 1, No. 1, 2012, pp. 1- 14.
- Merwe, et al., “Towards a Ubiquitous Cloud Computing Infrastructure,” 17th IEEE Workshop on Local and Metropolitan Area Networks, 2010.
- M. Naghavi, “Cloud Computing as an Innovation in GIS & SDI: Methodologies, Services, Issues and Deployment Techniques,” Journal of Geographic Information System, Vol. 4, No. 6, 2012, pp. 597-607.
- P. Goyal, R. Mikkilineni and M. Ganti, “FCAPS in the Business Services Fabric Model,” 18th IEEE International Workshops on Enabling Technologies: Infrastructures for Collaborative Enterprises, 2009.
- B. Golden, “Virtualization for Dummies,” For Dummies, 2008.
- A. Fox, et al., “Above the Clouds: A Berkeley View of Cloud Computing,” University of California, Berkeley, Rep. UCB/EECS, 2009.
- U. Sait, “The Future of Cloud Computing,” Intel Executive Summary, 2008.
- B. P. Rimal, E. Choi and I. Lumb, “A Taxonomy and Survey of Cloud Computing Systems,” 5th International Joint Conference on INC, IMS and IDC, 2009.
NOTES
*Corresponding author.