Natural Science
Vol.6 No.3(2014), Article ID:43224,9 pages DOI:10.4236/ns.2014.63014
Katla volcano in Iceland, potential hazards and risk assessment
1University of Iceland, Earthquake Engineering Research Centre, Selfoss, Iceland
2University of Kyoto, Disaster Prevention Research Institute, Kyoto, Japan (visiting); jonase@hi.is
Copyright © 2014 Jónas Elíasson. This is an open access article distributed under the Creative Commons Attribution License, which permits unrestricted use, distribution, and reproduction in any medium, provided the original work is properly cited. In accordance of the Creative Commons Attribution License all Copyrights © 2014 are reserved for SCIRP and the owner of the intellectual property Jónas Elíasson. All Copyright © 2014 are guarded by law and by SCIRP as a guardian.
Received 22 October 2013; revised 22 November 2013; accepted 30 November 2013
Keywords: Hazard; Probability; Volcanic Eruption; Risk Assessment
ABSTRACT
Katla in Iceland is one of the famous volcanoes of the world for the ferocity of the eruptions and associated jökulhlaups. The major potential hazards are the jökulhlaup floods that can hit three different floodplains, an associated tsunami that can harass the south coast of Iceland and a volcanic ash cloud that endangers civil aviation on an unknown scale. The eruption probabilities in Katla and the two others known eruption sectors of the Mýrdalsjökull glacier are reassessed and a 2013 risk curve for the next eruption in Katla is found. The probability of tsunami heights is estimated and the risk from other tsunami sources in the Atlantic Ocean is included. For the danger to aviation, two classes of eruption are defined: an EYF (EYjaFjallajökull) eruption class that does not produce volcanic plumes that are dangerous for air traffic in Europe, and another stronger class, the KAT (KATla) class, producing plumes that most likely are dangerous for air traffic in Europe. Overall probabilities for an EYF class eruption in next year and a KAT class eruption in the next 5 years are estimated.
1. INTRODUCTION
1.1. Famous Volcano
Icelandic volcanoes have female names like the hurricanes in USA have, and this old lady, the Katla volcano enjoys considerable international fame. All her whereabouts are well described in Wikipedia [1] where location maps, pictures and a short historical account can be found together with the newly discovered connection to the Eyjafjallajökull system, compiled by members of the Earth Science Institute of University of Iceland. Stories of Katla are very popular on the Internet where she even has her own homepage [2]. Most of these writings are more amusement then science.
Katla is one of the most active volcanoes in Iceland. It is located near the south coast and the upper parts of the volcano are covered by the 600-km2 Myrdalsjökull ice cap, Figure 1, who conceals a large caldera, about 100 km2 in area, where the ice is 400 - 700 m thick [3]. In this location and elevation, annual precipitation in Myrdalsjökull may be considered to be in excess of 4000 mm/year, so the ice accumulation may be 400 million m3 each year. However, summer melting of the glaciers flowing through the passes in the calderas mountain ring, geothermal activity and groundwater outflow, do keep the water balance of the caldera close to the zero. However, climatic variations do have their effect on the ice surface, especially the ongoing warming due to climate
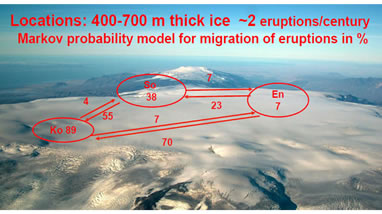
Figure 1. The top of the Mýrdalsjökull caldera. Crater locations and probabilities. Cauldrons from geothermal activity may be seen inside the caldera rim. Eyjafjallajökull in the distance.
change.
Besides being unpredictable and gloomy, Katla also has a very complex character. There are three basins in the caldera, each with a crater. The easternmost basin, Kötlujökull (Ko sector), is the largest and drains to the east (60 km2), the Sólheimajökull basin (So sector, 19 km2) drains to the south, and the Entujökull basin (En sector, 23 km2) drains to the northwest. In historical times, most floods came from the Ko source, a few from So, but there have been no eruptions in the En sector in historical times [4]. Crater basins, each has an associated outlet through a mountain pass [5].
1.2. Glacial Floods
Katla does not have regular eruptions as many think, but in the last 1000 years, eruptions have come every 49 years on the average, but with intervals up to 200 years. It is not the eruptions as such, that are the major hazard, but their consequences. The foremost hazard is the devastating jökulhlaups (glacial burst floods), with estimated peak flow up to 300.000 m3/sec, [6], and events that are a life threat to humans and animals, and do cause extensive property damage. Many do expect a tsunami wave along the south coast to follow such an event and now there is a new threat: a volcanic ash cloud that stops air traffic even for a longer time than Katla’s little sister, Eyjafjallajökull, did in 2010.
The jökulhlaups are melt water from the heat of the erupted magma and accumulated in cavities around the crater. Increasing pressure from the rising water level in the cavity makes the water find its way under the ice, over the mountain passes to the flood channels below. This last phase does normally break up the glacier in large ice flows that are carried downstream. In this case, the flood takes on the character of a dam break flood that comes very suddenly with a lot of debris, mainly ice fragments.
By mathematical and numerical [7] research, it has been concluded that big jökulhlaups are no ordinary floods, but translatory waves that run with high velocity along the river channels and over dry land as well. The flood comes as a wall of water with high velocity and therefore levels to the ground everything that it hits [8]. The destructive power of such floods is enormously greater than that of ordinary floods.
When the water wall hits the beach along a front of many kilometers long, it creates a water wave. This wave is a translatory wave close to the beach, but on deeper water where the wave celerity is higher, the ocean wave runs away from the translatory wave, its creator, and becomes an oscillatory wave. This tsunami has been estimated and compared to other potential tsunami sites in the North Atlantic and the combined risk function for the tsunami heights in a referece point close to Vestmanneyjar Islands found [9].
1.3. Eruption History
Eruption history [4], which is the record for the years when the eruptions happened, provides indications of eruption magnitudes and these are related to the length of the interval between eruptions. Originally it was believed that long intervals meant a big eruption when it finally came, but regression analysis pointed in the other direction: When there has been a large eruption, the old lady takes a long rest. This may explain the long interval we are in right now; the last eruption was in 1918, 95 years ago and that eruption was a large one. The eruption timeline data are an excellent raw material for eruption statistics, but due to the complexity of the problem, a complicated stochastic model has to be applied to estimate the eruption probability functions for all three locations, Ko, So and En. This was done with numerical simulation about 10 years ago, but is now updated in this publication.
1.4. Danger to Aviation
But now a completely new item is being added to the long series of mishaps that Katla can cause. The big Katla eruptions are estimated to be VEI 5 (Volcanic Explosivity Index) [10]; this is far greater than Eyjafjallajökull who barely made VEI 4. In practice this means that Katla is capable of producing 10 times more tephra than Eyjafjallajökull did. Geological evidence shows that this has happened. Volcanic ash from a Katla eruption 10,000 - 11,000 years ago was found in several places in Europe and the Atlantic Ocean [1]. A Katla eruption could therefore force the civil aviation authorities to close the airspace over the North Atlantic and Europe once more, and this time for a good reason. The cost of such an incident for the aviation industry runs in billions of dollars [11] according to the 2010 experience.
From this account it is clear that a Katla eruption may call for a complicated civil protection program that involves massive evacuations where vehicles and manpower are needed by the hundreds. Such an operation in civil protection will not happen without proper preparation and planning. In Iceland, the planning task, as well as the coordination of field operations, is the responsibility of the police force. This system is briefly discussed, both the practical plan and the probability for the rate of success.
2. PROBABILITY OF KATLA ERUPTIONS
The mathematical problem is to find the probabilities of eruption in each crater location that have the greatest likelihood for producing the eruption timeline on record. The eruption jumps from one location to another, with a clear persistence to stay in the same place in the pattern. An eruption in one location has two possible places to go, or to stay in same place. There are therefore two probability values, to be determined for each crater location, and they together give the residual probability, the likelihood for the eruption to stay in the same place. These probabilities are treated as system constants independent of time. They are shown in the Figure 1. The probabilities are based on a simulation, where the simulated eruption history was compared to the actual. From the statistical point of view, the stochastic process is stationary. In practice it is not known if such system probabilities, as Figure 1 shows, are really constant in time.
But they are probably not constant on the geological time scale. That is however unimportant when hazard assessment is concerned, what we need to know, are the probabilities of events in the near future, for instance in the economic lifetime of the infrastructure system. That may be 25 - 60 years, different for different components in the infrastructure system. If the system probabilities change for the next 100 - 1000 years is not the issue, even when we are discussing events that happen with a return period of 1000 years, it is the probability of occurrence in the next year that is the issue.
The use of probabilities in hazard assessment depends on the decisions of local authorities. Events that are in principle life threatening, but usually pass without harming anyone, like earthquakes or rock fall on roads in Europe may have a design return period of 300 - 700 years. Accidents with certain fatal outcome for the victims, like large dam break floods in populated areas, usually have a design return period of 20,000 - 100,000 years. It is the trend today that planning and hazard assessment is to be probability based, but local authorities do find it difficult to do so without governmental support and external guidance. Such planning can be very complicated, it is necessary to analyze all probabilities for failure of evacuation means and subsequently do total risk analysis, [12,13], and the result may have, more often than not, to comply with governmental regulations without adequate funding to do so.
In the forthcoming the data for such analysis, and the risk functions for the three locations will be discussed.
3. JÖKULHLAUP TO THE EAST
The experience and eye witness records available for very large jökulhlaups is from the Katla eruption 1918. The accounts are to cite, but in short, they are in [4] and [14] and papers cited there. Here it is only necessary to state that the translatory flood behavior is supported by eye witness accounts and reassessment of Tomassons original estimate (peak flow up to 300.000 m3/sec and an effective duration of 6 hours [6]) has not changed his results significantly. It is also worth mentioning, that a peak flow of 100.000 or 300.000 does not make all the difference for the state of emergency. Both floods will be translatory waves and fill up the same flood plain.
The eastern flood plain, Mýrdalssandur, is uninhabited for the most part. A small group of framers is living in Álftaver, which is in the middle of the plain. That Álftaver was not taken by the 1918 flood is probably due to the property of a translatory wave to collect all floating debris in the front wall, and push the debris heap ahead of the main flood. Such a debris heap is mainly ice fragments, if they strand somewhere they form an obstacle that diverts the flow and become quickly a kind of a protecting ice dam filled with sediments. Some hills and pseudo-craters on the north side have provided considerable protection from many of the floods from Katla by this process. The ice melts away by time, but leaves a kind of moraine in the place where it stopped, sometimes and sometimes not. Remnants of such moraines can be found several places in the flood plain. The fluid mechanics of such ice dam build up are not properly understood so their formation cannot be predicted.
Figure 2 shows the probability of Katla eruptions. Average interval is 49 years. In 2004 there was an unsolved uncertainty if the average interval from an eruption of 1918 size to the next one was 73 or 95 years. The difference in probability was not great, but as the 95th years passed 2013, so it has been decided to put more weight on the 95 years estimate and the 73 years curve is not shown in Figure 2.
The maximum probability is having the next eruption after 40 years, but then there is a long tail. There is 90% probability for the next eruption within 100 years. As 95 of them have already passed and there has been no eruption, it is interesting to see a reassessment of the probabilities for an eruption after 2013. It is in Figure 3, showing a large difference in probabilities for the 95 years case (Next95) and the 49 years case (Next49). This curve gives a 90% probability for an eruption within 10 years, but this changes into 17% in the (Next95) curve, and this is an increase of only 2.5% in the 10 years elapsed since 2004 and the probability is still not more
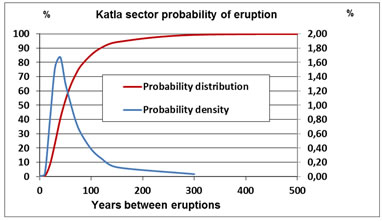
Figure 2. Probability of interval length between eruptions in Katla.
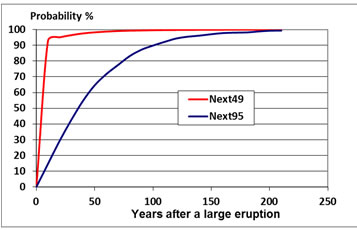
Figure 3. Reassessment of the probability of the next eruption after 2013.
than 60% for an eruption within 50 years. The old lady is still keeping her secrets.
4. JÖKULHLAUP TO THE WEST
A jökulhlaup from the En—sector, having the Icelandic name Enta, is a very dangerous event because the greatest part of inhabitants in the Markarfljót valley will be in danger and numerous lives will probably be lost if the evacuation plan does not work.
The flood has been simulated, using the same hydrograph as in the east. The critical time is when the flood hits the road ([8] Figures 3, 4 and 5 and Table 3) with a 6 - 7 m high wall of water progressing at a velocity 3 m/s; and thereby closes the escape route from the farms on the seaside of the road. This happens 3 hours after the onset of the flood. This is a very short time to get the evacuation going and complete it, but how early a warning it is possible to count on is not known with any certainty. On the seaside of the road there is no high ground as a second choice escape. The country is not totally flat, and further research effort might be able to locate some mounds where a protective ice dam has the possibility to form like in Álftaver, and such sites could be used in case of an evacuation failure.
However, on the other side of the road inside the valley, warning time is even less, but various possibilities for an escape to higher ground. To make it 20 - 30 meters uphill is sufficient.
Figure 4 shows the interval statistics. Average interval is estimated 500 - 800 years. The time scale is totally different from Katla, indicating high grouping tendency of the eruptions. That the probability peaks in about 100 years tells the same story. However, it must be noted that these floods are very few in the eruption history and there is considerable uncertainty about the occurrence of these floods, except the larger ones that have left clear geological evidence on the surface. However, it must be noted that the last flood of this type happened in 740 or almost 1300 years ago, and should come again within 1300 years with 85% probability, so preparations in the civil defense sector against a flood of this type are well justified. That the 1300 years are almost gone has the same effect as in the Katla case. 50% - 60% probability for another flood is likely to be 400 - 500 years.
5. JÖKULHLAUP TO THE SOUTH
The probabilities for a jökulhlaup from the Sólheimar site have an interesting feature very rarely seen in the study of flood recurrence periods. To begin with, the maximum probability is only 50 years, and after that, the probability distribution function is almost linear up to 4000 years as may be seen in Figure 5. This means that an eruption that does not come quickly again due to the grouping tendency, i.e. the eruption has moved to another sector, the next eruption has an equal probability to occur anywhere within the next 4000 years. What happens after that is just another of the old lady’s secrets.
The average eruption interval is 600 years.
6. TSUNAMI DANGER
There is no historical account of any serious tsunami after a Katla eruption. But there are stories about some strange waves coming to the shore. The flood will undoubtedly create a high wave, but in open water the wave energy spreads radially outwards in planar space with
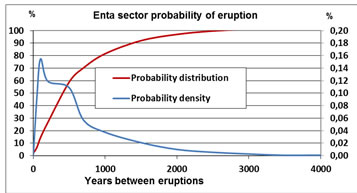
Figure 4. Probability of interval length between eruptions in Enta, 2004 simulation.
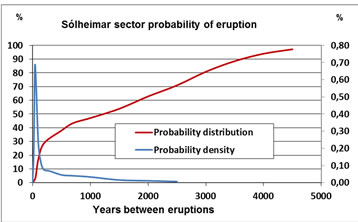
Figure 5. Probability of interval length between eruptions in Sólheimajökull.
more than 180˚ angle opening so the wave height attenuates quickly.
A hydrodynamical assessment was done in [9] and resulted in a 3 m high wave that could hit Vestmannaeyjar, the most vulnerable place, if an Enta eruption occurred. This could do serious damage if it occurred during high tide. During low tide very little would happen. The probability of occurrence of such a tsunami is less than 0.00001, this can be deducted from the simulations behind Figure 4.
However, this does not tell the whole story about the tsunami risk in Vestmanneyjar or in south Iceland in general. Even though the North Atlantic is very peaceful when tsunamis are concerned, it contains a number of tsunami sources [15]. That assessment showed a tsunami risk in a reference point near Vestmannaeyjar very close to the green curve in Figure 6. A recent study of the uncertainty of this estimate, especially the effect of the coefficient of variation (standard deviation over average), has clarified how this statistical estimates is affected by the fact that the average is much better determined than the standard deviation. This causes a surprising drastic increase in the probability of occurrence of the 3 m wave, while smaller and bigger events are much less affected, see Figure 6, green, black and red curve. The risk approaches the extreme vale distribution curve of Gumbel type when the standard deviation approaches the average (Cv full). This result covers all the tsunami sources in the North Atlantic, but due to the proximity of Katla, 50% of the probability mass is from there. The result of this discussion is that the risk of a dangerous tsunami on the Icelandic South Coast (Vestmannaeyjar and vicinity) cannot be ruled out due to uncertainties in the data as the coefficient of variation cannot be properly estimated, and the damage will largely depend on the phase of the tide.

Figure 6. Probability of a tsunami in Vestmannaeyjar.
7. VOLCANIC ASH AND AVIATION
The 1918 eruption produced an enormous plume of volcanic ash [1]. The fallout of ash from such a plume is known to be very dangerous. But recently the economic loss that can be inflicted on the aviation industry by such plumes, was made clear to the world by the old lady’s little sister Eyjafjallajökull in 2010 [11]. It must be noted however, that very few are blaming the mountain for all that havoc.
Volcanic eruptions are very frequent in Iceland. As the country is the sole provider of dangerous volcanic ash incidents in Europe, it would be of great interest if the probability of the next eruption capable of disrupting aviation in Europe on the 2010 scale can be estimated. Far from all historical eruptions in Iceland did have the disruptive power experienced in 2010 and 2011 [16], but Katla certainly has. Iceland has about 30 active volcanic systems, of which 13 have erupted in historical time. 46 eruptions are counted in 1901-2000 [17], and it is possible that 16 - 20 of these would have disrupted air traffic if the volcanic ash cloud prediction system [15] had been operational in that time.
A detailed probability estimate for historical eruptions in the 30 volcanic systems does not exist. Instead the 16 - 20 events mentioned above are counted as belonging to the 5 regions, or subsystems, shown in Figure 7. Two of them are named after Hekla and Katla, and then there is Vatnajökull and finally the North and the South. The North covers the area north of Vatnajökull; the South covers the south-west region of the country and eventual submarine events in the south and the west. VAAC [18] predictions have been issued for two of them, Eyjafjallajökull in 2010 [11], and Grimsvotn 2011, both causing airport closings.
For the sake of clarity we will define two classes of volcanic events according to their capability to disrupt air traffic. The first and lesser one is an eruption creating a plume that is clearly visible (concentration 2 mg/m3 or more [19]) up to 600 - 800 kilometers downwind, but
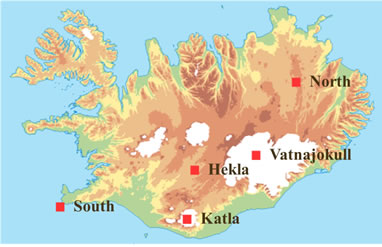
Figure 7. Likely eruption regions.
do not reach 1000 km, let’s call this class of eruption an EYF eruption.
If the visible plume length exceeds 1000 km, it is bigger than Eyjafjallajökull on the VEI scale. This class or eruptions will be called KAT eruptions. Both names are in the honor of the old lady and her little sister. Some airports in Europe would have to close; exception is a short eruption when the wind is straight to the north the whole time, a rather unlikely event. KAT eruptions are a small part, or a ratio of the EYF eruptions, their probability is estimated in the range 10% - 50% of the total EYF probability mass in any region.
Table 1 is compiled from this data by constructing first an average estimate for the probability of an EYF eruption in every subsystem. The last two columns in Table 1 contain the probability of an EYF class eruption in next year and a KAT class eruption within the next 5 years, somewhere in the whole system.
Finally there is a calculation of the probability of an EYF class eruption next year, anywhere in the whole system, which can disrupt air traffic. These are approximately the sum of the probabilities in the subsystems.
The result is very interesting. EYF eruptions have a 15% probability of occurring next year. Since 2000 there are most likely 3 of them and during the two last ones, Eyjafjallajökull 2010 and Grímsvötn 2011 the volcanic ash cloud prediction system was operational and closing of airports in Europe that all could have been avoided, was frequent. Here it must be added however, that the total panic of the first two weeks of the 2010 event will probably never be repeated in any case.
It is estimated that airport closings can be avoided in Europe outside Iceland in an EYF class event, i.e. with proper monitoring from satellites and airborne measurements of ash concentrations. Volcanic ash cloud predictions do not yet have the necessary quality to prevent unnecessary airport closings. It costs a million Euros per day to close an international airport, and the risk of such an event must not be predicted too high.
The last column in Table 1 is the risk of a KAT class eruption within the next 5 years. This is 17%. The interesting thing is that Katla and Hekla have a high weight in this number, but low weight in the 15% probability for an EYF class eruption next year.
It is very important in mitigation of the aviation hazard that the class of eruption is determined as quickly as possible after the event is on. It takes the plume 2 - 3 days to reach Europe and in this time it is possible to find out if it is disintegrating into thin transparent clouds or moving on. If it moves beyond 800 km without any sign of disintegrating, Europe can prepare for having to close its airports.
8. THE CIVIL PROTECTION SITUATION
Katla is a major concern of the Icelandic civil protection system. The system is rather unusual as there is no army in the country that can step in with short notice with its manpower and equipment. The system operates under the Ministry of the Interior with its command structure arranged through the office of the National Commissioner of the Police, Figure 8. Planning of preparedness is done in close cooperation with the local chiefs of police that are in charge of commanders and coordinators in the field. This work is by police authority
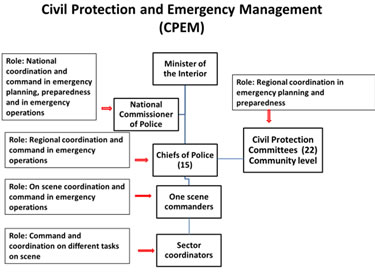
Figure 8. The civil protection management system in Iceland.
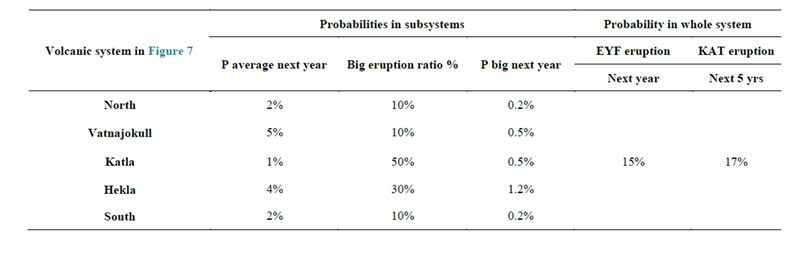
Table 1. Probabilities of any eruption and big eruptions in the systems.
which is a great advantage, as the people have great trust in the police force in Iceland. Another very popular force joins in the evacuation and rescue operations and assists the police. This is a rescue organization of volunteers, expert trackers and mountaineers, which enjoy immense popularity in the country for their skills and quick response time to emergency calls.
This system, has prepared a comprehensive plan for mitigation in case of a Katla eruption. There are several stages in the plan. Figure 9 shows one of them, the preparedness plans for emergency centers and road closures established as soon as a crisis situation is confirmed.
The flood areas are clearly seen in Figure 9; look for the Icelandic name parts Entu, Sólheim and Kötlu. As previously stated, Landeyjar in the west is inhabited; Mýrdalssandur in the east is uninhabited except for Álftaver. Inhabitants in each threatened area are counted in hundreds rather than thousands, much depending upon the time of year, number of tourists and the holiday situation.
9. OVERALL ASSESSMENT OF THE HAZARD SITUATION
The open question is, will the preparedness plan work? It has one weak spot, which is early warning. Not that this point has been neglected, there are tons of geophysical instruments distributed on and around Mýrdalsjökull for seismic and optical monitoring, water flow and chemistry [20]. But, the old lady is still keeping her secrets, it has happened that considerable disturbances that are scientifically known to precede an eruption, have been observed in and around the mountain, but they have ended in deep silence and no eruption [21]. Sometimes these disturbances have created floods that damage bridges to the degree that many people are convinced that the disturbance was a “little” eruption.
When monitoring equipment in Iceland show unrest that could mean a volcanic eruption is on its way or local people simply report an eruption the standard procedure in Iceland and many other countries is to send out an airplane with an earth scientist on board to search for it. The scientist usually gives confirmation in a short time and the event is on, but there is no early warning.
This lack of early warning could be crucial. It takes the big floods in the east and the west only 2 - 3 hours to reach the road that crosses the floodplain, and once there, evacuation in areas south of the road becomes difficult as previously stated.
There is not very much hope that this problem can be solved in such a way that a secure early warning of say 6 - 12 hours can be established. Never the less, in view of that a massive information effort and evacuation training on site with participation of the general public, there is all reason to believe that all lives can be saved with a probability of failure 10−5 or better. In case of incidental operational failures, the experience of the floods in the east in the past, the fact that high ground is not far away in the west, people how miss the evacuation still have a chance.
However, the probability value remains to be con-
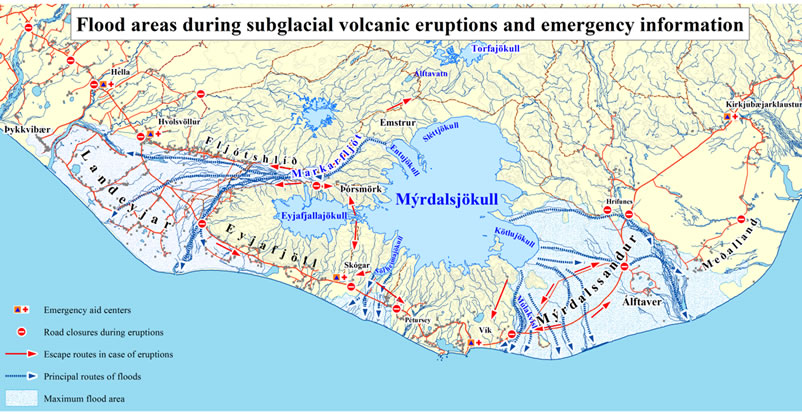
Figure 9. The hazard map of the civil protection system in Iceland.
firmed.
10. CONCLUSIONS
A Katla eruption can hit any of three sectors of the glaciated Mýrdalsjökull caldera. A jökulhlaup will be generated in each location, Katla in the east, Enta in the west and Sólheimar in the south.
Return periods of jökulhlaups in the east, west and south are 49, 500 - 800 and 600 years respectively found by stochastic simulation. Eruptions occur very irregularly. All sectors are well past this return period.
The next eruption in Katla is most likely in the east; the probability is 17% within 10 years and 60% within 50 years.
A large Katla jökulhlaup will generate a tsunami that propagates along the south coast of Iceland and out to the sea. The ultimate height is estimated around 3 meters still above water level. The damage potential of this wave depends on the tidal stage, which is astronomically governed with about 2 meter range. Extensive damage is unlikely. Probability of occurrence next year cannot be estimated but is likely to be around 0.0001 for the 3 m wave.
A Katla eruption is likely to cause disruption of air traffic. A risk assessment for the country of two classes of eruptions, EYF and KAT, where KAT is an event when volcanic clouds reach Europe, shows 15% probability for an EYF eruption in the next year and 17% probability for a KAT eruption in the next 5 years.
EYF class eruption can be mitigated so airports in Europe (Iceland excluded) do not have to close. Without proper mitigation we will have the same situation as in 2010 and 2011. KAT class eruption will probably mean airport closures in Europe.
A Katla eruption is a high hazard and a high risk event capable of massive property destruction and loss of lives. The crisis management is extensively prepared by the Civil Protection Authorities in Iceland, the general public informed and emergency procedures trained. This plan has all possibilities of success that the weak spot is insecure about the early warning time.
REFERENCES
- Katla volcano (2012) http://en.wikipedia.org/wiki/Katla_volcano
- Katla volcano (2013) http://www.katla-volcano.co.uk/
- Geirsson, H. and Olafsson, H. (2009) Katla and Eyjafjallajokull volcanoes. In: Schomacker, A., Krüger, J. and Kjaer, K., Eds., The Myrdalsjokull Ice Cap, Iceland: Glacial Processes, Sediments and Landforms on an Active Volcano, 5.
- Larsen, G. (2010) 3 Katla: Tephrochronology and eruption history. In: Schomacker, A., Krüger, J. and Kjær, K.H., Eds., Developments in Quaternary Sciences, 13, Elsevier, Amsterdam, 23-49.
- Eliasson, J., et al. (2006) Probabilistic model for eruptions and associated flood events in the Katla caldera, Iceland. Computational Geosciences, 10, 179-200. http://dx.doi.org/10.1007/s10596-005-9018-y
- Tomasson, H. (1996) The jökulhlaup from Katla in 1918. Annals of Glaciology, 22, 249-254.
- Kjaran, S.P., Myer, E.M., Johannesson, T. and Sampl, P. (2009) 14 modelling of subaerial jokulhlaups in Iceland. In: Megaflooding on Earth and Mars, Cambridge University Press, Cambridge, 265-272. http://dx.doi.org/10.1017/CBO9780511635632.014
- Elíasson, J., Kjaran, S.P., Holm, S.L., Gudmundsson, M. T. and Larsen, G. (2007) Large hazardous floods as translatory waves. Environmental Modelling & Software, 22, 1392-1399. http://dx.doi.org/10.1016/j.envsoft.2006.09.007
- Elíasson, J. (2008) A glacial burst tsunami near Vestmannaeyjar, Iceland. Journal of Coastal Research, 24, 13-20. http://dx.doi.org/10.2112/05-0568.1
- Volcanic explosivity index (2012) http://en.wikipedia.org/wiki/VEI
- Consequences of the April 2010 Eyjafjallajökull eruption (2011) http://en.wikipedia.org/wiki/Consequences_of_the_April_2010_Eyjafjallaj%C3%B6kull_eruption
- Vinnem, J.E. (2007) Offshore risk assessment: Principles, modelling and applications of QRA studies. Springer-Verlag London Limited, London.
- Woo, G. (2008) Probabilistic criteria for volcano evacuation decisions. Natural Hazards, 45, 87-97. http://dx.doi.org/10.1007/s11069-007-9171-9
- Gudmundsson, M.T. (2005) Subglacial volcanic activity in Iceland; Chapter 6. In: Caseldine, C.J., Russell, A., Hardardóttir, J. and Knudsen, Ó., Eds., Iceland: Modern Processes, Past Environments, Elsevier, Amsterdam, 127- 151. http://dx.doi.org/10.1016/S1571-0866(05)80008-9
- Eliasson, J. and Sigbjörnsson, R. (2008) Re-appraisal of tsunami hazard in the North Atlantic Ocean: A case study for Iceland. The 14th World Conference on Earthquake Engineering, Beijing, 12-17 October 2008, 1-6.
- 2011 eruption of Grímsvötn (2012) http://en.wikipedia.org/wiki/Grimsv%C3%B6tn_eruption
- Eldgosaannáll Íslands (2012) (in Icelandic) http://is.wikipedia.org/wiki/Eldgosaann%C3%A1ll_%C3%8Dslands
- Volcanic Ash Advisory Center (2006) http://en.wikipedia.org/wiki/Volcanic_Ash_Advisory_Center
- Weber, K., Eliasson, J., Vogel A., Fischer C., Pohl, T., van Haren G., Meier, M., Grobéty, B. and Dahmann, D. (2012) Airborne in-situ investigations of the Eyjafjallajökull volcanic ash plume on Iceland and over North-Western Germany with light aircrafts and optical particle counters. Atmospheric Environment, 48, 9-21. http://dx.doi.org/10.1016/j.atmosenv.2011.10.030
- Sturkell, E., Einarsson, P., Sigmundsson, F., Hooper, A., Ófeigsson, B.G., Geirsson, H. and Ólafsson, H. (2010) 2 katla and Eyjafjallajökull volcanoes. In: Schomacker, A., Krüger, J. and Kjær, K.H., Eds., Developments in Quaternary Sciences, 13, Elsevier, Amsterdam, 5-21.
- Russell, A.J., Tweed, F.S., Roberts, M.J., Harris, T.D., Gudmundsson, M.T., Knudsen, Ó. and Marren, P.M. (2010) An unusual jökulhlaup resulting from subglacial volcanism, Sólheimajökull, Iceland. Quaternary Science Reviews, 29, 1363-1381. http://dx.doi.org/10.1016/j.quascirev.2010.02.023