Natural Science
Vol.4 No.7(2012), Article ID:20743,10 pages DOI:10.4236/ns.2012.47056
Thermal convection in ice sheets: New data, new tests
![]()
Earth Sciences and Climate Change, University of Maine, Orono, USA; terry.hughes@maine.edu
Received 22 May 2012; revised 24 June 2012; accepted 10 July 2012
Keywords: thermal convection; Antarctic Ice Sheet; climate change; rising sea level
ABSTRACT
Thermal convection in the Antarctic Ice Sheet was proposed in 1970. Demonstrating its existence proved to be elusive. In 2009, tributaries to ice streams were postulated as the surface expression of underlying thermal convection rolls aligned in directions of advective ice flow. Two definitive tests of this hypothesis are now possible, using highly accurate ice elevations and velocities provided by the European, Japanese, and Canadian Space Agencies that allow icestream tributaries and their velocities to be mapped. These tests are 1) measuring lowering of tributary surfaces to see if lowering is due only to advective ice thinning, or also requires lowering en masse in the broad descending part of convective flow, and 2) measuring transverse surface ice velocities to see if ice entering tributaries from the sides increases while crossing lateral shear zones, as would be required if this flow is augmented by convective flow ascending in the narrow side shear zones and diverted into tributaries by advective ice flow. If 1) and 2) are applied to tributaries converging on Byrd Glacier, the same measurements can be conducted when tributaries pack together to become “flow stripes” down Byrd Glacier and onto the Ross Ice Shelf to see if 2) is reduced when lateral advection stops. This could determine if thermal convection remains active or shuts down as ice thins. Thermal convection in the Antarctic Ice Sheet would raise three questions. Can it cause the ice sheet to self-destruct as convective flow turns on and off? Does it render invalid climate records extracted at depth from ice cores? Can the ice sheet be studied as a miniature mantle analogous in some respects to Earth’s mantle?
1. INTRODUCTION
Thermal convection was quantified in 1916 by J. W. Strutt, Third Baron Rayleigh [1]. Thermal convection is heat transport by mass transport. It occurs in Newtonian viscous fluids heated from below, which produces warm less-dense fluid beneath cool more-dense fluid. This is gravitationally unstable, and thermal convection “stirs” the fluid to produce a state of buoyant thermal equilibrium which transfers the warm fluid to rapidly rising convection currents along side boundaries of polygonal platform cells and the cool fluid to slowly sinking convection currents within the cells between these warm boundaries. If a horizontal current of advective flow is superimposed on a fluid heated from below, the platform cells will be elongated in the direction of advective flow and become linear rolls in which convective flow spirals in the direction of advective flow [2,3]. The possibility of thermal convection in Earth’s mantle as the driving force for moving crustal tectonic plates on Earth’s surface received great attention during the mid-century revolution in Earth sciences that became known as plate tectonics. Of those treatments, the one by Johannes Weertman [4] was of particular interest in assessing the possibility of thermal convection in the Antarctic Ice Sheet [5].
If thermal convection also occurs in polycrystalline solids, such as Earth’s mantle and continental ice sheets, the strong crystal anisotropy and temperature dependence of creep in these solids would make rising currents much narrower and faster than sinking currents in cells and rolls, compared to these currents in Newtonian fluids. For possible thermal convection in large ice sheets, past, present, and future, which are heated from below by geothermal and frictional heat, platform cells would be most likely along internal ice divides where advective flow is minimal and these cells would become rolls as advective flow increases downslope from high interior ice divides to low ice margins, usually converging on ice streams [5]. Ice streams are fast currents of ice that develop near ice-sheet margins and discharge most of the ice, much as large rivers discharge most precipitation over continents. Ice streams and rivers are supplied by numerous tributaries that drain vast interior areas. Figure 1 shows these tributaries supplying large ice streams that drain the Antarctic Ice Sheet today [6]. Are these tributaries the surface expression of underlying thermal convection rolls? That is the question addressed here. Answers to this question are also proposed.
The possibility of thermal convection in the Antarctic Ice Sheet gained attention in the 1970s after ice temperatures and densities were obtained in 1968 from a corehole drilled 2164 m to bedrock at Byrd Station (80˚S, 120˚W) in the center of West Antarctica [7]. The corehole data revealed a density inversion about halfway down that separated cold upper ice from warmer lower ice. These data allowed a Rayleigh number to be calculated, following the theory for initiating thermal convection in Newtonian fluids heated from below, and delivered a Rayleigh number Ra just above the critical value Ra* that allows thermal convection [8]. For thicker ice, common in Antarctica, the Rayleigh number would be significantly above critical. The Rayleigh number is a dimensionless measure of the rate of heat transported by mass transport of hot atoms (thermal convection) compared to the rate of heat transported by the thermal vibrational energy of atoms remaining in place (thermal conduction). Convection begins when this ratio attains a critical threshold that overcomes resistance to mass transport.
A section, Old Data, Old Ideas, reviews attempts over the past four decades to find conclusive evidence for thermal convection in the Antarctic and Greenland Ice Sheets. A section, New Data, New Ideas, presents a hypothesis that ice-stream tributaries are the surface expression of convection rolls in the Antarctic Ice Sheet, and new data showing these tributaries are ubiquitous and extend from ice divides to major ice streams. A section, Theory, examines the physical basis of the Rayleigh criterion for initiating thermal convection in ice sheets as transient creep that may become steady-state creep with a gravitational driving stress comparable to that for slow sheet flow and fast shelf flow in Antarctica. A section, Conclusions, discusses the implications of this kind of thermal convection in terms of ice-sheet stability, climate records stored in ice sheets, and thermal convection in Earth’s mantle.
2. OLD DATA, OLD IDEAS
Evidence for and against thermal convection in the Antarctic Ice Sheet was presented in the 1970s and 1980s. Many years ago, I asked Barclay Kamb, our most innovative field glaciologist (recently deceased), if he could design a field experiment that would unambiguously detect convective flow, if it existed. After some time passed he told me he couldn’t think of one. It has been a challenge to find convincing evidence, even though the theoretical case for convection seems compelling to me.
When radar sounding was first used in both East and West Antarctica, it produced columnar reflections suggesting rising convection plumes [9], but they were soon shown to be specular echoes unrelated to ice flow [10, 11]. In 1981, W. S. B. Paterson maintained that the most convincing evidence against thermal convection was undisturbed stratigraphic radio-echo reflecting horizons extending for hundreds of kilometers all over the Antarctic Ice Sheet [12]. However his figure to “prove” his point showed that an echo-free zone was equally widespread in ice below the probable density inversion, where thermal convection would scramble the ice and erase these horizons [13].
Local radar records from East Antarctica in 1982 showed internal reflecting horizons at two sites, one along advecting ice flow and one transverse to this flow [14]. Both had a lower echo-free zone. Higher ice had horizontal stratigraphy in the longitudinal record, but this ice was bent into a series of arches in the transverse record. Both records had rugged beds that didn’t conform with the radar records. These records might be produced by thermal convection rolls, with no distortion of radar reflections along rolls, but arching these reflections across rolls [13], see also Figure 4 and discussion in Ice Sheets [15]. Radar records generally did not show this arching pattern where conditions for thermal convection seemed to be equally favorable. Advances in radar-sounding technology now deliver reflecting horizons in the “echo-free zone” but these tend to be discontinuous and warped [16], conditions thermal convection might produce.
Theoretically, it was necessary to show how the Rayleigh criterion should be modified to allow thermal convection in crystalline solids such as ice, and not just in Newtonian fluids [1,17,18]. The first and only comprehensive theoretical paper promoting thermal convection in the Antarctic Ice Sheet [5] employed the Weertman [4] analysis of thermal convection in Earth’s upper mantle (the asthenosphere) using a two-dimensional “block model” of thermal convection that would apply to convection rolls in transverse cross-section. Polycrystalline solids with strong crystal anisotropy, such as mantle minerals and glacier ice, are suited to the block model because shear boundaries become sharply defined. The Weertman theory of thermal convection in polycrystalline solids produces convection rolls having a roll diameter about twice the roll depth [4]. Applying this to the Antarctic Ice Sheet, rolls would be 4 to 6 km wide for ice 2 to 3 km thick. Ice-stream tributaries typically have these widths and depths.
Because ice deforms near the plastic end of the viscoplastic creep spectrum, thermal convection might exist as ascending dikes in narrow shear bands that intrude horizontal ice strata as multiple narrow sills. A dyke-sill version of the block model was used to “explain” the spikiness of oxygen-isotope stratigraphy found below the density inversion in coreholes to bedrock for the Greenland and Antarctic ice sheets [19]. Spikes would be sills having a different isotope signature. Today this spikiness is attributed to Late Pleistocene environmental effects that may or may not be linked to conventional ice-sheet dynamics [20].
3. NEW DATA, NEW IDEAS
In 2009, a new perspective on how convective and advective flow could be linked [21] followed the 1976 suggestion that tributaries supplying major Antarctic ice streams are the surface expression of underlying convection rolls [5]. Figure 1 illustrates this new perspective. It is a most striking display of ice-stream tributaries on a full map of Antarctic ice flow using NASA technology to piece together satellite-sensing data from the European Space Agency (ESA), the Japanese Space Agency (JSA), and the Canadian Space Agency (CSA). Figure 1 was produced in the Earth System Science Department at the University of California, Irvine, and the Jet Propulsion Laboratory of the California Institute of Technology [6].
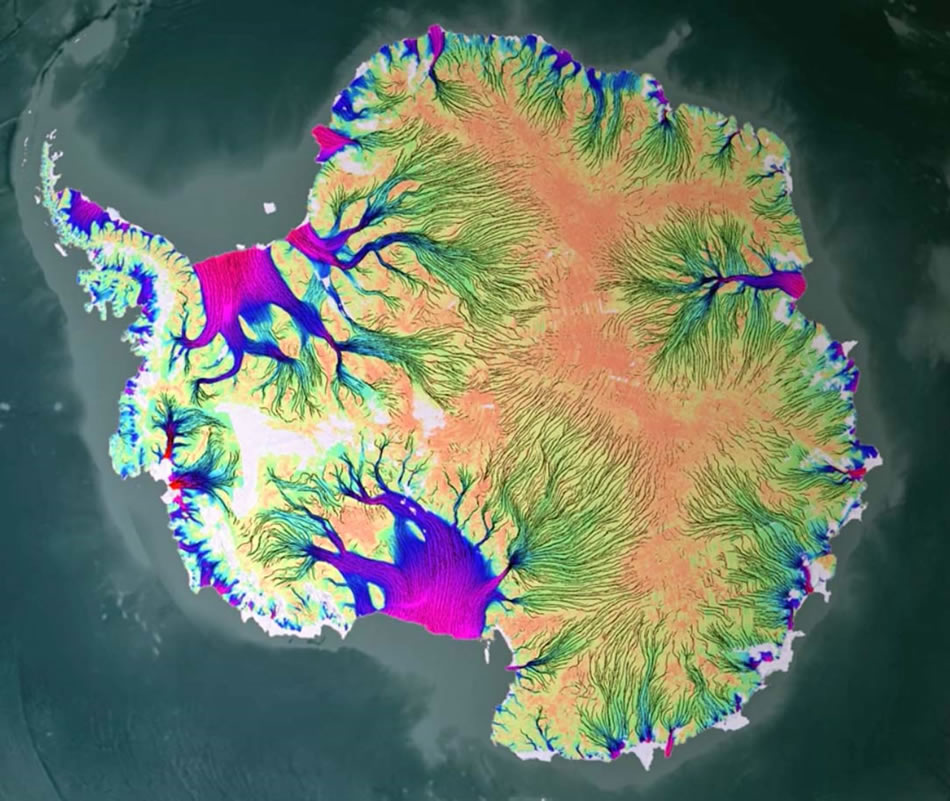
Figure 1. A full map of Antarctic ice flow showing tributaries supplying major ice streams. This map was compiled by NASA-funded research at the Jet Propulsion Laboratory of the California Institute of Technology and the Earth System Science Department at the University of California at Irvine, using data from Earth-orbiting satellites provided by the Japanese, European, and Canadian Space Agencies. Ice velocities increase from orange near interior ice divides to green in ice tributaries to blue in ice streams to red on ice shelves. A video showing motion of the tributaries is available on the NASA News website. Here we propose that ice tributaries are underlain by and driven by thermal-convection rolls aligned with surface ice flow. From NASA News, http://www.jpl.nasa.gov/ news/news.cfm?release=2011-256&cid=release.
Dozens of scientists from many countries contributed to this enterprise. If the new perspective is correct, Figure 1 shows that thermal convection is widespread in the Antarctic Ice Sheet.
Figure 1 shows that fast ice-stream tributaries are about 5 km wide and are separated by slower-moving ice that narrows from about 30 km in width near ice divides to zero width as tributaries pack together and enter major ice streams. These tributaries begin near interior ice divides and fill the ice drainage basins supplying major Antarctic ice streams. If ice-stream tributaries are the surface expression of underlying thermal convection rolls, Figure 1 is a map of thermal convection rolls within the Antarctic Ice Sheet. Thermal convection then exists throughout the ice sheet, being strongest at depth but also directing surface advective flow. Modeling advective flow superimposed on convective flow would require using all six deviator stresses, with all six stresses linked to strain rates [22].
Figure 2 is a Radarsat-1 image provided by the Canadian Space Agency [23]. It shows tributary ice streams that get packed together as they converge on Byrd Glacier to become “flow stripes” that continue onto the Ross Ice Shelf. If thermal convection rolls are aligned with these tributaries, do the rolls continue under flow stripes within the glacier and onto the ice shelf? This needs to be investigated. Flow stripes are not caused by lateral compression because Byrd Glacier generally widens as it
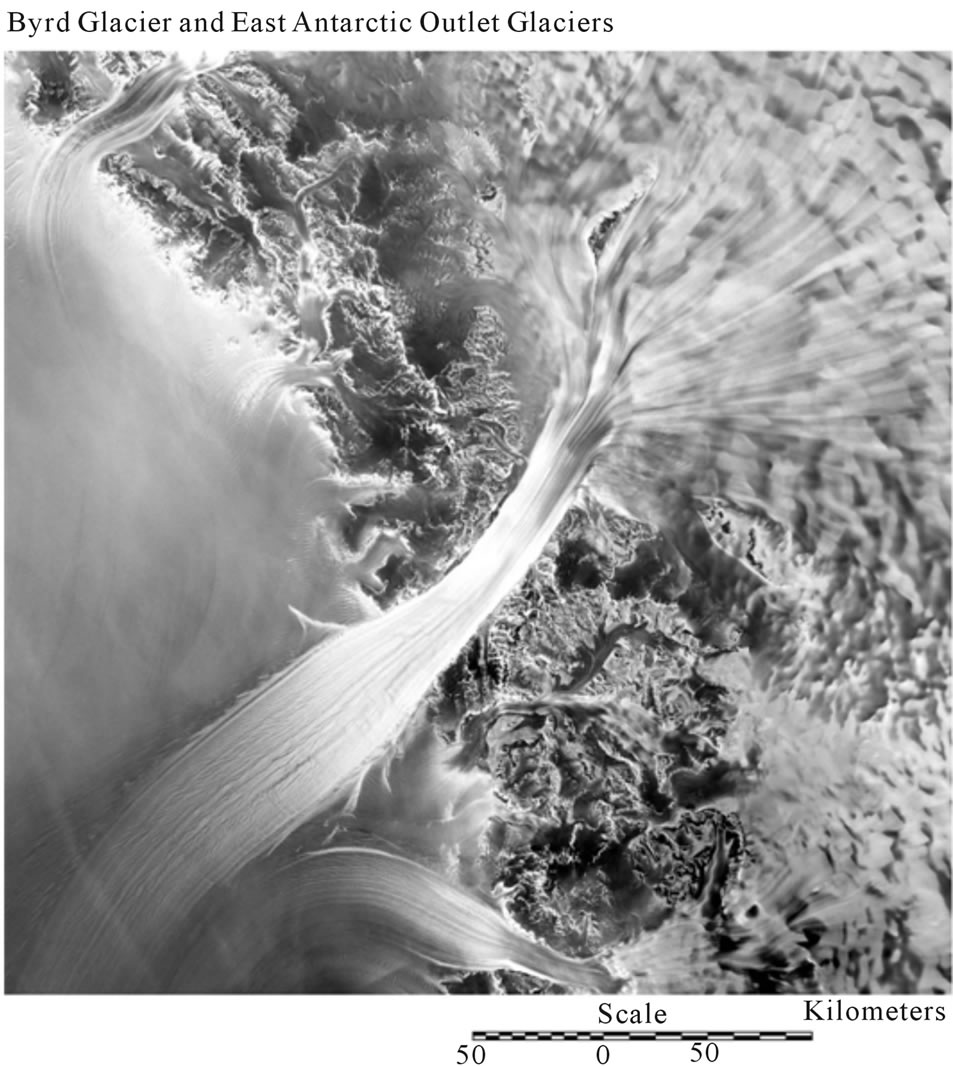
Figure 2. A Radarsat image of Byrd Glacier, including converging tributaries at its head and lateral rifts where it enters Ross Ice Shelf. The trace of tributaries continues on Byrd Glacier and onto the Ross Ice Shelf as flow stripes. From [21].
moves through its fjord, Barne Inlet, and enters the Ross Ice Shelf in Figure 2. Flow stripes may be slowly descending limbs of convection rolls, with faster rising limbs confined to narrow shear zones between flow stripes [21].
The suggestion that ice-stream tributaries are the surface expression of underlying convection rolls [5,21] is supported by temperature profiles obtained from hotpoint drilling to the bed, showing warmer ice in Whillans Ice Stream and colder ice in Ice Ridge B1-B2, informally called the “Unicorn” [24]. In between is a lateral shear zone, which would add warmer ascending convecting ice to advective ice flow from the ice ridge to the ice stream. Frictional heating and an “easy glide” ice fabric that facilitate both advective and convective ice flow are produced in the lateral shear zone [21,25]. Winter cold air sinking into crevasses made ice in the top 30 m of the shear zone colder than deeper ice [26].
Figures 1 and 2 suggest two field experiments to test whether ice-stream tributaries are the surface expression of thermal convection rolls: 1) tributary surfaces should lower faster than predicted by advective thinning if they are the sinking limbs of convection rolls, and 2) ice crossing lateral shear zones should move faster if it is augmented by ice in the rising limbs of convection rolls, see Figure 3" target="_self"> Figure 3. These experiments must be designed very carefully by both ice-sheet modelers and field glaciologists to make sure data are reliable and can constrain models. Deep drilling to get the full strain-rate tensor and physical properties to the bed will be required.
4. THEORY
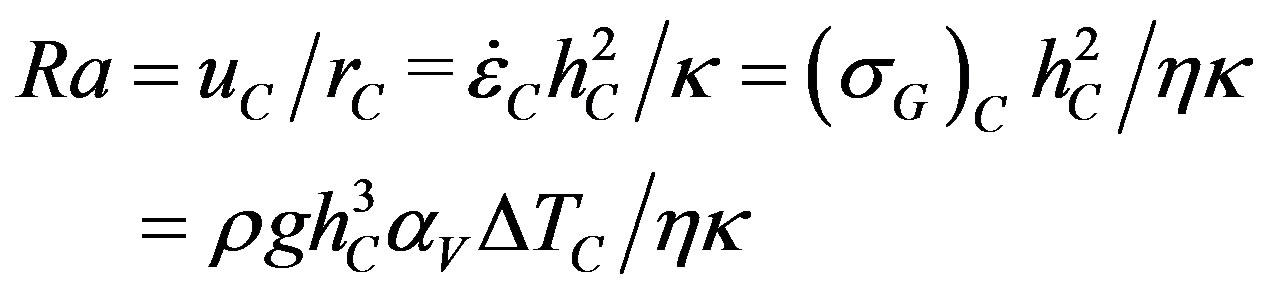
In the classic theory of thermal convection in a Newtonian fluid heated from below, steady-state convection begins when the Rayleigh number Ra attains a critical value Ra*, where Ra is defined as follows [1]:
 (1)
(1)
Here, 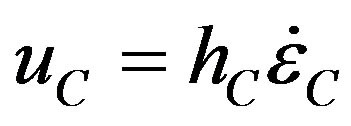 is the ascending velocity of thermal convection in an incompressible fluid layer of height hC where rC = k/hC is the ascending rate of thermal conduction, k is the thermal diffusivity in the fluid,
  is the strain rate for convective ice flow due to gravitational driving stress (sG)C = DrghC where density r decreases with depth by Dr = raVDTC due to thermal expansion from temperature increase DTC for volume coefficient of thermal expansion aV, and h is the viscosity of the fluid.
Superficially, it seems reasonable that thermal convection can begin when heat transported upward from convection and conduction are the same, so uC = rC and Ra* = 1 in Eq.1. However, thermal convection occurs when thermal buoyancy is attained, so temperature must be
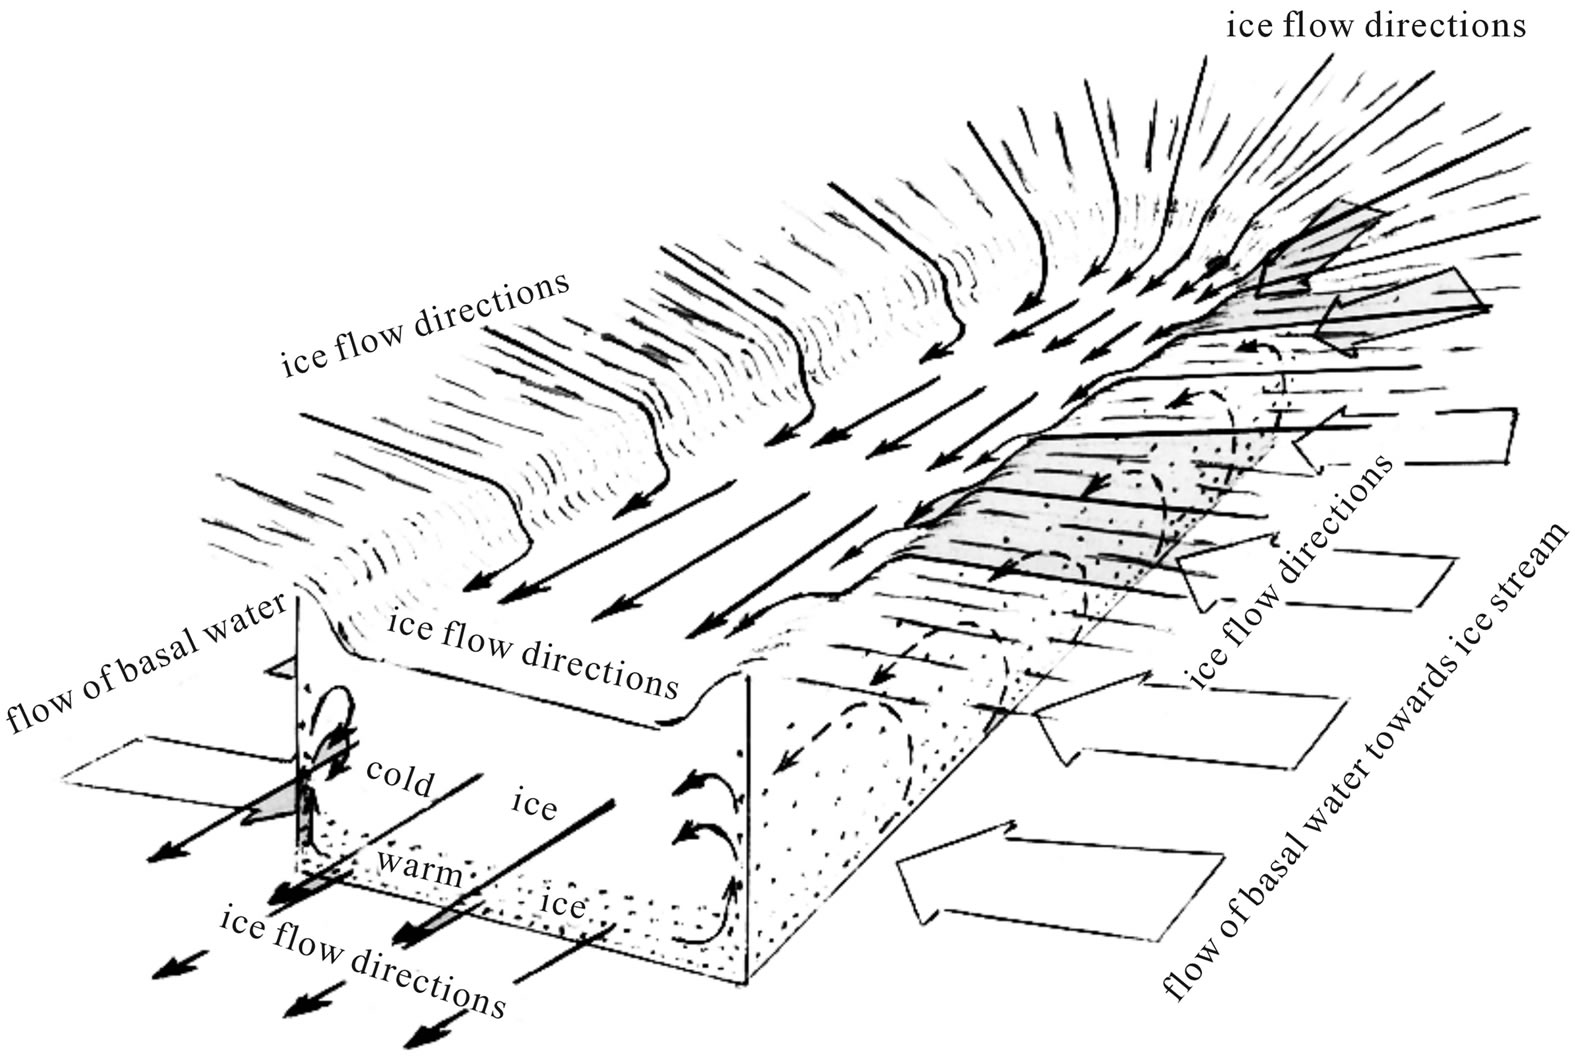
Figure 3. A cartoon showing how downslope motion of an ice-stream tributary is facilitated by rising convection curtains in its lateral shear zones, and by both ice and basal water advecting laterally into the tributary. Basal water crossing the shear zones uncouples ice from the bed below the tributary. Slow sinking convection flow occurs between the rising curtains and lowers the surface of the tributary. From [21].
included in the derivation of Ra*. The derivation requires a force balance that includes all stresses resisting sG see Figure 4, where . Therefore,
  when convection begins. Weertman [4] and Hughes [5] included temperature variations linked to extending and compressive deviator stresses, respectively, at the top and bottom of rising convection columns, and vice versa for sinking columns, with shear stresses at the boundaries of vertical columns and their horizontal extensions in Figure 4. Take Cartesian axes with x along advective flow, y transverse to flow, and z vertical, using deviator stresses
  with i, j = x, y, z in conventional tensor notation. For tributary ice streams partly decoupled from slow sheet flow by warm ascending convection flow in roll boundaries,
  is sC for compressive converging flow at the bottom and sT for tensile diverging flow at the top. For descending convection flow within rolls,
  is sC for compressive converging flow at the top and sT for tensile diverging flow at the bottom. For shear zones between vertical ascending and descending flow, syz is sS for side shear, with syz also between upper and lower horizontal convective flow in opposite directions. This force balance gives uC = 280 rC, so Ra* = 280 for Newtonian flow when these stresses are allowed to warp the top and bottom surfaces of convection rolls as shown in Figure 4.
The onset of thermal convection in Newtonian viscous fluids heated from below begins at critical Rayleigh numbers Ra* = 657 when unwarped top and bottom surfaces are free, Ra* = 1100 when one is rigid and one is free, and Ra* = 1708 when both are rigid [27]. In the Antarctic Ice Sheet, the first case corresponds to thermal convection from the bed to the surface, where low surface accumulation rates that put the density inversion near the ice surface coexist with a subglacial lake at the bed; the second case corresponds to either a density inversion far below the surface, so cold overlying ice is a relatively rigid upper boundary, or a frozen bed that provides a rigid lower boundary; and the third case corresponds to a density inversion at depth and a frozen bed,
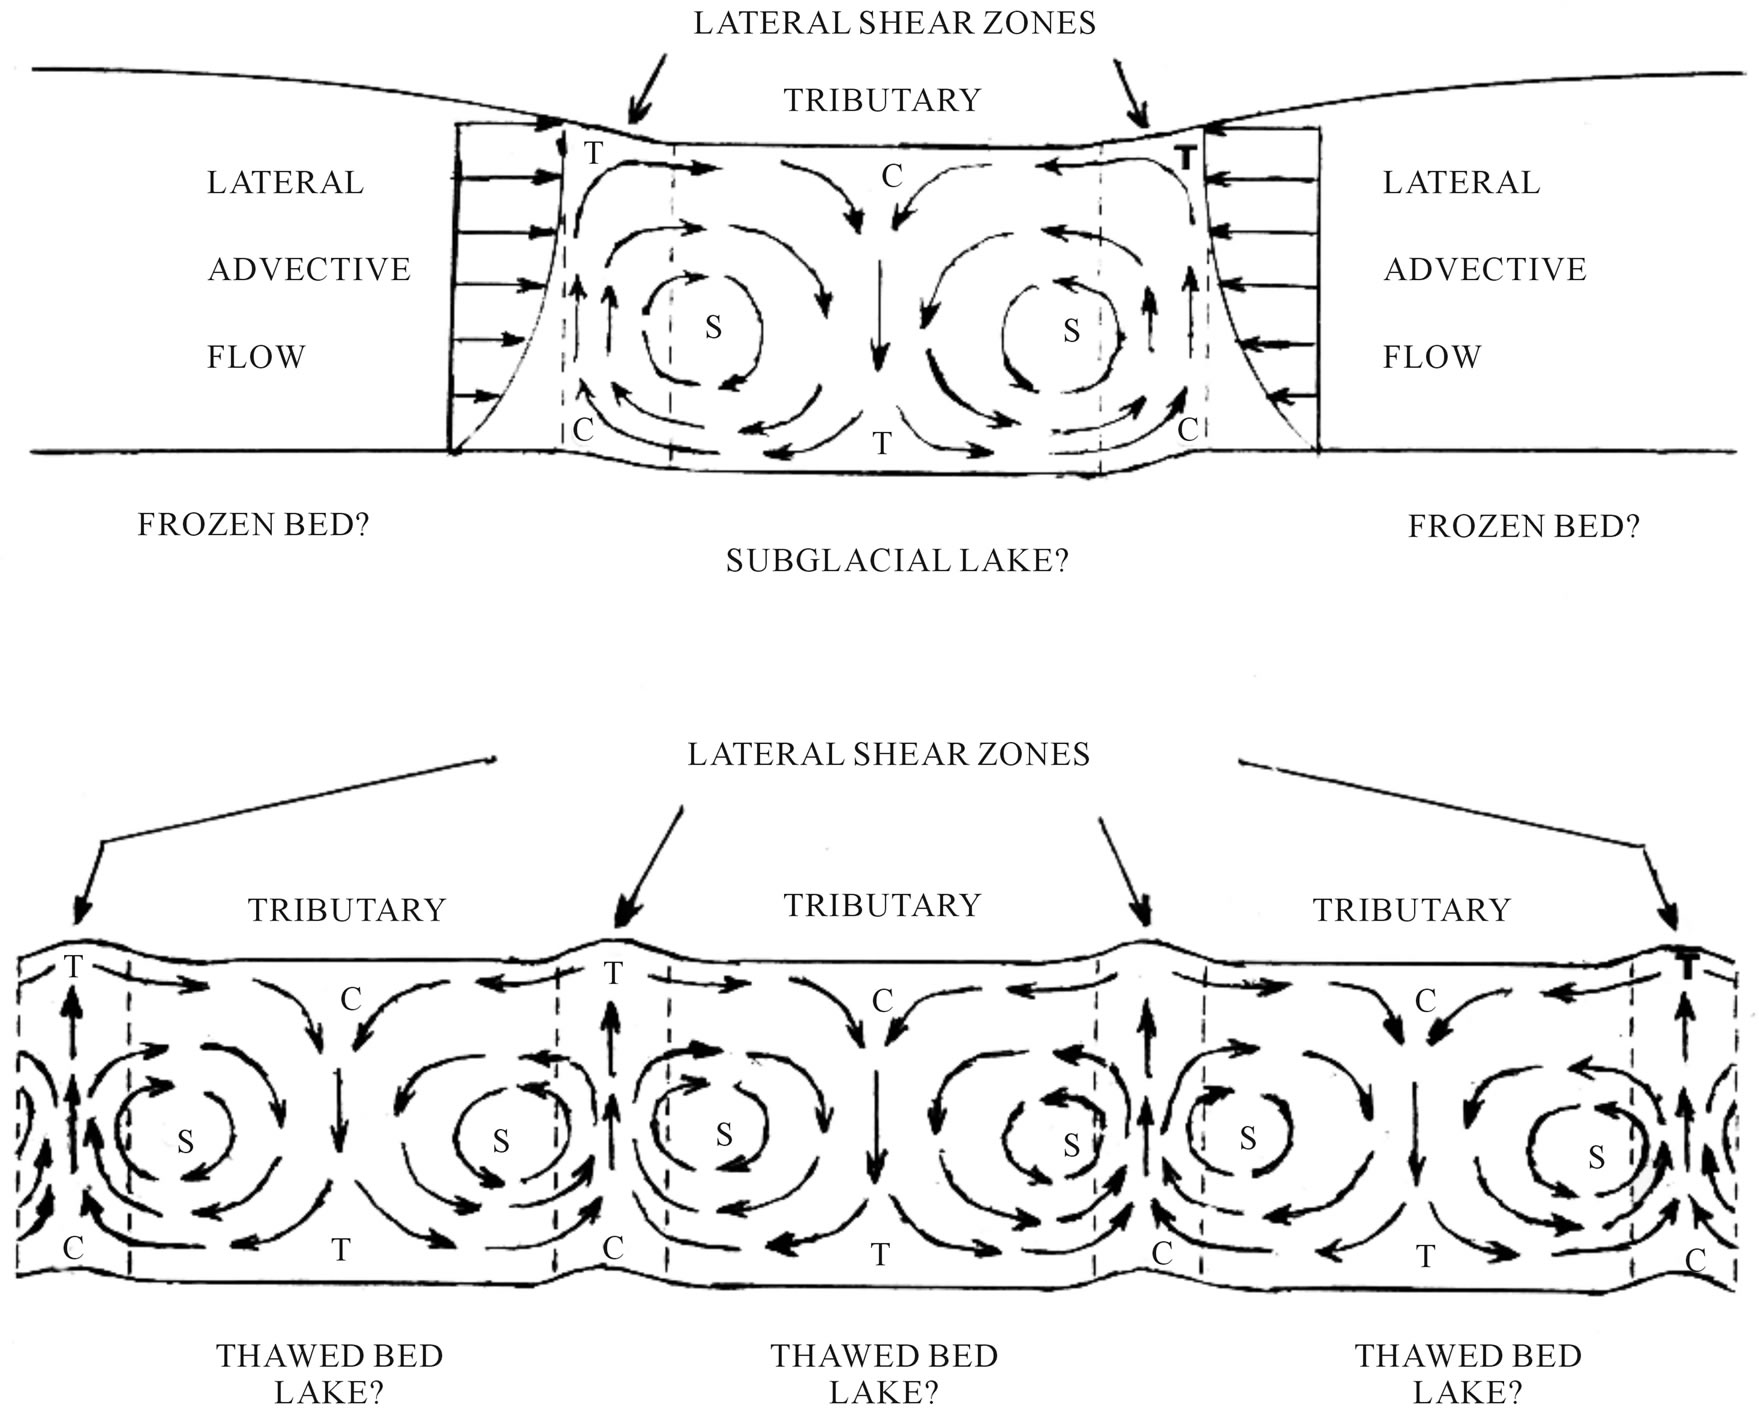
Figure 4. A cartoon showing thermal convection rolls in transverse cross-section beneath ice-stream tributaries. Letters T, C, and S show respective regions of tensile, compressive, and shear flow caused by convection. Top: For an isolated tributary, lateral advective flow moves down the side slopes into the tributary and augments convective flow into the tributary. Similar flow of subglacial water may produce a lake under the tributary. Bottom: Lateral advective flow stops when tributaries get packed together as they enter an ice stream.
both providing rigid boundaries.
Values of Ra* for initiating thermal convection in Newtonian fluids may not apply for polycrystalline glacier ice in which elastic deformation with an infinite strain rate becomes transient creep with a decreasing strain rate over time that stabilizes as slow steady-state creep independent of time until replaced after recrystallization by fast steady-steady creep, see Figure 5. Recrystallization from a hard-glide random crystal fabric to an easy-glide crystal fabric produced by simple shear begins at strain e » 0.1 for both applied stresses, and increases e by a factor of 12.8, from 1.88/a to 24.1/a for sC = 117 kPa at −3˚C. Relating  to gravitational stress (sG)C driving convective flow employs the flow law of ice [28] for both transient and steady-state creep combined to give creep strain eC as the sum of transient strain eT and steady-state strain eS:
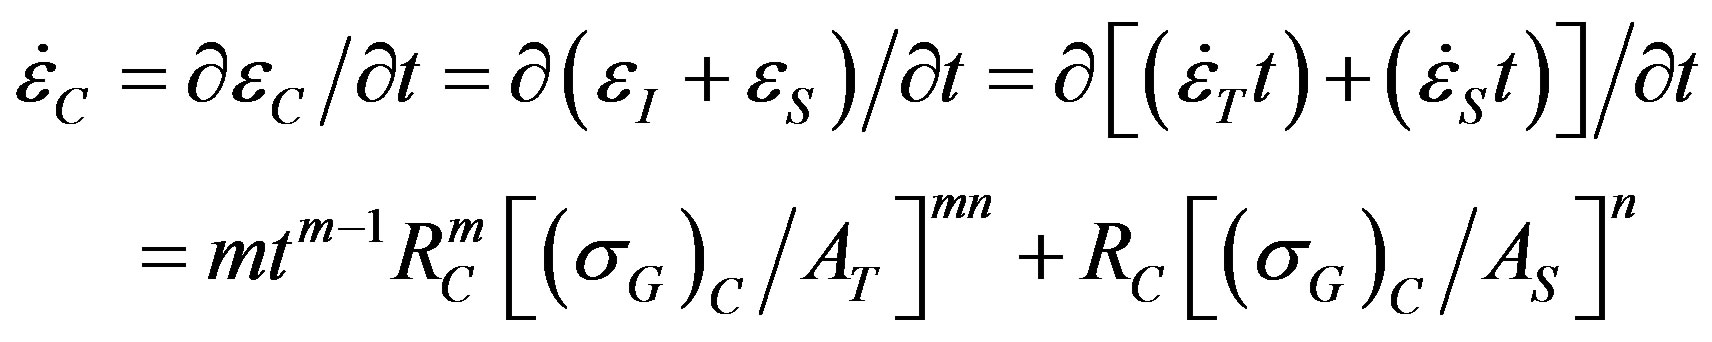 (2)
(2)
where t is time since thermal convection began, m =  for transient creep, n = 3 for steady-state creep, respective ice hardness parameters AT and AS are for ice fabrics and temperatures during transient and steady-state creep, and RC is a scalar that takes account of all strain rates associated with convective and advective ice flow [21]. Then Ra is:
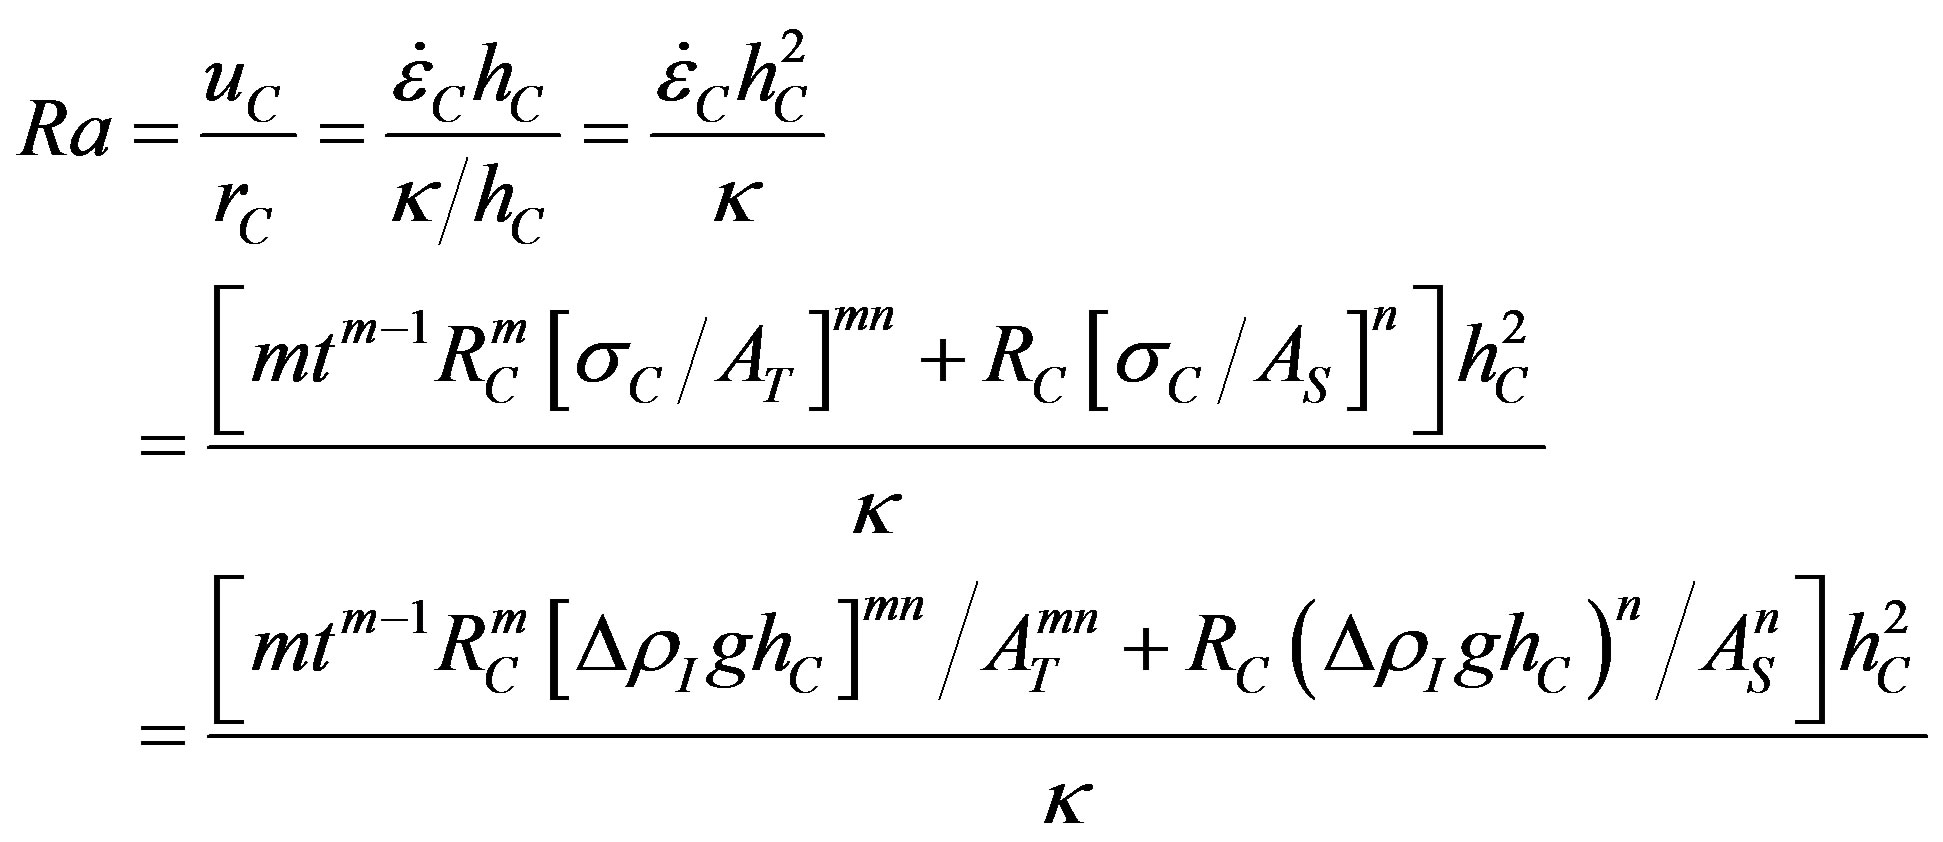 (3)
(3)
Note that Ra is infinite at t = 0, so there is no critical Ra* for initiating thermal convection in ice sheets. As t increases, transient creep is replaced by steady-state creep so Ra becomes finite and may fall below Ra* for ice sheets [5,21]. Transient creep does not exist in Newtonian fluids, so Eq.3 reduces to Eq.1 where m = n = 1 for Newtonian creep and h =AS /RC is the Newtonian viscosity, for which RC = 1. At Byrd Station in West Antarctica where sC = 13.7 kPa for hC = 1103 m below the density inversion about halfway down the corehole, RC = 3 for convection rolls, AT = 2.5 × 10³ kPa·a1/3, and AC = 140 kPa·a1/3 before recrystallization gives tC = 4.7 years as the time when steady-state creep overtakes transient creep. This shortens to tC = 0.2 years for AC = 59.8 kPa·a1/3 after recrystallization [21].
Gravitational driving stresses for sheet flow, convective
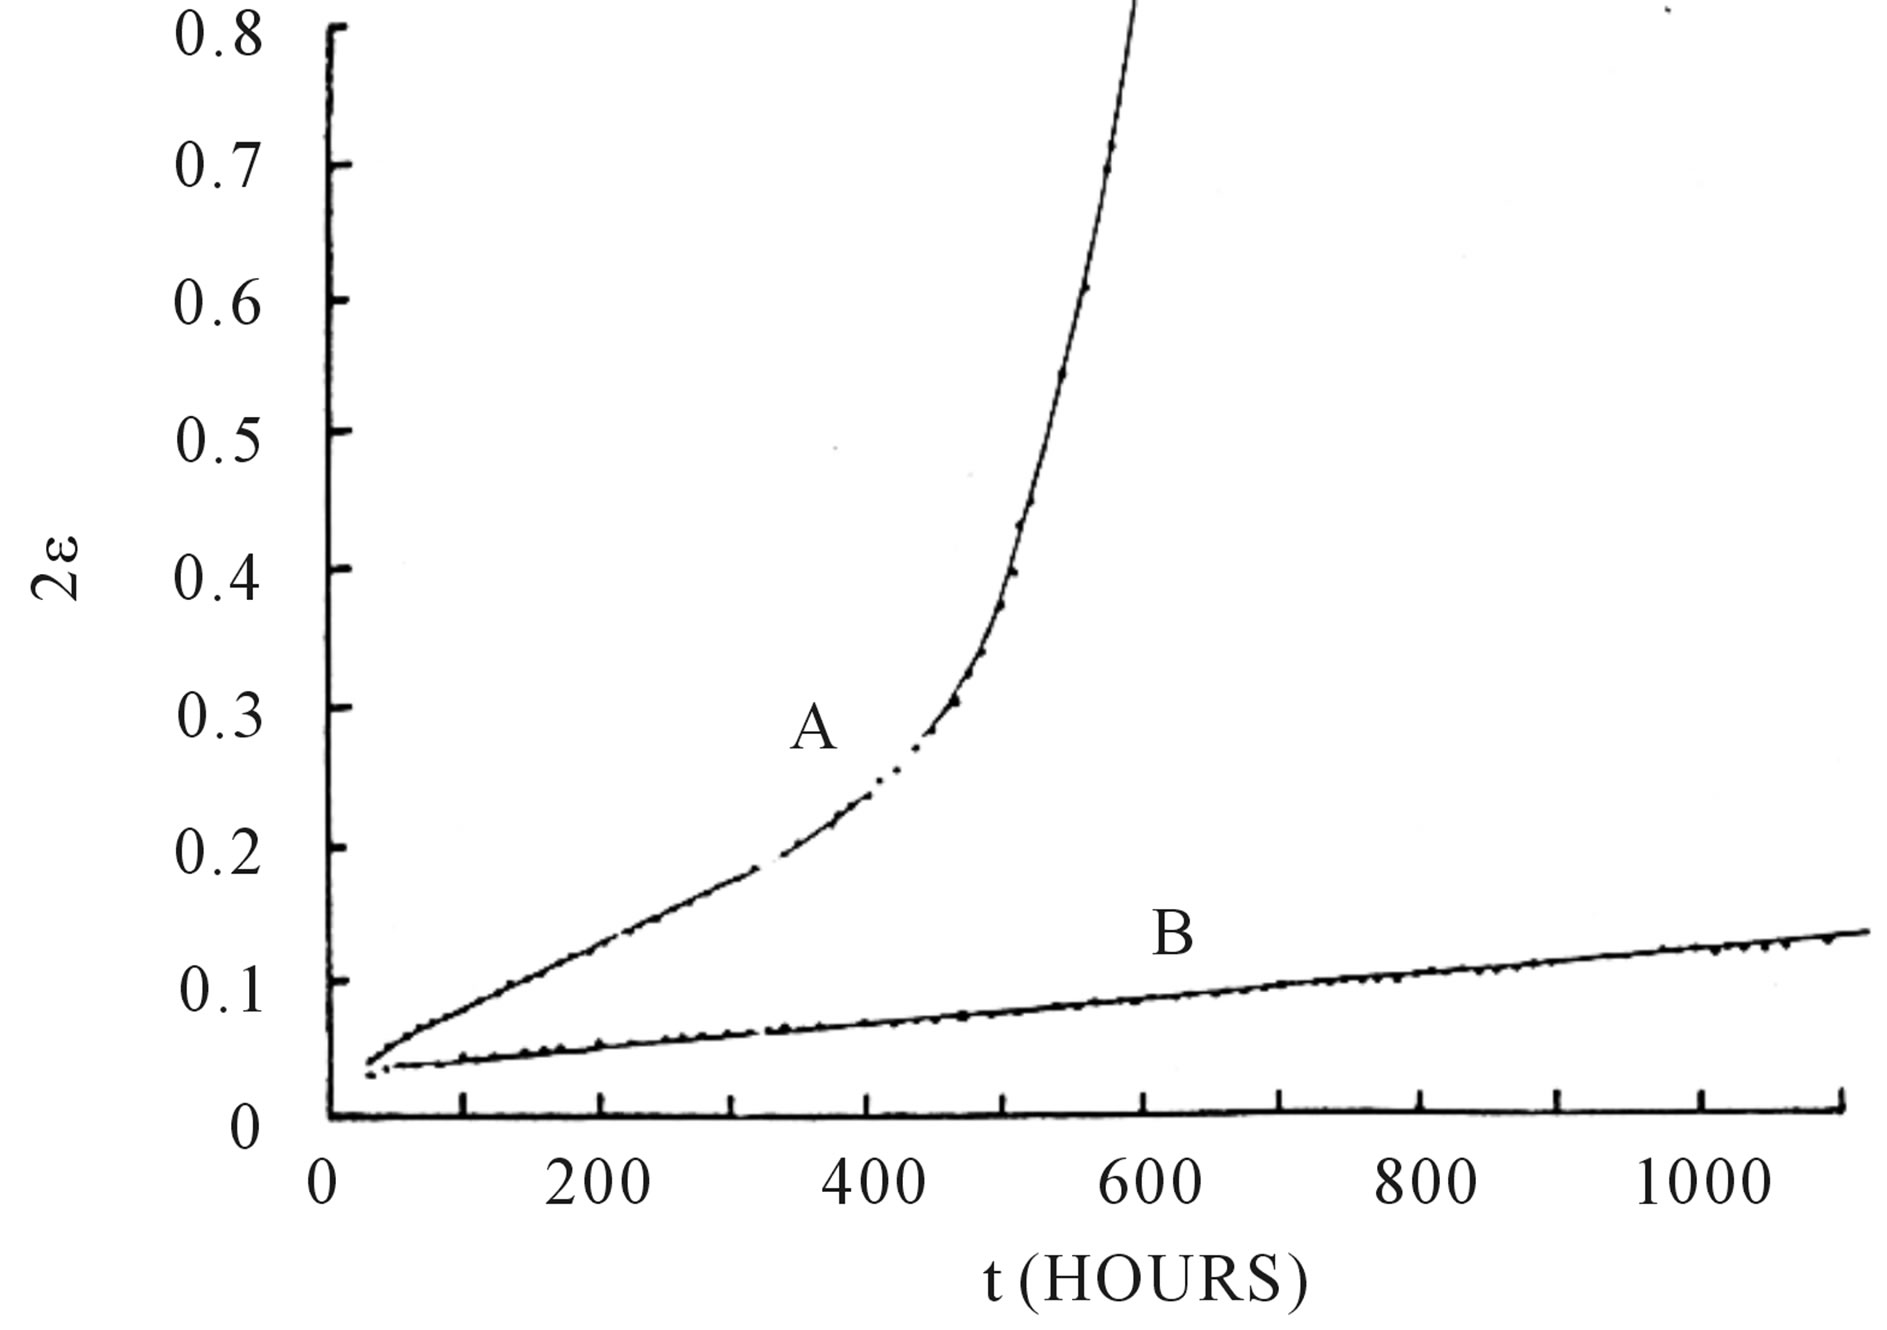
Figure 5. Creep curves for simple shear in polycrystalline ice at −3˚C for applied shear stresses of 117 kPa (curve A) and 55 kPa (curve B). Transient creep dominates for the first 50 to 100 hours of strain, depending on the applied stress. Recrystallization begins at about 20 percent strain. From [21]. Shear displacements dz were measured on planes normal to x, so ezx = 1/2 (¶dz/¶x + ¶dx/¶z) gives strain ¶dz/¶x = 2ezx. At 55 kPa, recrystallization would begin when 2ezx = 2000 hours, about 17 days.
flow, and shelf flow generally have comparable magnitudes. The gravitational driving stress (sG)A for slow advective sheet flow spreading along x from interior ice domes is linked to vertical shear stress  [21,29,30].
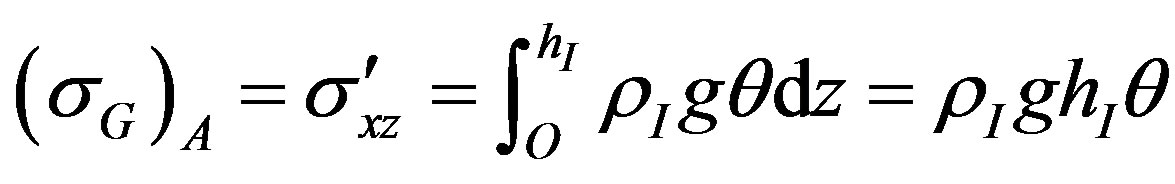 (4)
(4)
where hI is the ice thickness, q is the ice surface slope, rI is ice density and g is gravity acceleration. The gravitational driving stress (sG)C for convective ice flow in rolls along x is the vertical buoyancy stress  given by [21]:
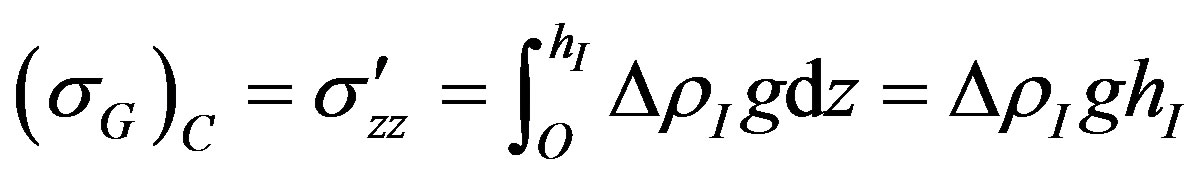 (5)
(5)
where DrI is the change of ice density in height hC below the density inversion. The compressibility of ice partly offsets thermal expansion of ice at depth, reducing DrI from 4.0 kg/m3 to 1.2 kg/m3 at Byrd Station. This reduces (sG)C from 45.0 kPa to 13.7 kPa for hC =  hI, compared to 45.6 kPa for (sG)A [21]. However this reduction is largely removed if hC ≈ hI, a situation that cannot be discounted when surface accumulation rates are low for slow sheet flow [31]. In fast stream flow, increasing temperature, hence decreasing density, begins close to the surface of Whillans Ice Stream in West Antarctica [24]. The two stresses in Eqs.4 and 5 are nearly identical if DrI ≈ rIq and hC ≈ hI. This is the case if tributary ice streams are the surface expression of convection rolls. Faster surface ice in these tributaries correlates with a wet bed that reduces ice-bed coupling, and hence reduces Ra* for convecting ice rolls. Ice-bed coupling vanishes when the floating fraction of ice beneath tributaries approaches unity. The gravitational driving stress (sG)F for freely floating ice along x is [29,30]:
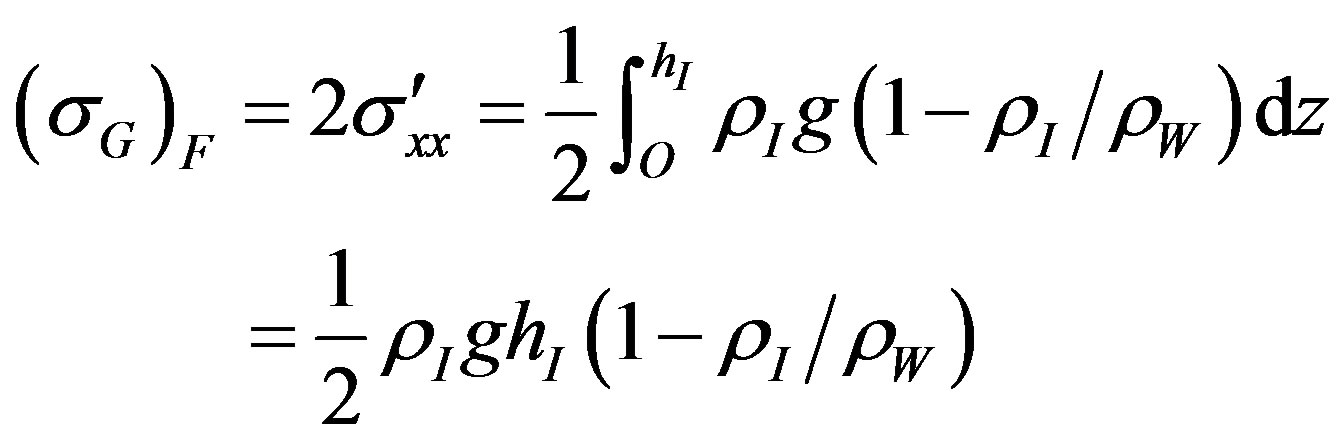 (6)
(6)
where rW is the density of water. Eqs.4 through 6 are all gravitational driving stresses having comparable magnitudes close to the yield stress of ice, but each one applies to a specific flow regime based on the strength of ice-bed coupling.
As seen in Figure 6, the flow law for both slow and fast steady-state creep before and after recrystallization can be normalized with respect to plastic yield stress sO = 100 kPa [12] at strain rate  as follows for 1 £ n £ ¥ in the viscoplastic creep spectrum:
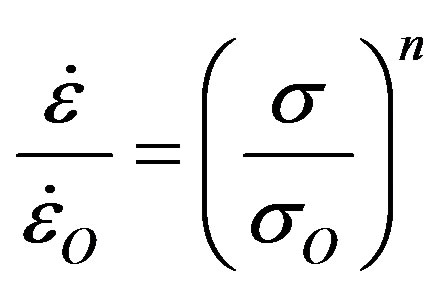 (7)
(7)
where n = 1 for viscous flow, n = ¥ for plastic flow, n =
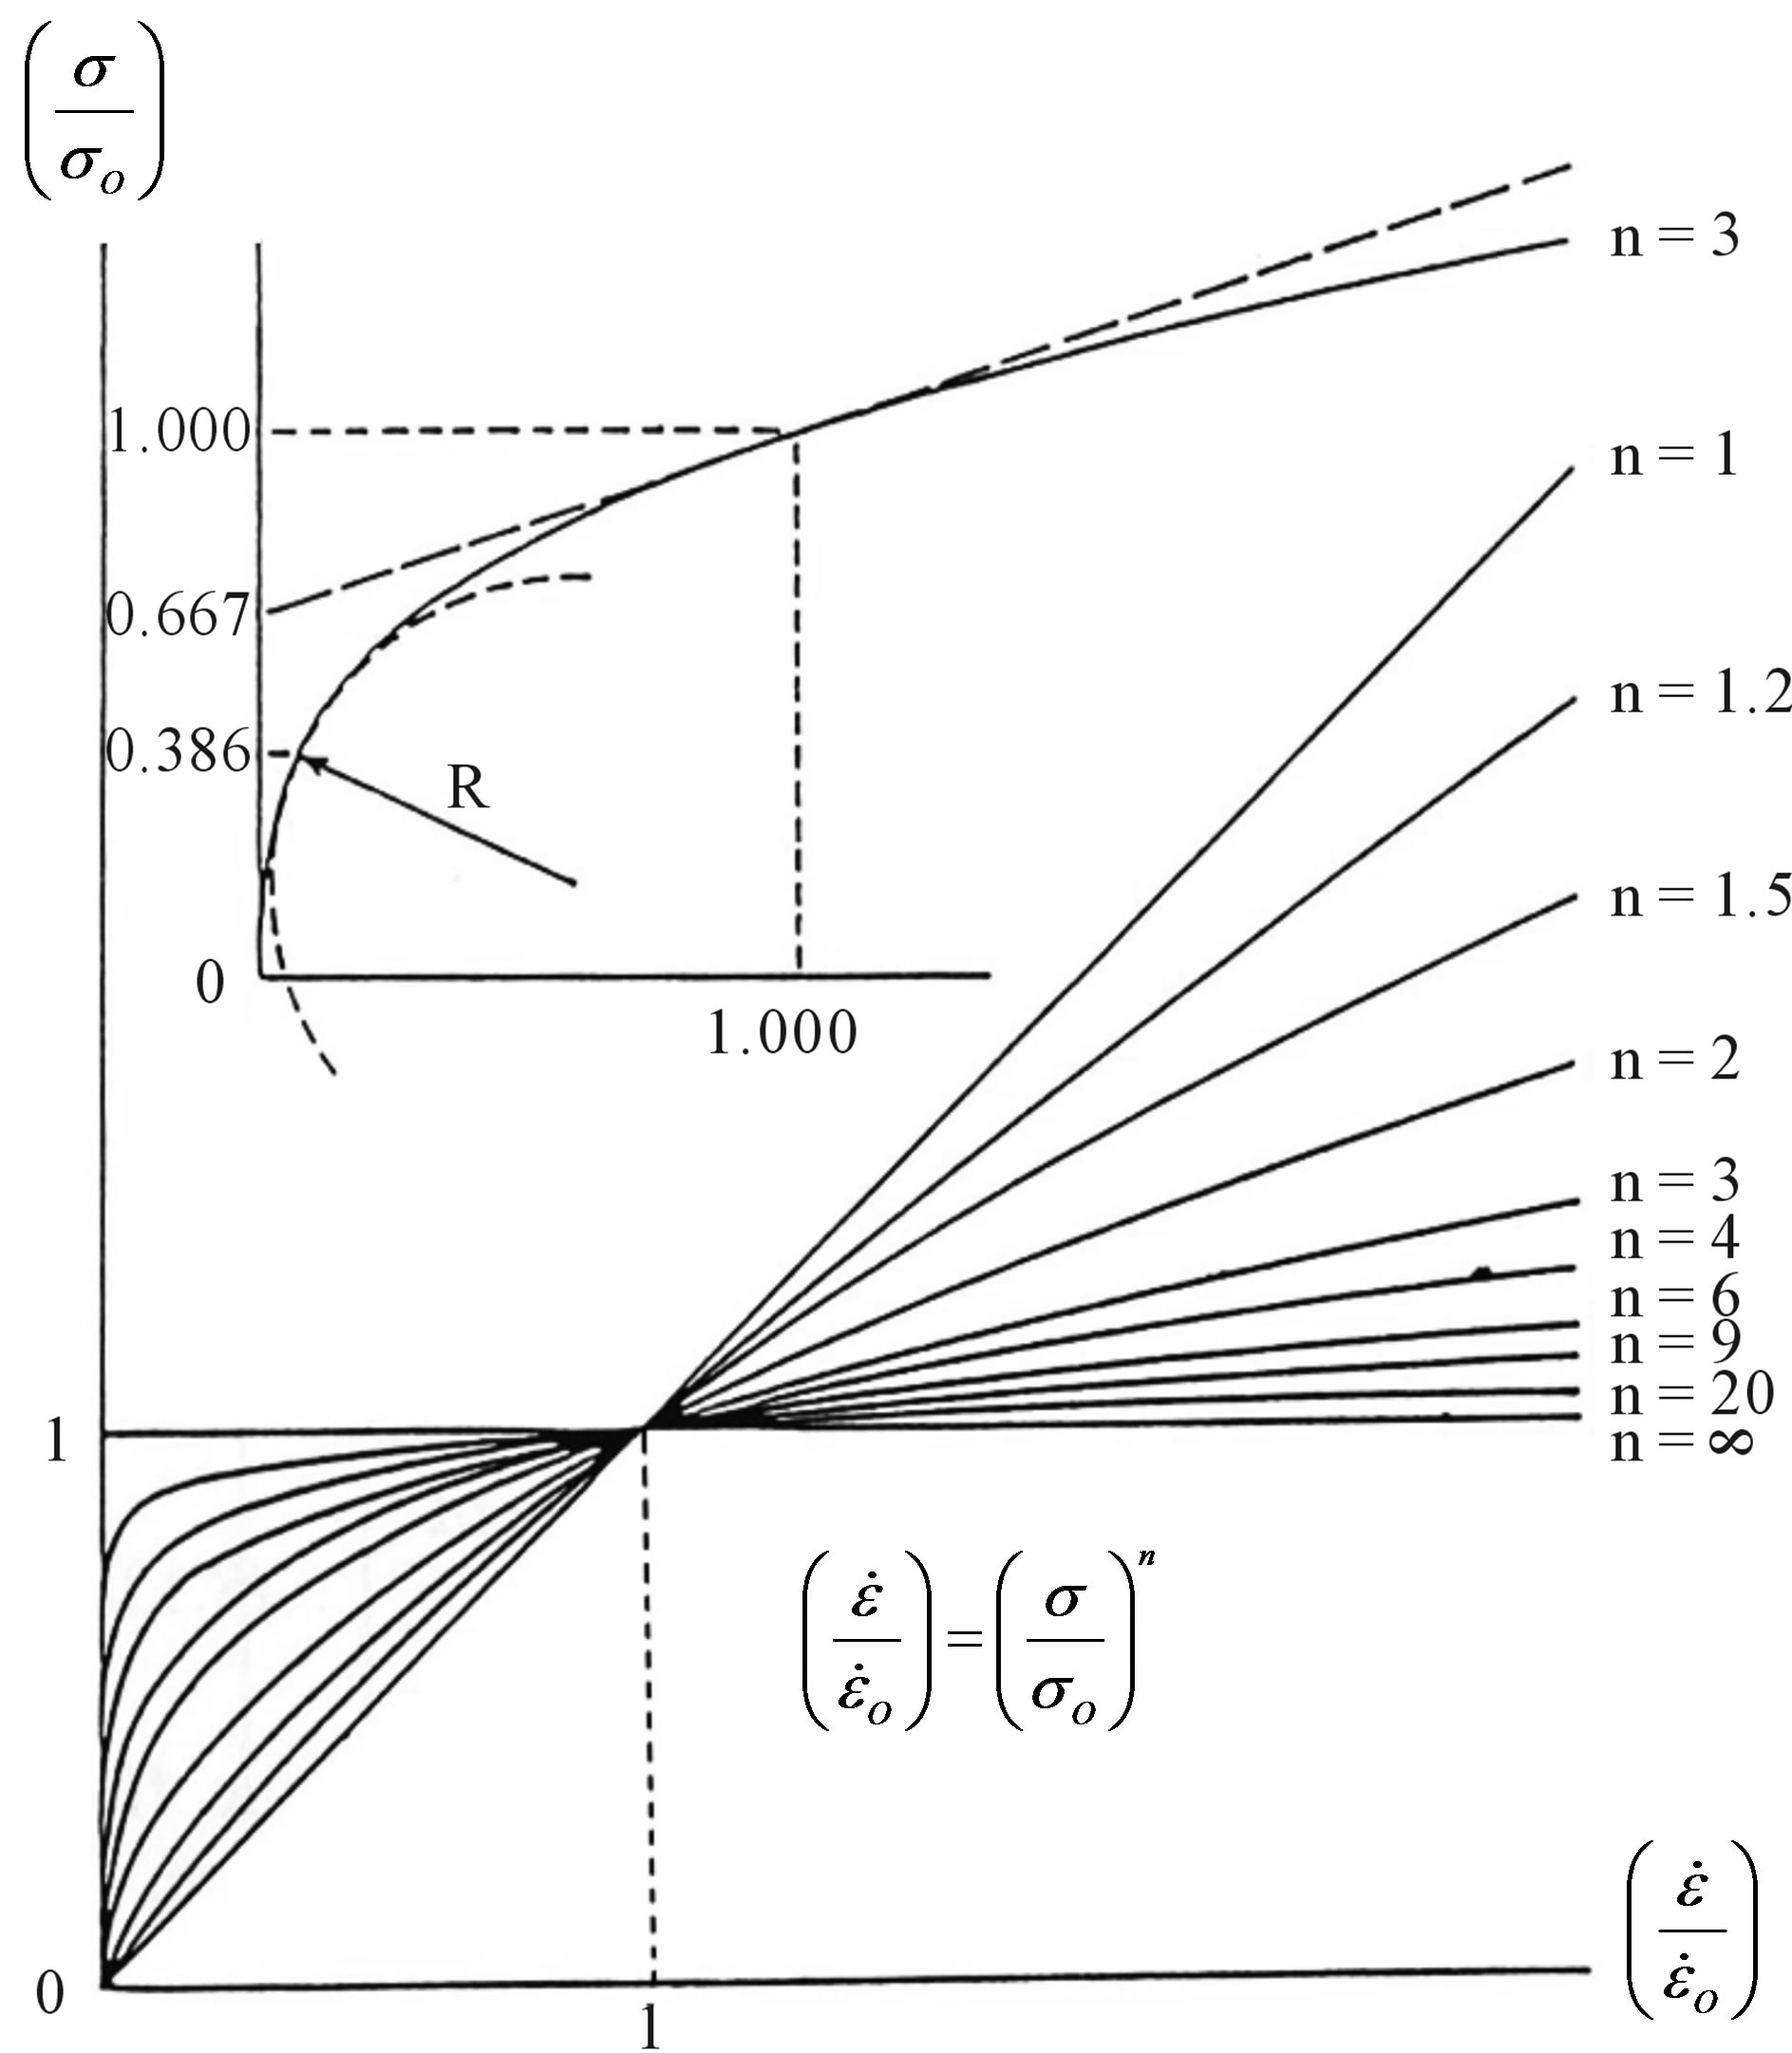
Figure 6. The viscoplastic creep spectrum for both slow and fast steady-state creep respectively before and after recrystallization. Viscoplastic viscosity hV is the tangent-slope to curves at applied stress s. At plastic yield stress sO the strain rate is  for all values of n. Recrystallization produces an easyglide fabric for which sO is reduced. Two viscoplastic yield criteria are shown for ice at viscoplastic yield stress sV at n = 3. The maximum stress-curvature criterion gives sV = 0.386sO. The stress-intercept tangent line at
  gives sV = 0.667sO. From [21] and Ice Sheets, Chapter 8 [15].
3 for ice, and  when s = sO for all values of n. For n = 3 in Figure 6, the maximum stress-curvature yield criterion gives a viscoplastic yield stress for ice of sV = 0.386 sO = 38.6 kPa and the stress-intercept yield criterion for the tangent line at
  gives sV = 0.667sO = 66.7 kPa, see Ice Sheets, Chapter 8 [15]. The viscoplastic viscosity hV obtained from Eq.7 for steadystate creep is:
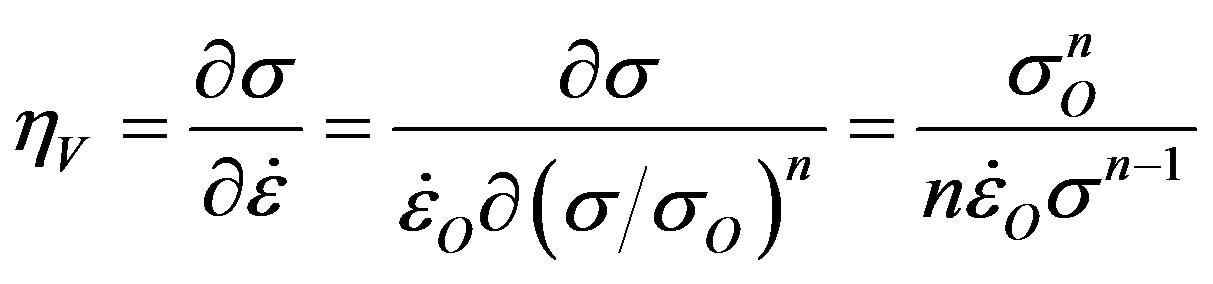 (8)
(8)
At s = sO where  in Eq.7, viscoplastic viscosity hV compared to Newtonian viscosity
 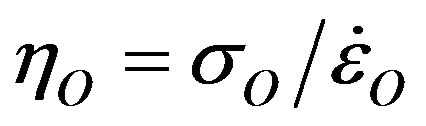 for n = 1 is:
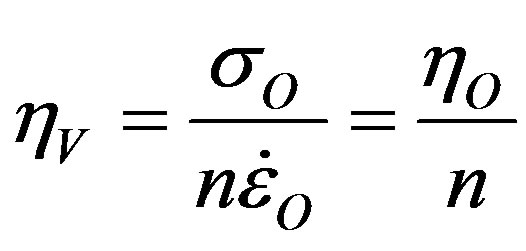 (9)
(9)
The Rayleigh number in Eq.3 for steady-state creep now becomes:
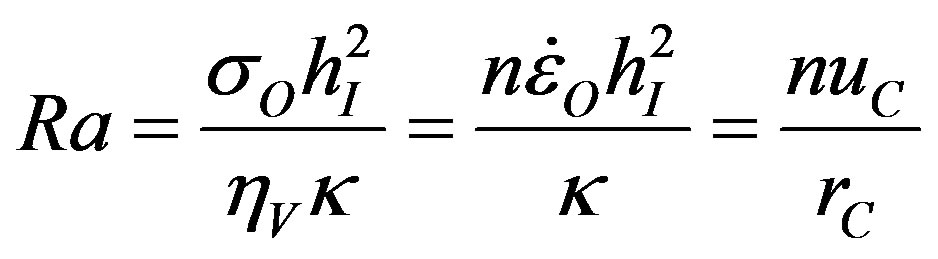 (10)
(10)
Eq.10 for steady-state creep gives Ra* = 280 for n = 1 [4,5]. This rises to Ra* = 840 when n = 3, which is within the range for Newtonian fluids.
For the Antarctic Ice Sheet, typical values in Eqs.4 through 6 are hI = 3 km paired with q = 0.002 for sheet flow, giving (sG)A = 60 kPa in Eq.4, hC = hI = 3 km and DrI = 1.2 kg/m3 for convection rolls underlying tributaries, giving (sG)C = 42 kPa in Eq.5, and rI/rW = 0.9 with hI = 100 m at the calving front of ice shelves, giving (sG)F = 50 kPa in Eq.6. Then gravitational driving stresses (sG)A » (sG)C » (sG)F » sV » 50 kPa for the Antarctic Ice Sheet. As seen in Figure 6, creep in ice occurs at sV < sO. Creep is significantly slower below sV than creep above sV. For West Antarctic ice, sV ≈ 45 kPa is common [32]. It may be higher for colder East Antarctic ice.
The dependence of (sG)C on hI is important. For example, grounded ice 2 km thick at the head of ice streams can thin to floating ice 200 m thick at the calving front of an ice shelf, a reduction of 90 percent. Since about 10 percent of ice floats above water, this is a reduction in ice elevation of 99 percent, ice 2000 m high lowers to 20 m. Given the strong dependence of Ra on hC in Eq.3, it is unlikely that steady-state thermal convection under ice-steam tributaries for hC » hI can be sustained in ice streams when ice thickness is reduced so drastically. Somewhere along ice streams convection must shut down.
5. CONCLUSIONS
Thermal convection in ice sheets and Newtonian fluids are fundamentally different. Atoms in fluids are not attached to crystal lattice sites, so heat transport by mass transport is much less inhibited. In polycrystalline glacial ice, thermal conduction increases as heat increases the vibrational amplitudes of atoms at their lattice sites. Deformation is elastic, therefore recoverable as temperature drops. With increasing temperature, atoms begin to break free from their lattice sites and move as chains, called dislocations, through the crystal lattice, allowing heat transport by mass transport. This begins as transient creep having the initial infinite strain rate of elastic deformation, but over time the strain rate falls as dislocations pile up at crystal grain boundaries for a random distribution of optic c-axes, one for each grain. This allows only slow steady-state creep in hard glide across high-angle grain boundaries. Strain energy adds to thermal energy at grain boundaries until new grains can be nucleated at pileups. The optic axes of new grains are aligned to produce an easy-glide ice fabric of low-angle grain boundaries that allow dislocations to pass much more easily from grain to grain. This is the process of recrystallization. It allows fast steady-state creep, as shown in Figure 5. Recrystallization begins at a creep strain of about 10 percent for a given applied stress. The strain rate, initially infinite, gives an infinite Rayleigh number. Both decrease over time and the Rayleigh number can fall below its critical value before slow steadystate creep is established. Then convective flow stops. If the Rayleigh number remains above its critical value, recrystallization can take place and allow fast steadystate creep to produce a higher Rayleigh number that allows faster convective flow. This component of icesheet flow can therefore turn on and off, and thereby regulate the 90 percent of ice discharged by ice streams in the Antarctic Ice Sheet. In the extreme, the faster discharge may allow the ice sheet to self-destruct, if more ice leaves than can be replaced by precipitation over the surface.
If thermal convection rolls underlie the ice-stream tributaries in Figure 1, virtually the entire Antarctic Ice Sheet consists of convective flow superimposed on advective flow. Since convective flow may turn on and off as a Rayleigh number rises above and falls below a critical value for sustaining thermal convection, this may have a major impact on stability of the ice sheet, especially on the discharge of ice streams. This could be a factor in the ability of ice sheets to rapidly self-destruct, thereby terminating a glaciation cycle of the present Quaternary Ice Age [21,29,30] and perhaps initiate a new glaciation cycle [8,33].
Fast transient creep at the onset of thermal convection in ice sheets can last for months, possibly ascending as transient pipes along ice divides where advective flow is small and as transient curtains aligned with advective flow downslope from the ice divides. Transient creep is initiated first where top and bottom boundaries are almost free surfaces, meaning low surface accumulation rates and a wet bed, ideally a subglacial lake. These lakes are widespread under the Antarctic Ice Sheet [34]. A few months of transient creep are sufficient to cause vertical displacements of a few centimeters. This is the sampling interval for extracting climate records from oxygen isotopes and ionic impurities in ice cores deposited during precipitation over the ice sheet [20]. Transient creep would randomly alter these records by altering the stratigraphy. That could render these records invalid. With improved radar technology, the widespread “echo-free zone” beneath the density inversion of the Antarctic Ice Sheet is now a zone with irregular and warped radioecho radar horizons. This alerts us to the possibility that transient thermal convection is active in this zone, and it distorts climate records.
The Antarctic Ice Sheet can be considered as a miniature mantle if advective and convective ice flow combine to produce major ice streams that discharge 90 percent of Antarctic ice. This has applications to thermal convection in Earth’s mantle [35-37]. Ice drainage basins in Figure 1 may be the equivalent of moving tectonic plates that generate crustal rifts, trenches, and mountain ranges where moving plate boundaries meet. As in rifted crustal ridges, ice pulls away from ice divides, but ice is too slow and soft to produce rifts. Ice converges on ice streams that supply ice shelves, which calve instead of collide like crustal plates. This understanding of ice-sheet dynamics would draw wide interest, and be a great boon to glaciology. The glaciology of ice sheets would undergo a Scientific Revolution comparable to plate tectonics if convection rolls were shown to underlie ice-stream tributaries.
Without strong bedrock control, tributaries and any underlying convection rolls can sweep back and forth sideways so the entire cold ice ceiling sinks slowly into the warm ice basement over time in all of the ice catchment areas shown in Figure 1. The lowering ice surface results from reduced ice-bed coupling in the wet bed underlying ice-stream tributaries. Taking hC = hI and a viscoplastic yield stress sV between 38.6 kPa and 66.7 kPa depending on what yielding criterion is used in Figure 6, and also depending on ice temperatures in East and West Antarctica, sV ≈ (sG)A ≈ (sG)C ≈ (sG)T is common from the grounded interior to the floating margin of the Antarctic Ice Sheet. Strain rates and ice velocities will be comparable if these stresses are comparable, otherwise the flow law for ice [28] must be discarded. Strong ice-bed coupling in Eq.4 for grounded ice weakens under convection rolls in Eq.5 and vanishes for floating ice in Eq.6. This can reduce ice elevations by over 99 percent, from interior elevations exceeding 2000 m thinning to under 20 m at the calving fronts of ice shelves. The 90 percent reduction in ice thickness is accompanied by boundary conditions that proceed from rigid to free in ice-stream tributaries, so Ra* is progressively reduced.
Radar reflecting horizons will not be altered much by this kind of thermal convection, since horizons are preserved in ice sinking slowly en masse in and between tributaries. Two field experiments are now possible to test this model in a conclusive way, using the highly accurate surface elevation and velocity data that revealed the tributaries in Figure 1. 1) Surface lowering in tributaries can be measured to millimeters of accuracy using InSAR satellite data, so lowering due to advective ice thinning can be separated from lowering in the broad sinking limb of a convection roll. 2) Surface velocities measured to centimeters of accuracy across the narrow lateral shear zones of tributaries using GPS technology can detect whether lateral advective flow is augmented by rising convective ice flow in the shear boundaries that is diverted into the tributaries by advective flow.
If thermal convection is indicated by experiments (1) and (2), shutting down convective flow may be studied by conducting these experiments on the flow stripes in Figure 2 as ice thins downstream, so decreasing hC in Eq.3 causes Ra to fall below Ra*. The field experiments to test this possibility would be daunting. A surface strain network, a grid of coreholes, radar profiling, and seismic sounding would be needed both along and across a tributary to obtain ice temperatures, fabrics, and deformation (borehole tilt) at depth so the full strain-rate tensor could be obtained and the convection roll could be mapped, both for geometry and velocities, and then linked to advective flow. Reproducing this pattern in computer models would be equally daunting.
As an example, take 200 m/a as the advective velocity difference between fast flow in tributaries and slower flow between tributaries in Figure 1. Add another 50 m/a from convective flow rising in the shear zone and diverted into the tributary. Strain rates 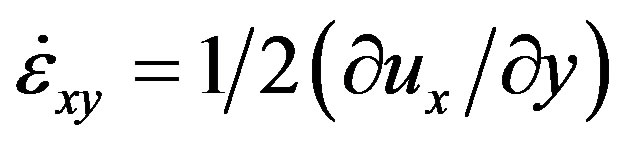 are then 0.100/a and 0.025/a for advective and convective ice flow, respectively, across a lateral shear zone 1 km wide. For ice 3 km thick and a tributary 5 km wide between lateral shear zones, ice rises 3 km in 60 years in the shear zones and sinks 3 km in 150 years in the tributary. Surface ice moving from rising to sinking flow averages 25 m/a over 2.5 km. The convective circuit of 11 km is completed in 410 years. During this time, the tributary has moved 82 km downslope. Hence, convective flow spirals downstream.
Ice downdrawn by fast advective flow will give tributaries a lower surface than slower ice advecting into tributaries from flanking ice ridges, as seen in Figure 3. When tributaries pack together at the head of an ice stream, this flanking advective ice flow vanishes and only convective flow rising in lateral shear zones contributes to sinking flow in tributaries, as seen in Figure 4. The proposed field experiments should be able to detect this change.
6. ACKNOWLEDGEMENTS
Eric Rignot and Kenneth Jezek kindly provided Figures 1 and 2, respectively. I thank Kenneth Jezek and Robert Jacobel for critiquing an earlier draft of this manuscript. Kenneth Jezek suggested field experiment (1). Input from two anonymous referees greatly improved the presentation. The Center for Remote Sensing of Ice Sheets (CReSIS) at the University of Kansas supported this work.
REFERENCES
- Strutt, J.W. and Rayleigh III, B. (1916) On convection currents in a horizontal layer of fluid, when the higher temperature is on the underside. Philosophical Magazine (Sixth Series), 32, 529-546.
- Gallagher, A.P. and Mercer, A.M. (1965) On the behaviour of small distrubances in plane Couette flow with a temperatue gradient. Proceedings of the Royal Society of London, Series A, 228, 117-128. doi:10.1098/rspa.1965.0133
- Davies-Jones, R.P. (1971) Thermal convection in a horizontal plane Couette flow. Journal of Fluid Mechanics, 49, 193-205. doi:10.1017/S0022112071002003
- Weertman, J. (1967) The effect of a low viscosity layer on convection in the mantle. Geophysical Journal of the Royal Astronomical Society, 14, 353-370. doi:10.1111/j.1365-246X.1967.tb06251.x
- Hughes, T. (1976) The theory of thermal convection in polar ice sheets. Journal of Glaciology, 16, 41-71.
- Rignot, E., Mouginet, J. and Scheichl, B. (2011) NASA research yields field map of Antarctic ice flow. NASA News. www.jpl.nasa.gov/news/news.cfm?release=2011-256&cid=release
- Gow, A.J., Ueda, H.T. and Garfield, D.E. (1968) Antarctic ice sheets: Preliminary results of first core hole to bedrock. Science, 161, 1011-1013. doi:10.1126/science.161.3845.1011
- Hughes, T. (1970) Convection in the Antarctic ice sheet leading to a surge of the ice sheet and possibly to a new Ice Age. Science, 170, 630-633. doi:10.1126/science.170.3958.630
- Bentley, C.R. (1971) Seismic anisotrophy in the West Antarctic ice sheet. In: Crary, A.P., Ed., Antarctic Snow and Ice Studies II, Antarctic Research Series, American Geophysical Union, Washington DC, 16, 131-177. doi:10.1029/AR016p0131
- Harrison, C.H. (1971) Radio-echo sounding: Focusing effects in wavy strata. Geophysical Journal of the Royal Astronomical Society, 24, 383-400. doi:10.1111/j.1365-246X.1971.tb02185.x
- Harrison, C.H. (1971) Radio echo records cannot be used as evidence for convection in the Antarctic ice sheet. Science, 173, 166-167. doi:10.1126/science.173.3992.166
- Paterson, W.S.B. (1981) The physics of glaciers. 2nd Edition, Pergamon Press, Oxford.
- Hughes, T. (1985) Thermal convection in ice sheets: We look but do not see. Journal of Glaciology, 31, 39-48.
- De Robin, G.Q. and Millar, D.H.M. (1982) Flow of ice sheets in the vicinity of subglacial peaks. Annals of Glaciology, 3, 290-294.
- Hughes, T. (1998) Ice sheets. Oxford University Press, New York.
- Prasad, G. (2011) Personal communication.
- Hughes, T. (1972) Derivation of the critical Rayleigh Number for convection in crystalline solids. Journal of Applied Physics, 43, 2895-2896. doi:10.1063/1.1661614
- Hughes, T. (1972) Thermal convection in polar ice sheets related to the variousimperical flow laws of ice. Geophysical Journal of the Royal Astronomical Society, 27, 215-229. doi:10.1111/j.1365-246X.1972.tb05773.x
- Hughes, T.J. (1977) Do oxygen isotope data from deep coreholes reveal dike-sill thermal convection in polar ice sheets? Isotopes and Impurities in Snow and Ice, 118, 336-340.
- Mayewski, P.A., Meeker, L.D., Twickler, M.S., Whitlow, S., Yang, Q. and Prentice, M. (1997) Major features and forcing of high latitude Northern Hemisphere atmosphericcirculation using a 110,000 year long glaciochemical series. Journal of Geophysical Research (Special Issue-Oceans/Atmosphere), 102, 26, 345-366.
- Hughes, T. (2009) Thermal convection and the origin of ice streams. Journal of Glaciology, 55, 524-536. doi:10.3189/002214309788816722
- Sargent, A. (2009) Modeling ice streams. Ph.D. Thesis, University of Maine, Orono.
- Jezek, K.C. (2008) The Radarsar-1 Antarctic mapping project. Byrd Polar Research Center Report No. 22, The Ohio State University, Columbus.
- Kamb, B. (2001) Basal zone of the West Antarctic ice streams and its role in lubrication of their rapid motion. In: Alley, R.B. and Bindschadler, R.A., Eds., The West Antarctic Ice Sheet: Behavior and Environment, American Geophysical Union (Antarctic Research Series), Washington DC, 157-200.
- Harrison, W.D., Echelmeyer, K.A. and Larsen C.F. (1998) Measurement of temperature in the margin of Ice Stream B, Antarctics, implication for margin migration and lateral drag. Journal of Glaciology, 44, 615-624.
- Engelhardt, H. (2012) Personal communication.
- Knopoff, L. (1964) The convection current hypothesis. Reviews of Geophysics, 2, 89-112. doi:10.1029/RG002i001p00089
- Glen, J.W. (1955) The creep of polycrystalline ice. Proceedings of the Royal Society of London, Series A, 228, 519-538. doi:10.1098/rspa.1955.0066
- Hughes, T. (2009) Variations in ice-bed coupling beneath and beyond ice streams: The force balance. Journal of Geophysical Research, 114, Article ID B04206.
- Hughes, T. (2011) A simple holistic hypothesis for the self-destruction of ice sheets. Quaternary Science Reviews, 30, 1829-1845. doi:10.1016/j.quascirev.2011.04.004
- De Robin, G.Q. (1955) Ice movement and temperature distribution in glaciers and ice sheets. Journal of Glaciology, 2, 523-532. doi:10.3189/002214355793702028
- Drewry, D.J. (1983) Antarctica: Glaciological and geophysical folio. Drewry, D.J., Ed., Scott Polar Research Institute, University of Cambridge, Cambridge.
- Hughes, T. (1975) The West Antarcic Ice Sheet: Instability, disintegratin, and initiation of ice ages. Reviews of Geophysics and Space Physics, 13, 502-526. doi:10.1029/RG013i004p00502
- Smith, B.E., Fricker, H.A., Joughin, I.R. and Tulaczyk, S. (2009) An inventory of active subglacial lakes in Antarctica detected by ICESat (2003-2008). Journal of Glaciology, 55, 573-595. doi:10.3189/002214309789470879
- Hughes, T. (1971) Convection in polar ice sheets a model for convection in the Earth’s mantle. Journal of Geophysical Research, 976, 2628-2638. doi:10.1029/JB076i011p02628
- Hughes, T. (1973) An unstable tetrahedral mantle-convection model, continental drift, and polar ice sheets. Tectonophysics, 17, 73-88. doi:10.1016/0040-1951(73)90066-8
- Hughes, T. (1973) Coriolis perturbation of mantle convection related to a two-phase convection model. Tectonophysics, 18, 215-230. doi:10.1016/0040-1951(73)90047-4
NOTES
*Professor emeritus.