Health
Vol.5 No.7A1(2013), Article ID:34597,10 pages DOI:10.4236/health.2013.57A1001
Discrimination and stratification tests of cardiovascular disease risk assessment models against ultrasound detection of carotid plaques in type 2 diabetics
![]()
Department of Health Technology and Informatics, Hong Kong Polytechnic University, Hung Hom, China; *Corresponding Author: wing.chi.chan@polyu.edu.hk
Copyright © 2013 Lawrence W. C. Chan et al. This is an open access article distributed under the Creative Commons Attribution License, which permits unrestricted use, distribution, and reproduction in any medium, provided the original work is properly cited.
Received 8 May 2013; revised 9 June 2013; accepted 30 June 2013
Keywords: Atherosclerosis; Cardiovascular Disease; Doppler Ultrasound; Risk Assessment
ABSTRACT
Atherosclerosis is the early stage of arterial disease, and underlies development of cardiovascular disease (CVD) and stroke. Although sophisticated models for assessing CVD and stroke risk have been derived based on largescale prospective studies, their abilities in detecting the presence or absence of atherosclerotic plaque have not been investigated. This study aimed to evaluate and compare discriminatory and risk stratifying abilities of 13 CVD risk assessment models against the ultrasound detection of carotid plaques in type 2 diabetes mellitus (T2DM) patients. Forty-nine T2DM subjects were recruited with informed consent, and major anthropomorphic and biomarker data for these models were collected. The model risk scores were evaluated against the carotid plaques detected by Doppler ultrasound. Only the FHSLpts-CHD-10Y model, which is a variant of the Framingham model, revealed an area under the receiver operating curve (AUROC) that was significantly different from a random scoring approach (AUROC: 0.681, p < 0.05), and was able to stratify the risk levels of carotid plaque presence (Chi-Square statistic: 5.99, p < 0.05).
1. INTRODUCTION
Type 2 diabetes mellitus (T2DM) is an increasingly common and severe problem worldwide. The major cause of death in T2DM patients is cardiovascular disease (CVD), and the relationship between T2DM and CVD is so strong that T2DM is regarded as a “risk equivalent” to a previous coronary event. Thus, T2DM patients are recognized to be high risk subjects. The underlying cause of CVD is atherosclerosis in coronary and carotid arteries. There are many factors apart from diabetes that are associated with accelerated atherosclerosis and elevated risk of CVD. These include hypertension, inflammation, obesity and dyslipidemia [1,2].
The development of atherosclerosis is silent but can be accelerated by the combined influence of multiple risk factors [1,2]. The American Heart Association (AHA) reported that no previous symptoms were observed in 50% of men and 64% of women who died suddenly of coronary heart disease (CHD) [3]. Therefore, there is a need to screen asymptomatic individuals for the purposes of CVD risk assessment. An ideal risk assessment model would be simple, non-invasive and use inexpensive tools to identify those with high CVD risk prior to development of symptoms. Such a model would enable early intervention for delay or prevention of clinical endpoints such as acute myocardial Infarction (MI) and stroke [4].
Many statistical models for assessing CVD risk have been developed based on the findings of large epidemicological studies. These are derived mainly from the Atherosclerosis Risk in Communities (ARIC), the Framingham Heart Study (FHS) and the United Kingdom Prospective Diabetes Study (UKPDS) [5-7]. Atherosclerosis is the early stage of CVD. The important morphological changes in atherosclerotic burden over time, such as the carotid intimal-medial thickness and carotid plaque presence, can be assessed by Doppler and B-mode carotid ultrasound. The morphological changes can be used in conjunction with or incorporated into any of the currently used CVD risk assessment models. Wyman et al. reviewed the literature to determine the association between carotid plaque presence and future CVD events and found that, in nine studies with over 38,000 subjects in total investigated, ultrasound-detected carotid plaque could predict future CVD to a significant extent [4]. Though the Adult Treatment Panel III (NCEP-ATP III) suggested that the finding of advanced sub-clinical atherosclerosis obtained by noninvasive testing can help confirm the high CVD risk in older persons, the use of risk assessment models is still indispensable to screening of individuals [8].
This paper focuses on thirteen CVD risk assessment models derived from these three well-renowned studies, which were all performed in Western populations. For simplicity, short forms are used to represent the models in this paper and the descriptions are shown in Table 1. The risk factors considered for these thirteen CVD risk assessment models are summarized in Table 2.
Atherosclerosis and CVD have common risk factors. Therefore, we hypothesize that the classical risk models can be transformed to detect the plaque presence in the carotid artery. In the evaluation and adjustment of CVD models, the generated CVD risk scores should be compared or calibrated against actual presence or absence of plaque.
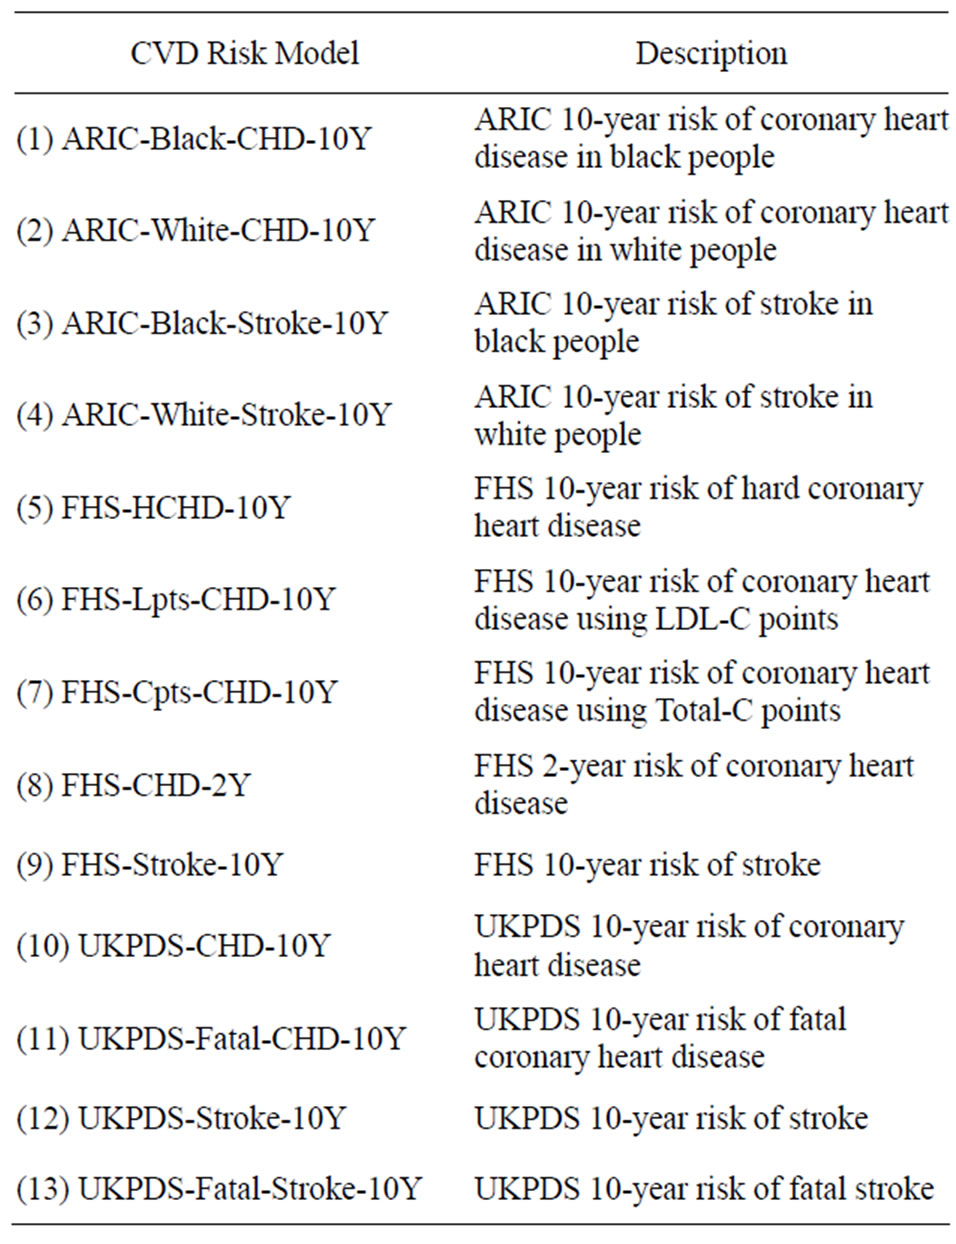
Table 1. Short forms and descriptions of thirteen CVD risk assessment models.
Further, some previous studies have validated the use of risk assessment models for the Western population from which they were constructed [5,9-11]. These models may not be directly applicable to Asian populations who do not share all the same CVD risk characteristics with Western populations, and they tend to over-estimate the CVD risk in the Asian populations [12]. The performance of the Framingham CHD risk assessment tool applied to Chinese participants recruited from 11 provinces in China was evaluated in the Chinese Multi-provincial Cohort Study (CMCS) [10]. It was found that the tool developed based on the data collected from white US participants also over-estimated the absolute CHD risk in the CMCS cohort, and recalibration of the Framingham functions improved the performance [10]. Sexspecific optimal 10-year risk prediction models were developed based on 17-year follow-up data from the USA-PRC Collaborative Study of Cardiovascular Epidemiology cohort to better the estimation of the CVD risk in Chinese population [13]. However, these previous studies did not focus on the early detection of carotid plaques, through which the proactive risk assessment and prevention of CVD can be achieved. There is a lack of the evaluation of cardiovascular risk models in the Hong Kong population where a large number of people are exposed to a major CVD risk factor, T2DM. Diabetes Hong Kong reported that the diabetic population in Hong Kong was 10% of the total population, with diabetes cases reaching almost 700,000 in 2008. In line with the global situation, there is a surging trend of diabetes locally. Therefore, it is meaningful to investigate the ultrasound-guided approach for evaluation of CVD risk assessment models in high risk groups and for use with other population groups, so as to provide an economical way to identify individuals who would benefit from early intervention. In this regard, a preliminary study was performed on 32 Hong Kong Chinese people and the performances of three risk models were compared though the sample size was not large enough to achieve a high level of statistical power [14].
1.1. CVD Risk Assessment Models versus Detection of Carotid Plaque
The findings of ARIC, FHS, UKPDS have been widely discussed in the literature. The assessment models developed based on their findings have been packaged into various kinds of tools, such as web-based risk engines, downloadable software applications and lookup tables in spreadsheets, which allow free access by the public. As these models attempt to predict CVD risk based on the levels of selected risk factors, the effect on an individual’s CVD risk can be assessed by modulating or manipulating some risk factors. This ‘simulating’ feature is particularly useful for suggesting intervention focusing
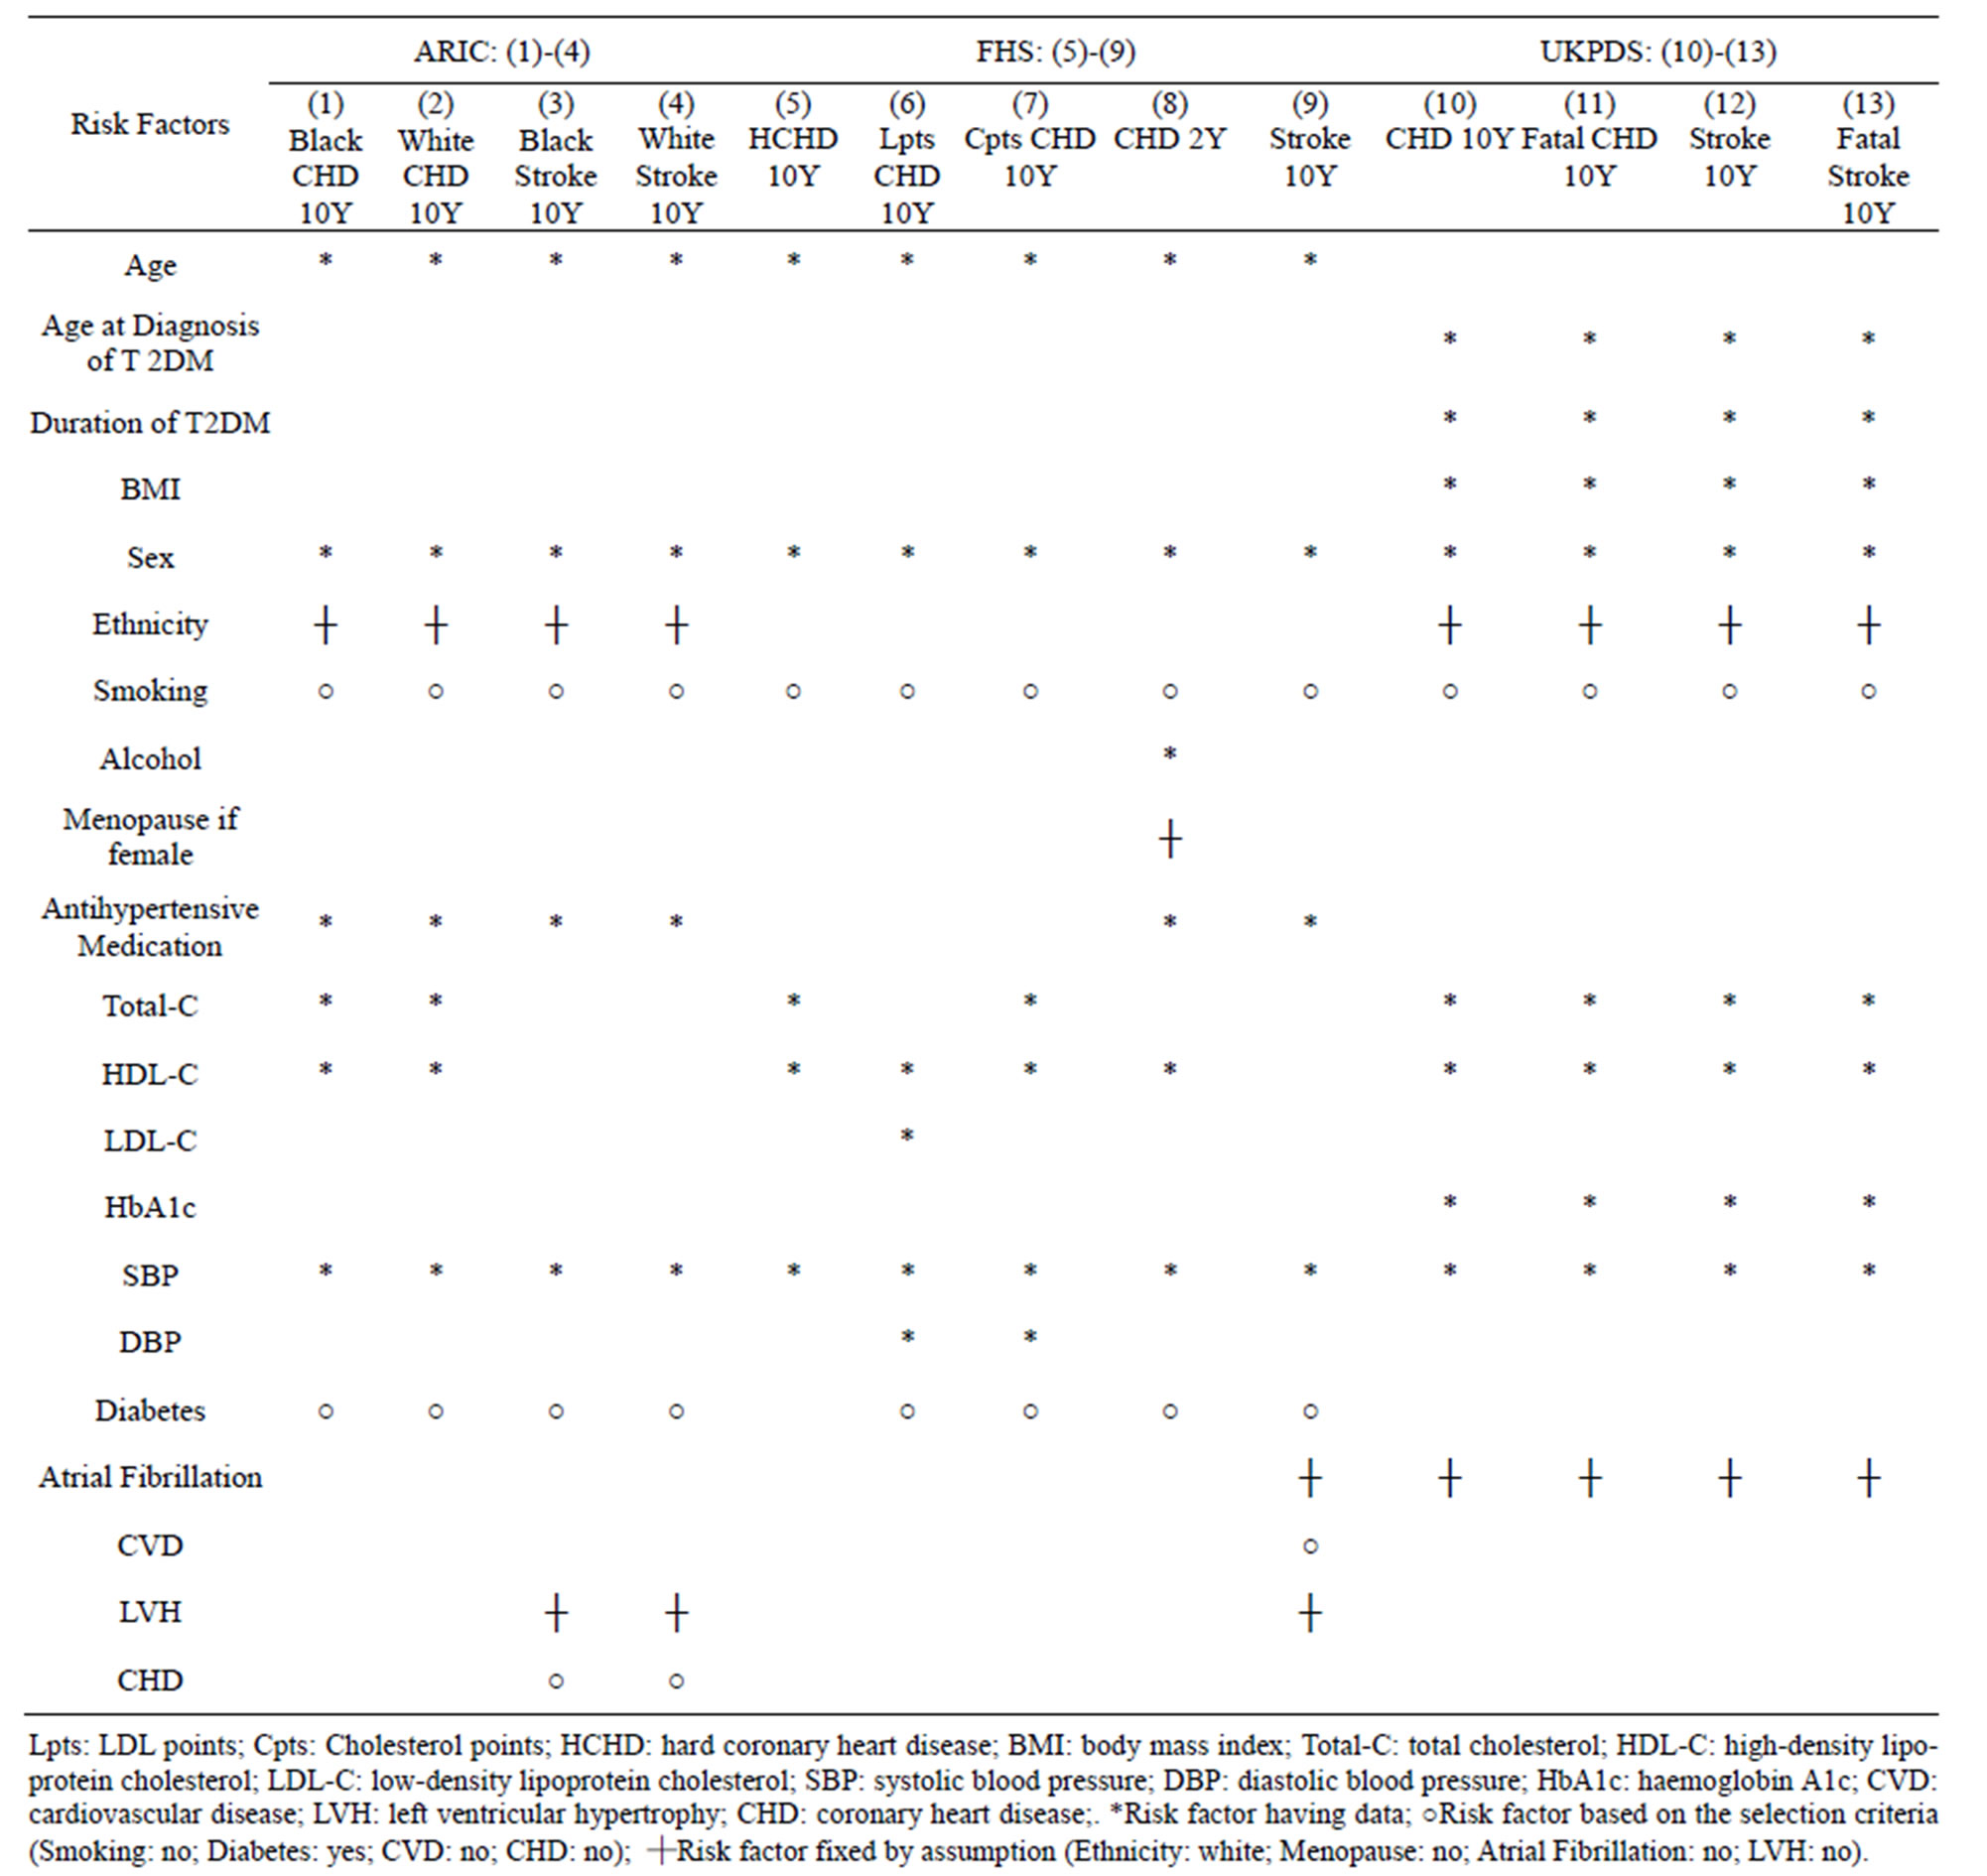
Table 2. Risk factors considered for the risk assessment models in ARIC, FHS and UKPDS.
on some modifiable risk factors that could reduce CVD risk most significantly or cost-effectively.
The CVD risk predicted by these models is normally in the two-year or ten-year basis, which is conceptually too ambiguous for the health practitioners to gain insight into the relationship between calculated risk and current atherosclerotic plaque formation. Increased likelihood of severe carotid atherosclerosis was observed in persons with diabetes, and diabetic patients suffer from irreversible brain damage due to carotid emboli more commonly than non-diabetic subjects [15,16]. Though many existing studies have investigated the link between atherosclerosis and CVD, no study to date has validated the ability of CVD risk assessment models in predicting the presence of atherosclerotic plaques [4,17,18].
Ultrasound screening is a commonly used tool to detect plaque in the carotid arteries. In routine clinical practice, many physicians request carotid ultrasound examinations even for patients with no obvious elevation of CVD risk [18]. Though the screening for carotid plaque does not require advanced training and the scanning time is much shorter than measurement of Carotid Intimal Medial Thickness (CIMT), the cost for a screening session and image reporting is still very high compared with that of using other risk assessment models [4]. Therefore, models with the ability to identify the presence or absence of carotid plaques would be useful and cost-effective primary clinical tools that would enhance the reliability and currency of CVD risk assessment. Plaquesensitive risk assessment models would be very meaningful to the care of diabetic patients, who normally do not undergo periodic carotid ultrasound examinations.
1.2. Research Question and Objectives
The research question is: “Do the CVD risk assessment models derived from FHS, UKPDS and ARIC studies predict carotid plaque presence in the population of interest (T2DM patients in Hong Kong)?”. To address this question, this study had two aims: the primary aim was to evaluate and compare the discriminatory ability of the risk assessment models derived from FHS, UKPDS and ARIC in classifying T2DM patients as likely to be positive (high risk) or negative (low risk) for carotid plaque; the second aim was to verify the agreement between the likelihood of the predicted CVD and that of the actual carotid plaque presence at different assessed risk levels in the model found to have the best discriminatory ability.
2. METHODS
2.1. Subjects and Sample Size
This study was approved by the Human Subjects Ethics Sub-Committee of the Hong Kong Polytechnic University (PolyU), and subjects gave their written informed consent. Inclusion criteria were: T2DM patient, aged 46 to 60 years, non-smoker; no record of stroke or coronary heart disease. Forty-nine subjects (35 females and 14 males) were recruited and all were Hong Kong Chinese. The mean and standard deviation of age were 54 and 4.55 years. In the power analysis, we chose significance level (α) of 0.05, statistical power of 0.9 and effect size of 0.5 (a medium difference) and estimated the required sample size as 44. As the dataset was used for evaluating but not developing the risk assessment models, a very large sample was not required.
2.2. Measurement and Data Collection
Each subject completed a questionnaire, which collected information including age, gender, occupation, duration of T2DM, self and family history of diseases, antihypertensive medication, diet, alcohol, sleeping habits (sleep quality and quantity) and physical exercise.
Fasting was required for 8 - 12 hours before blood and urine sample collection. A panel of biomarkers reflecting risk of vascular disease in these subjects was measured, including complete blood count (CBC), plasma glucose, LDL-C, HDL-C and Total-C for lipid profile, high sensitivity C-reactive protein (hs-CRP), uric acid, the total antioxidant capacity as the ferric reducing antioxidant power (FRAP) value, and ascorbic acid (AA).
Anthropologic parameters, such as height, weight and waistline, were measured. After 5-minute resting, SBP and DBP were measured using a blood pressure monitor, Welch Allyn Atlas Monitor 62,000 Series.
B-mode and color flow Doppler ultrasound was used to interrogate the carotid arteries of subjects and identify the presence of carotid plaques. The examinations were performed by experienced sonographers. In acquiring the ultrasound images, each subject was lying in a comfortable supine position with the head rotated 45 degrees away from the side of the examination. A linear array transducer with a minimum frequency of 7 MHz was manipulated at the neck region until the image demonstrated a transverse section of the common carotid artery (CCA). By moving the transducer cranially along the vessel to the proximal portion of internal and external carotid arteries (ICA & ECA), the sonographers checked for any stenosis, narrowing, or intimal thickening and performed the corresponding measurements. ICA, CCA, ECA and bifurcation on both left and right sides were examined and all the blood flow velocities at the proximal, middle and distal portions of the CCA, and the proximal portions of ICA and ECA were measured. A radiologist reviewed the recorded ultrasound images with measurements and confirmed the carotid plaque presence with the criterion that the discrete and focal intraluminal wall thickening was observed at any portion of the carotid arteries.
2.3. Model Evaluation Process
This research work aimed to evaluate and compare the performances of the thirteen CVD risk assessment models based on FHS, ARIC and UKPDS findings, in relation to the presence or absence of carotid plaque as detected by ultrasound examination of an external population, i.e. T2DM patients in Hong Kong.
CVD risk scores of the 49 T2DM subjects studied were generated by entering the collected data into each model. Table 2 provides a summary of the models and their considered risk factors. Not all the collected data were entered into the models. ARIC and UKPDS do not incorporate an option of risk factor suitable for an external population. For example, the options for ethnicity in ARIC and UKPDS do not include Chinese, and the default of “White” was used. For those risk factors where the data were not collected, say menopause, atrial fibrillation and Left Ventricular Hypertrophy (LVH), the default but fixed choices were made for all the cases. Some risk factors were fixed due to the subject inclusion criteria of the study, e.g. smoking, diabetes, CVD and CHD.
Every risk model generated a risk score for each subject by entering risk factors with the collected data and forced choices. Denote fi,j and ri as the jth risk factor and the risk score for the ith subject. It is assumed that there are (c + d) risk factors comprising of c continuous variables and d categorical variables, based on which the risk score was generated. Forty-nine risk scores, r1, r2, ∙∙∙, r49, were generated by each risk model. The predictive performances of the risk assessment models were evaluated by discrimination and calibration.
2.3.1. Discrimination
The discriminatory power of each model was assessed by the Area Under the Receiver-Operating Characteristic (AUROC) curve and its nonparametric Wilcoxon statistic [19]. Denote Li as the label of gold standard, which is a dichotomous variable, either 1 or 0, indicating the carotid plaque presence (case) or not (non-case) for the ith subject, confirmed by the radiologist. The risk score ri rating the ith subject with the probability of CVD within certain period of time was combined with the gold standard label of carotid plaque Li to form an ordered pair (ri, Li). The ordered pairs for all subjects were sorted in ascending order of ri. A threshold value, ranging from 0 to 1, was set amid every two consecutive sorted ri’s to generate the sensitivity (true positive rate) and the 1-specificity (false positive rate) based on the ranking collated with the sorted gold standard label Li. The Receiver-Operating Characteristic (ROC) curve was drawn by plotting the sensitivity against the 1-specificity for all the threshold values. The empirical AUROC was computed using the trapezoidal rule. The Wilcoxon statistic was exploited to estimate the standard error (SE) of AUROC, indicating the sampling variability, and its asymptotic significance p, for the null hypothesis “true area = 0.5”. The asymptotic 95% confidence interval (CI) was given by [AUROC − 1.96*SE, AUROC + 1.96*SE]. The discriminatory power of every model was tested against the criterion that the empirical AUROC was significantly different from 0.5, implying that the model is not randomly rating the subjects.
2.3.2. Calibration
In the other two studies evaluating the Framingham scores against actual disease outcomes, the agreement between the predicted and actual (CVD) event rates was measured for non-Framingham cohort [5,10]. According to the risk scores generated by the risk assessment models, the subjects were divided into deciles of the predicted risk for a CVD event within certain period of time. The predicted and actual (CVD) event rates were plotted pair-wise for each decile to construct a bar chart for evaluating the calibration.
In this study, the predicted (CVD) and actual (carotid plaque) outcomes are different. It is not expected to observe the conformity between the predicted (CVD) and the actual (carotid plaque) event rates because the prevalence of carotid plaques is obviously higher than that of CVD. As ‘silent’ atherosclerosis is the sub-clinical at the early stage of CVD, it is more meaningful to hypothesize the conformity between the likelihood functions of CVD and carotid plaque presence given a predicted risk score level. Trisection of risk was performed instead of forming deciles because the sample size was small. After sorting the risk scores, the subjects were divided into three groups: high risk, medium risk and low risk. Every subject was graded by a particular Risk Score Range (RSR) and Boolean random variables: Carotid Plaque Presence (CPP) and Cardiovascular Disease (CVD). According to Bayes’ Theorem, the likelihood function of CVD given RSR is represented by the following formula.
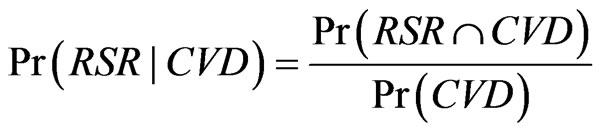 . (1)
. (1)
The numerator is estimated by the sum of risk scores for subjects within the same range of risk and the denominator, the sum of risk scores for all subjects. The likelihood function of CPP given RSR is represented by the following formula.
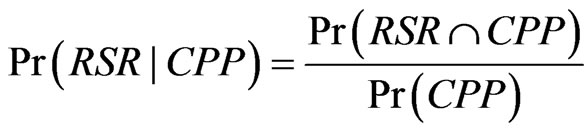 . (2)
. (2)
This fraction is equivalent to the ratio of the number of subjects having carotid plaque and within a range of risk score to the number of subjects having carotid plaque. Instead of comparing the predicted (CVD) and actual (carotid plaque) event rates, the calibration in this study measured how closely the likelihood functions of CVD and CPP given a risk score range agree with each other. The Chi-Square χ2 statistics were employed to compare the differences between the two likelihood functions. Good calibration is indicated by small value of χ2, below the critical value. There is significant lack of calibration if the value of χ2 exceeds 20 [10].
3. RESULTS
A total of 16 cases of carotid plaque were identified by ultrasound from the total of 49 subjects, giving a 33% positive rate. The AUROC analysis results of the thirteen original risk assessment models are shown in Table 3. Among the CVD risk assessment models, FHS-LptsCHD-10Y demonstrated the strongest discriminatory ability to differentiate those with and without carotid plaque, with AUROC of 0.681, in the 95% Confidence limits [0.524, 0.838], indicating p < 0.05. This indicates a non-random rating tool. The FHS-Cpts-CHD-10Y model ranked second with AUROC of 0.643, but this was not significantly different from 0.5 as the 95% Confidence limits were [0.479, 0.807]. The ROC curve of the FHS-
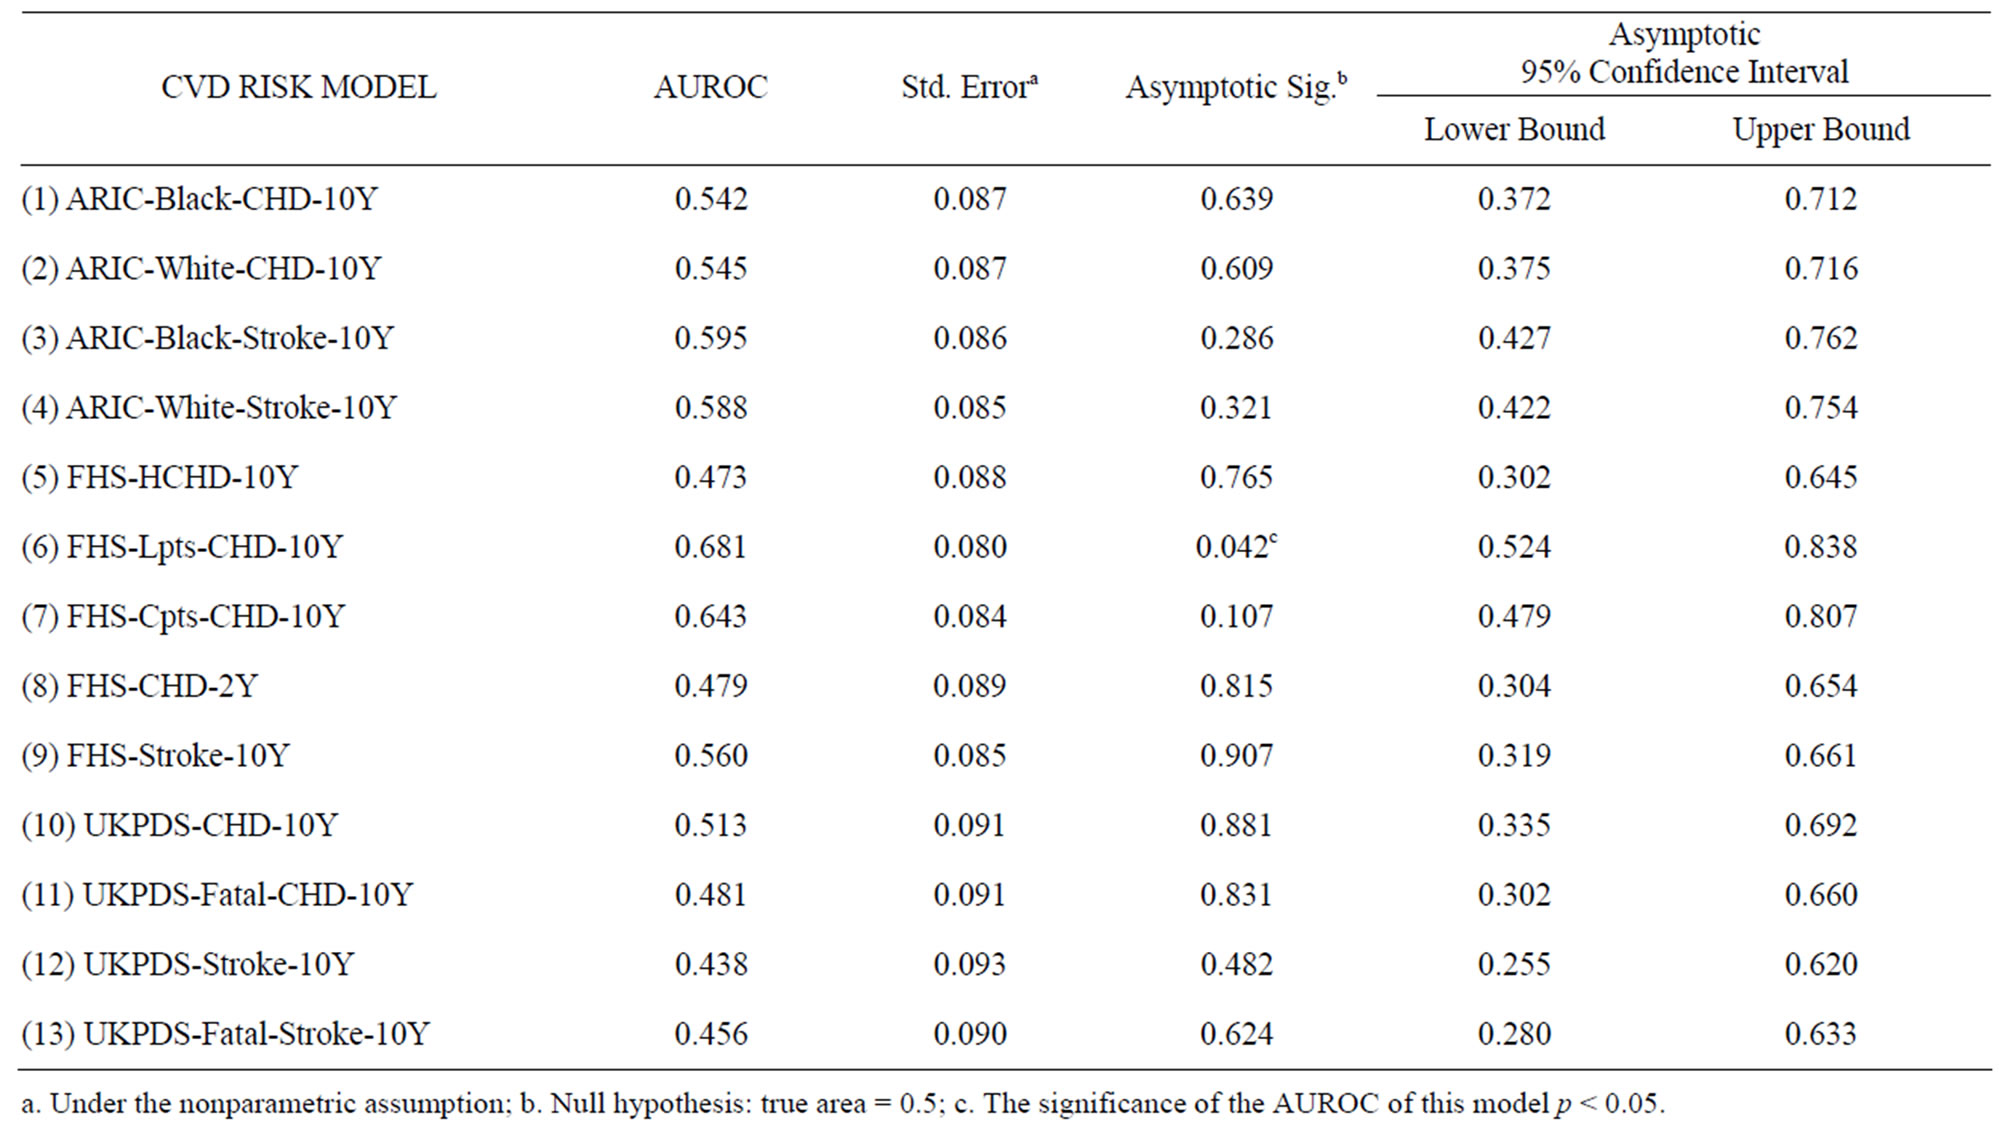
Table 3. AUROC for evaluating thirteen risk assessment models against the identification of carotid plaque presence in T2DM in Hong Kong.
Lpts-CHD-10Y is plotted in Figure 1. When the ROC curve was inspected with different cutoff points of risk score, the empirical data confirmed at most 24% specificity (true negative rate) at 100% sensitivity (true positive rate). In other words, the false alarms comprised of 76% of the sample size. The differences in AUROC between FHS-Lpts-CHD-10Y model and the other models are shown in Table 4. It was found that the performance of FHS-Lpts-CHD-10Y model was significantly better than UKPDS-Stroke-10Y model only.
To compare the likelihood function of CVD predicted by FHS-Lpts-CHD-10Y with the likelihood function of carotid plaque in different risk levels, the calibration of the FHS-Lpts-CHD-10Y is illustrated in Figure 2. According to calibration ranking, the “low”, “medium” and “high” risk levels represented subjects whose predicted CVD risk within the ranges (0.10% - 0.42%), (0.42% - 0.73%) and (0.73% - 1.67%) respectively. The FHS-LptsCHD-10Y underestimated the likelihood of carotid plaque in the “low” risk level, overestimated in the “medium” risk level, but well predicted carotid plaque presence in the “high” risk level. The Chi-Square χ2 statistic was 5.99, below the critical value. Thus, there was no significant difference between likelihood function of CVD event and carotid plaque presence in the three risk levels using the FHS-Lpts-CHD-10Y.
In summary, among the thirteen original CVD risk assessment models, it was found in ROC analysis that the
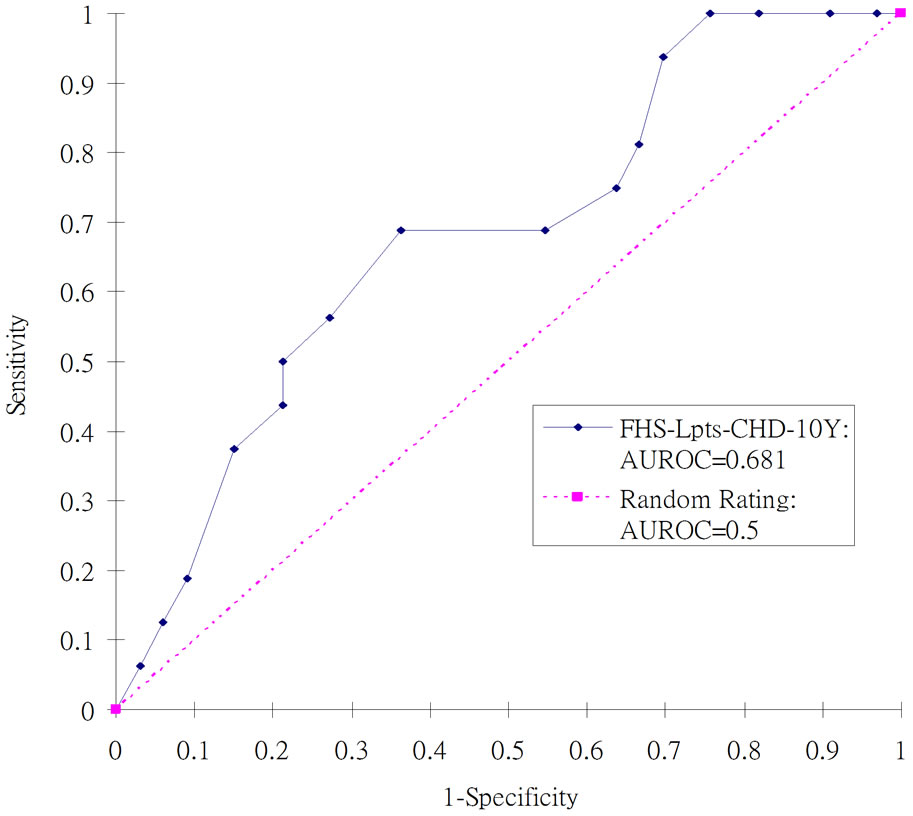
Figure 1. ROC curves for evaluating the Framingham Model, FHS-Lpts-CHD-10Y against the identification of carotid plaque in T2DM in Hong Kong.
FHS-Lpts-CHD-10Y model was the only model that revealed significant difference from a random scoring method with AUROC = 0.5 and this model outperformed the UKPDS-Stroke-10Y model significantly, though its specificity was not so satisfactory. The calibration test showed no significant difference between the likelihood of the predicted CVD and that of the actual carotid plaque presence in three risk levels.
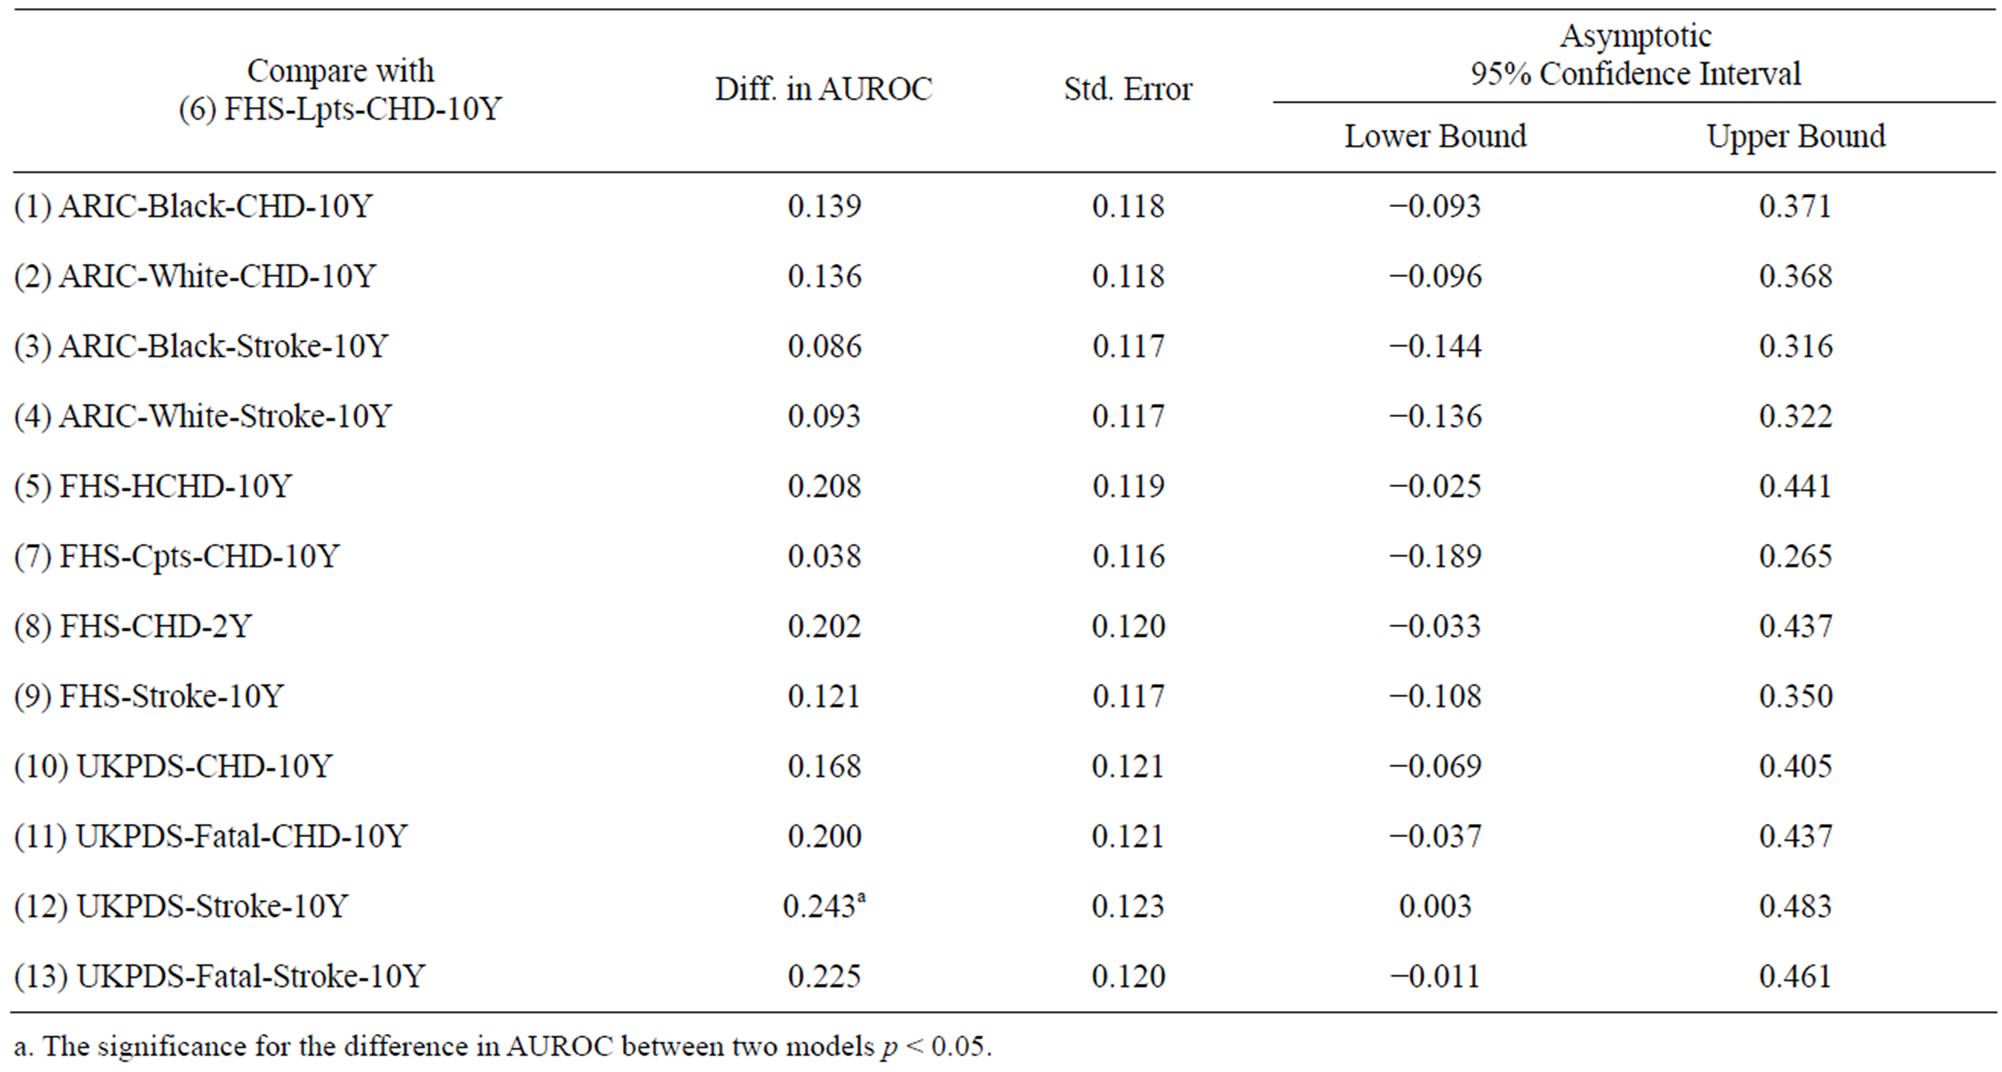
Table 4. Differences in AUROC between FHS-Lpts-CHD-10Y model and the other models.
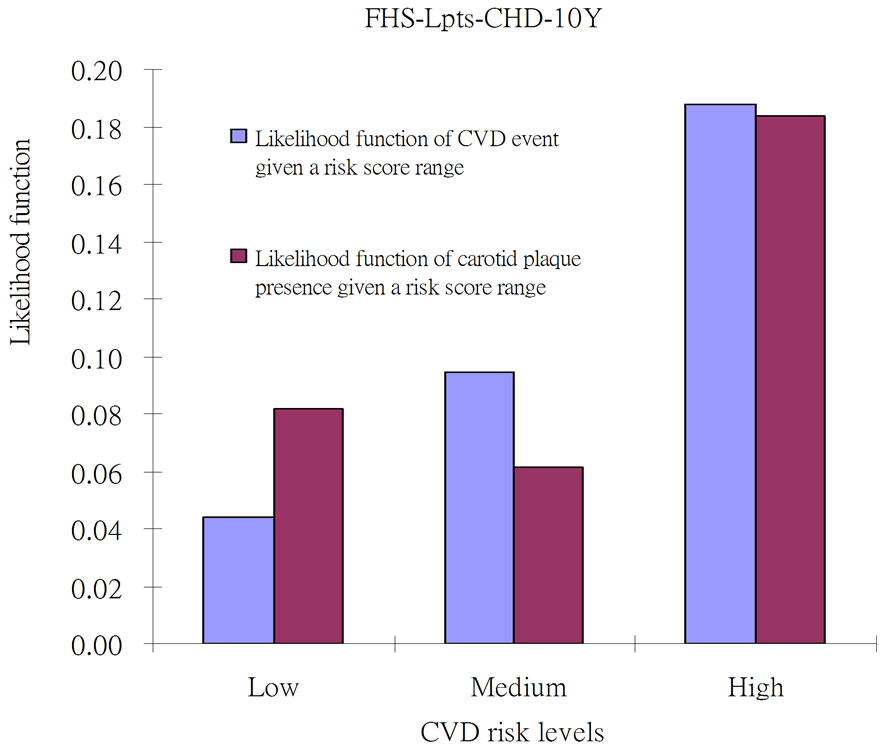
Figure 2. Likelihood function (%) of CVD event versus carotid plaque presence in T2DM in Hong Kong using the FHS-LptsCHD-10Y. Lpts: LDL points. Low: low risk range from 0.10% to 0.42%; Medium: medium risk range from 0.42% to 0.73%; High: high risk range from 0.73% to 1.67%.
4. DISCUSSION
The aims of this study were to evaluate and compare the discriminatory ability of thirteen CVD risk assessment models derived from the FHS, UKPDS and ARIC studies against the presence of carotid plaque, and to verify the ability for predicting the likelihood of carotid plaque presence using the model with the strongest discriminatory ability. It was shown that the FHS-LptsCHD-10Y model can be directly applied to T2DM patients in Hong Kong for predicting presence or absence of carotid atherosclerosis. The good discriminatory ability of the FHS-Lpts-CHD-10Y can be attributed to the fact that it is the only model taking into account LDL-C as its input. Several epidemiological studies have well established and widely accepted the associations between high concentrations of LDL-C and the coronary events, and it was also proved that LDL-C independently predicts coronary events in untreated patients [20]. An association between LDL-C level and ischemic stroke has also been found in several epidemiological studies [21, 22].
Further, the DBP is the input of FHS-Lpts-CHD-10Y and FHS-Cpts-CHD-10Y only. Though the AUROC for FHS-Cpts-CHD-10Y was not significantly different from 0.5, it ranked the second among all the evaluated models. It was shown in a retrospective study that the prevalence of diastolic abnormalities, such as high DBP, in the subject group with carotid intimal-medial thickness (CIMT) greater than 1mm was significantly higher than that with carotid IMT < 1 mm [23]. The permanent increase in blood pressure leads to an increase in arterial stiffness due to the adaptive structural alteration of arterial wall with elevated collagen compound [24]. It also recommended further investigation into the interactive effect of LDL-C and DBP on the atherosclerosis.
The calibration test demonstrated the performance of the FHS-Lpts-CHD-10Y in the stratified risk score levels: high, medium and low risk ranges. Given the same risk level, the likelihood of predicted CVD agreed with the likelihood of actual carotid plaque presence. This finding confirmed the effectiveness of this model in classifying the patients into three different risk levels, which might improve the prognostic stratification of T2DM patients and help recognize the subset of patients at high risk of atherosclerosis early.
The highest predication accuracy attained in this study was indicated by AUROC = 0.681. Though this model was not a random rating tool, the attained accuracy lying between 0.5 and 0.7 was marginally acceptable. When it was considered as a screening tool, the trade-off in false alarms (76%) was unavoidable for achieving zero missing case. There clearly exists room for further improvement. Firstly, the newly emerging biomarkers, such as hs-CRP, plasma ascorbic acid (AA), uric acid, triglycerides and homocysteine, have not been incorporated into the models. A review paper emphasized that hs-CRP independently predicts future CVD events and provides additional prognostic information to lipid screening, metabolic disorder (e.g. diabetes) and FHS risk score [25]. Clinical and epidemiological studies also provided evidence that hs-CRP, as an inflammatory marker, plays a very important role in the pathogenetic mechanism in atherosclerosis [26]. As LDL oxidation is critical in the progression of atherosclerosis, the atherosclerosis suppressing effect of plasma AA inhibits the LDL oxidation by acting as a pro-oxidant in the presence of metal ions and scavenging the free radicals, such as hydroperoxides [27]. It was also shown that plasma AA in atheromatous aortas is less concentrated than in control blood vessels and the concentration of plasma AA in healthy subjects is inversely correlated with the mortality of CHD in followup [28-30]. Therefore, it is expected that more precise prediction of atherosclerosis can be achieved by combining the FHS-Lpts-CHD-10Y with the effect of the newly emerging biomarkers to generate a global risk score. Further study will investigate the value of their integration into an atherosclerotic risk assessment model, which adopts the FHS-Lpts-CHD-10Y as its basic component and is able to expand infinitely with the risk mappings of the newly emerging biomarkers.
5. CONCLUSION
In predicting the presence of carotid plaque, the FHSLpts-CHD-10Y outperformed the other 12 CVD risk assessment models that have been derived from the FHS, UKPDS and ARIC. The FHS-Cpts-CHD-10Y ranked next, but its performance was not significantly different from a random scoring approach. The calibration performance suggested that the FHS-Lpts-CHD-10Y model provides three-level atherosclerotic risk stratification for easy identification of high risk patients. The findings of this study encourage the establishment of an integrated atherosclerotic risk assessment model, which employs the FHS-Lpts-CHD-10Y as its basic component, but with the added value of newly emerging biomarkers, such as hs-CRP, plasma AA, uric acid, triglycerides and homocysteine, as the additional components. In future research work, this integrated model will be validated and refined using the data collected in this research so as to achieve much larger AUROC and smaller false positive rate at 100%-sensitivity cutoff point, enabling targeted preventive care to high risk individuals.
6. ACKNOWLEDGEMENTS
Authors would like to thank Dr. SW Choi and Ms. Cynthia MK Wong for their efforts in performing the laboratory tests and the carotid ultrasound examinations. This research was supported by the PolyU internal research funds “A-PH74: Artificial intelligent modelling of inter-relationships between biomarker profile and haemodynamic features of atherosclerosis in Type II Diabetes Mellitus”, “A-SA33: Sketching a Multi-dimensional Arterial Health Status Map based on Fuzzy Expert System, Health Domain Expertise and Published Relative Risk Findings” and RGC General Research Fund “PolyU 5118/11E: Clinical Decision Support using Biomedical Ontology and Literature Supported Patient Similarity for Diagnostic and Prognostic Pattern Discovery from Electronic Health Records”.
REFERENCES
- Dzau, V.J., Braun-Dullaeus, R.C. and Sedding, D.G. (2002) Vascular proliferation and atherosclerosis: New perspectives and therapeutic strategies. Nature Medicine, 8, 1249- 1256. doi:10.1038/nm1102-1249
- Goldschmidt-Clermont, P.J., Creager, M.A., Lorsordo, D.W., Lam, G.K.W., Wassef, M. and Dzau, V.J. (2005) Atherosclerosis 2005—Recent discovery and novel hypotheses. Circulation, 112, 3348-3353. doi:10.1161/CIRCULATIONAHA.105.577460
- Lloyd-Jones, D., Adams, R., Carnethon, M., Simone, G.E., Ferguson, T.B., Flegal, K., et al. (2009) Heart disease and stroke statistics 2009 update: A report from the American heart association statistics committee and stroke statistics subcommittee. Circulation, 119, e21-e181. doi:10.1161/CIRCULATIONAHA.108.191261
- Wyman, R.A., Mays, M.E., McBride, P.E. and Stein, J.H. (2006) Ultrasound-detected carotid plaque as a predictor of cardiovascular events. Vascular Medicine, 11, 123-130. doi:10.1191/1358863x06vm666ra
- D’Agostino, R. B., Grundy, S., Sullivan, L.M., Wilson, P., et al. (2001) Validation of the framingham coronary heart disease prediction scores: Results of a multiple ethnic groups investigation. The Journal of the American Medical Association, 286, 180-187. doi:10.1001/jama.286.2.180
- Chambless, L.E., Heiss, G., Shahar, E., Earp, M.J. and Toole, J. (2004) Prediction of ischemic stroke risk in the atherosclerosis risk in communities study. American Journal of Epidemiology, 160, 259-269. doi:10.1093/aje/kwh189
- Stevens, R.J., Kothari, V., Adler, A.I., Stratton, I.M., Holman, R.R. on Behalf of the United Kingdom Prospective Diabetes Study (UKPDS) Group (2001) The UKPDS risk engine: A model for the risk of coronary heart disease in type II diabetes (UKPDS 56). Clinical Science (Lond), 101, 671-679. doi:10.1042/CS20000335
- Expert Panel on Detection, Evaluation, and Treatment of High Blood Cholesterol in Adults (2001) Executive summary of the third report of the national cholesterol education program (NCEP) expert panel on detection, evaluation, and treatment of high blood cholesterol in adults (adult treatment panel III). The Journal of the American Medical Association, 285, 2486-2497. doi:10.1001/jama.285.19.2486
- Eckel, R.H., Kahn, R., Robertson, R.M. and Rizza, R.A. (2006) Preventing cardiovascular disease and diabetes: A call to action from the american diabetes association and the american heart association. Circulation, 113, 2943- 2946. doi:10.1161/CIRCULATIONAHA.106.176583
- Liu, J., Hong, Y.L. and D’Agostino, R.B. (2004) Predictive value for the chinese population of the framingham CHD risk assessment tool compared with the chinese multi-provincial cohort study. The Journal of the American Medical Association, 291, 2591-2599. doi:10.1001/jama.291.21.2591
- The Hong Kong Diabetes Registry (2007) Development and validation of stroke risk equation for Hong Kong Chinese patients with type 2 diabetes. Diabetes Care, 30, 65-70. doi:10.2337/dc06-1273
- Chia, Y.C. (2011) Review of tools of cardiovascular disease risk stratification: Interpretation, customization and application in clinical practice. Singapore Medical Journal, 52, 116-123.
- Wu, Y., Liu, X., Li, X., Li, Y., Zhao, L., Chen, Z., et al. (2006) Estimation of 10-year risk of fatal and nonfatal ischemic cardiovascular diseases in Chinese adults. Circulation, 114, 2217-2225. doi:10.1161/CIRCULATIONAHA.105.607499
- Chan, L. and Sun, Y. (2009) Evaluation of cardiovascular risk assessment models with respect to the clinical interpretation of atherosclerosis in a different type II diabetes cohort. Summit on Translational Bioinformatics, 1-6.
- Wilson, P.W.F., D’Agostino, R.B., Levy, D., Belanger, A.M., Silbershatz, H. and Kannel, W.B. (1998) Prediction of coronary heart disease using risk factor categories. Circulation, 97, 1837-1847. doi:10.1161/01.CIR.97.18.1837
- Anderson, K.M., Wilson, P.W.F., Odell, P.M. and Kannel, W.B. (1991) An updated coronary risk profile: A statement for health professionals. Circulation, 83, 357-363. doi:10.1161/01.CIR.83.1.356
- Cao, J.J., Arnold, A.M., Manolio, T.A., Polak, J.F., Psaty, B.M., Hirsch, C.H., et al. (2007) Association of carotid artery intima-media thickness, plaques, and C-reactive protein with future cardiovascular disease and all-cause mortality: The cardiovascular health study. Circulation, 116, 32-38. doi:10.1161/CIRCULATIONAHA.106.645606
- Baroncini, L.A.V., de Oliveira, A., Vidal, E. and Precoma, D. (2008) Appropriateness of carotid plaque and intimamedia thickness assessment in routine clinical practice. Cardiovascular Ultrasound, 6, 52. doi:10.1186/1476-7120-6-52
- Hanley, J.A. and McNeil, B.J. (1982) The meaning and use of the area under a receiver operating characteristic (ROC) curve. Radiology, 143, 29-36.
- Sniderman, A.D., Furberg, C.D., Keech, A., Roeters van Lennep, J.E., Frohlich, J., Jungner, I. and Walldius, G. (2003) Apolipoproteins versus lipids as indices of coronary risk and as targets for statin treatment. The Lancet, 361, 777-780. doi:10.1016/S0140-6736(03)12663-3
- Koren-Morag, N., Tanne, D., Graff, E. and Goldbourt, U. (2002) Lowand high-density lipoprotein cholesterol and ischemic cerebrovascular disease: The bezafibrate infarction prevention registry. Archives of Internal Medicine, 162, 993-999. doi:10.1001/archinte.162.9.993
- Tirschwell, D.L., Smith, N.L., Heckbert, S.R., Lemaitre, R.N., Longstreth, W.T. and Psaty, B.M. (2004) Association of cholesterol with stroke risk varies in stroke subtypes and patient subgroups. Neurology, 63, 1868-1875. doi:10.1212/01.WNL.0000144282.42222.DA
- Parrinello, G., Colomba, D., Bologna, P., Licata, A., Pinto, A., Paterna, S., Scaglione, R. and Licata, G. (2004) Early carotid atherosclerosis and cardiac diastolic abnormalities in hypertensive subjects. Journal of Human Hypertension, 18, 201-205. doi:10.1038/sj.jhh.1001653
- Benetos, A., Laurent, S., Asmar, R.G. and Lacolley, P. (1997) Large artery stiffness in hypertension. Journal of Hypertension, 15, S89-S97. doi:10.1097/00004872-199715022-00009
- Ridker, P.M. (2003) Clinical application of C-reactive protein for cardiovascular disease detection and prevention. Circulation, 107, 363-369. doi:10.1161/01.CIR.0000053730.47739.3C
- Pearson, T.A., Mensah, G.A., Alexander, R.W., Anderson, J.L., Cannon, R.O., Criqui, M., et al. (2003) Markers of inflammation and cardiovascular disease—Application to clinical and public health practice: A statement for healthcare professionals from the centers for disease control and prevention and the American heart association. Circulation, 107, 499-511. doi:10.1161/01.CIR.0000052939.59093.45
- Niki, E. (2004) Antioxidants and atherosclerosis. Biochemical Society Transactions, 32, 156-159. doi:10.1042/BST0320156
- Jialal, I. and Devaraj, S. (1996) Low-density lipoprotein oxidation, antioxidants, and atherosclerosis: A clinical biochemistry perspective. Clinical Chemistry, 42, 498- 506.
- Dublck, M., Hunter, G., Casey, S. and Keen, C. (1987) Aortic ascorbic acid, trace elements and SOD activity in human aneurysmal and occlusive diseases. Proceedings of the Society for Experimental Biology and Medicine, 84, 138-143.
- Carew, T., Schwenke, D.C. and Steinberg, D. (1987) Antiatherogenic effect of probucol unrelated to its hypocholesterolemic effect: Evidence that antioxidants in vivo can selectively inhibit low density lipoprotein degradation in macrophage-rich fatty streaks and slow the progression of atherosclerosis in watanable heritable hyperlipidemic rabbit. Proceedings of the National Academy of Sciences of the United States, 84, 5928-5931. doi:10.1073/pnas.84.21.7725