Health
Vol.5 No.6A1(2013), Article ID:33124,8 pages DOI:10.4236/health.2013.56A1001
New network and synchronization approaches in focal epilepsy research and treatment
![]()
1Clinical Neurophysiology, Hospital Universitario de la Princesa, Madrid, Spain
2Instituto de Investigaciones Biomédicas Hospital de la Princesa, Madrid, Spain; *Corresponding Author: gjortega.hlpr@salud.madrid.org
3Neurosurgery Service, Hospital Universitario de la Princesa, Madrid, Spain
Copyright © 2013 Jesús Pastor et al. This is an open access article distributed under the Creative Commons Attribution License, which permits unrestricted use, distribution, and reproduction in any medium, provided the original work is properly cited.
Received 2 April 2013; revised 3 May 2013; accepted 30 May 2013
Keywords: Temporal Lobe Epilepsy; Synchronization; Complex Network; Limbic Network; Electroencephalography
ABSTRACT
Traditional approaches to focal epileptic surgery rely in the identification and resection of the epileptic zone. However, a significant minority of epileptic patients continue to experience seizures after surgery, a fact that shows how difficult it is to define this concept. In this work we will review some of the recent advances in the use of complex network theory and synchronization analysis in the study of neurophysiological epileptic records which shed new light on fragmented understanding of the epilepsy dynamic we have today. More important would be the potential treatments which could be implemented from the new information and change of perspective gathered by using this methodology, particularly the substitution of the traditional resective surgery in temporal lobe epilepsy patients.
1. INTRODUCTION
Surgical treatment of drug-resistant epilepsy is the only curative/palliative alternative to eliminate/reduce seizures in some focal epilepsy patients, particularly for those suffering from temporal lobe epilepsy (TLE). In this pathology, seizures are thought to originate in specific areas of the cortex known as seizure onset zones (SOZ) before spreading to other areas known as epileptogenic zones (EZ), some of which overlap with the SOZ. EZ are essential for seizures to propagate [1,2]. Resection or disconnection of these areas, principally the EZ (usually identified as the epileptic focus), from the rest of the brain seems to be the best approach to eliminate seizures in drug-resistant temporal lobe epilepsy patients. However, the real relations among these theoretical areas are yet under debate [3].
In recent years, however, this “single focus” model has been challenged [4] in favor of a network model in which emphasis shifts from the epileptic focus (or foci) toward the properties of the limbic network itself. Even though TLE surgery, in which several structures are resected (a corticectomy and extended amygdalohippocampectomy are typically performed) is a highly successful treatment, it is difficult to determine whether the absence of postoperative seizures is a consequence of the resection (or disconnection) of the focus—which presumably has been correctly localized—or of the destruction of the network topology. Moreover, even if the suspected epileptogenic area is correctly localized in presurgical studies and resected during surgery, a significant minority of patients continue to experience seizures after surgery, thus favoring the concept of an epileptic network pathology.
Under a network point of view many interdisciplinary groups have reanalyzed neurophysiological data coming from epilepsy patients in search of new information which shed light in the poor understanding we have today of this pathology. With the help of the new complex network methodology [5-8], neurophysiological records [9-11] and functional magnetic resonance imaging (fMRI) studies [12] are now under scrutiny in a new attempt to uncover structural and functional characteristics of the epileptic network.
Because a fundamental component in any network approximation is the way that elements in the network interact between them, synchronization studies have increased vastly in the last years. However, modern synchronization assessment in the epilepsy realm is very different from traditional ones.
In the past, it has been hypothesized that a single pathological region was responsible for seizure generation; this “focal” model was based on research that related hippocampal and entorhinal cortex alterations (especially atrophy) and the area of seizure onset [13,14] The first statements in epileptology about the relationship between interictal and ictal activity claimed that the temporal summation and spatial spread of interictal epileptiform discharges (IED) may evolve to ictal discharges resulting in the electroclinical seizure. Subsequent studies showed that there is no such a causal relationship between IED and the seizure [15]. The analysis of spatio-temporal relationships between seizure activity and occurrence of spikes has given birth to numerous studies suggesting that identification of leading regions involved in interictal activity could help to tailor resections and thus improving seizure control [16]. These studies described the morphology of the interictal paroxismal events by introducing two classes of them, primary and propagated, with the intention to characterize their spatio-temporal distribution in EEG signals. The goal would be to determine the origin of the interictal spikes and the propagation schemes. In doing so, priority is given to the co-occurrence of information, particularly in temporal lobe epilepsy studies. With this idea Bourien and colleagues’ in 2005 [17] proposed a method that automatically builds subsets of structures that are conjointly evolved in the generation of interictal spikes, they believed that the analysis of the interictal activity should be directed towards investigating the relationships between subsets of structures involved in interictal activity and subsets of structures involved in ictal activity at seizure onset.
Although the first descriptions of the synchronization phenomena were made in the 50s, one of the earliest demonstrations of synchronization at a large scale was made in 1994 by Spencer and Spencer [18], demonstrating simultaneous occurrence of IED in distant areas in epileptic patients. Since then the word synchronization and IED are closely linked to each other. On the other side, contemporary works on synchronization rely on the full signal synchronization instead of IED synchronization as it was traditionally done.
As a consequence of the above issues, networks and synchronization are two recurrent topics in many modern works on epilepsy research. In this work we will show some of the recent advances in synchronization analysis and network methodologies applied over epileptic records. We will focus on electro-corticographic (ECoG) records and foramen ovale electrodes (FOE) from TLE patients. Both kinds of records are routinely performed in our center on drug resistant TLE patients whether prior or during the respective surgery.
In the Methods section we will give a brief review of some network and synchronization methodologies routinely used in the analysis of neurophysiological records from epileptic patients. The Results section will summarize our main findings by using these kinds of analysis. Discussion section will be devoted to discuss how and to what extent network and synchronization analysis help in improving our understanding of epilepsy dynamics and more important, how this knowledge could be used to improve epilepsy patient’s condition.
2. METHODS
2.1. Complex (Brain) Networks
A complex network is traditionally defined in the context of graph theory, a branch of mathematics aimed to study a collection of nodes linked by edges. However, the graphs studies under the complex network approach are usually of a more complicated (non-trivial) topology, with an intrinsic diversity in links and nodes, greater size (number of nodes and links), and with individual network’s node dynamics. The main objective in analyzing complex network is to characterize the network and describe its principal features, usually in a statistical fashion. In order to do that, several measures have been proposed in recent years with that objective [19,20]. As a first step, two kinds of features can be used to characterize a complex network.
Firstly community structure in a network gives important information regarding clusters or groups of nodes with similar behavior; therefore it is highly related with synchronized behavior and will be presented in the next subsection.
Secondly, centrality measures highlight the importance of particular nodes in the network. In large network its statistical distribution is of extraordinary importance. Among the most important existing centrality measures we will mention the following:
• The clustering coefficient quantifies the number of connections existing between the nearest neighbors of a node as a proportion of the maximum number of possible connections. A high value of the clustering coefficient in a particular node should be interpreted as high local efficiency in information transfer of that node.
• Local synchronization quantifies synchronization activity between a particular node and its first neighbors. It is defined as the sum of a particular synchronization measure (i.e. Pearson coefficient) between a particular node and its neighbors, normalized by the quantity of neighbors. It has been very useful in analyzing ECoG, as will show in the next section.
 (1)
(1)
• Where LSi is the local synchronization of node i, nij the number of its first neighbors and rij a synchronization measures as the Pearson correlation, for instance.
• Betweenness centrality of a particular node i is defined as the ratio of shortest paths between two any nodes in the network that pass through node i to the total number of shortest paths in the network. Thus betweenness centrality quantifies the importance of a given node in the network relative to information transfer, but from a global point of view. High betweenness centrality nodes have been related with EZ by using a band limited analysis [9].
2.2. Synchronization
As noted above, community structure detection is an important characterization in network analysis. Identification of groups of nodes tightly connected between them is a useful tool to understand the structure and dynamics of the network itself. Certainly the way in which connectivity is defined in the network plays a central role at the time to identify clusters of tightly connected nodes.
The issue of network connectivity in neuroscience was clearly stated several years ago by Fiston [21], with the concept of functional connectivity as the temporal correlation between two cortical areas. One way to estimate the functional connectivity between two distant sites is by using any of the common measures of association, as we will show in the next subsection. Note that functional connectivity does not involve causality, a more delicate issue that is encompassed under the subject of effective connectivity. Lastly structural connectivity depends mainly of the neuroanatomical links between two areas.
Among the many existing synchronization measures, we will use mainly two of them in order to estimate functional connectivity, namely:
• Pearson correlation is the classical linear measure of association between two time series of N data points each, xi and xj, at times k, that can be estimated by
 (2)
(2)
In this way rij is the linear correlation between the time series of node i and the time series of node j.
• Phase synchronization. This is a very important generalization of the coherence function, a correlation coefficient in the frequency domain, aimed to deal with nonlinear oscillators and stochastic systems. We have used it in several cases to corroborate functional connectivity calculated by Eq.2.
The above synchronization measures are generically known as similarity measures in the sense that two time series are similar when the synchronization measure is close to 1. In many circumstances is preferable to use a distance-like measure such that it measure dissimilarities, that is
 (3)
(3)
In this way two synchronized time series i and j will show comparable behavior and thus will have a distance d(i,j) close to zero.
3. RESULTS
3.1. Synchronization Clusters and Their Stability
Local functional connectivity in the lateral temporal cortex in TLE patients was evaluated using three different synchronization measures (Pearson correlation, phase synchronization and mutual Information). Synchronization matrices were obtained for each of the three methods using intraoperative ECoG data from 29 drug-resistant TLE patients [21]. In Figure 1 an actual and an approximate representation of the electrodes location over the ipsi-lateral temporal cortex is depicted. By using Eq.1, an estimate of the local synchronized activity was obtained for each of the 20 electrodes in the lateral cortex.
The three synchronization measures produced similar results, thus, we will show principal findings only for Pearson correlation coefficient. Figure 2 is a typical example of a local synchronization pattern. Reddish coloring represents highly synchronized activity. It is readily apparent the existence of a “cluster” of highly synchronized activity in the antero-superior part (T1 gyrus) of the temporal lobe. Moreover, it is also apparent that synchronized activity is sharply distributed around electrode #11 (see Figure 1 for electrode locations). During the resective surgery, most of that synchronization cluster was removed, including the cortical area under electrode #11 (red lines in Figure 2). Interesting enough is the
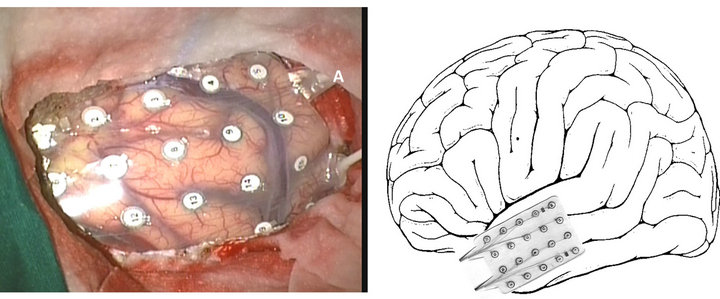
Figure 1. Actual (left) and represented (right) ECoG grid placed over the lateral side of temporal lobe.
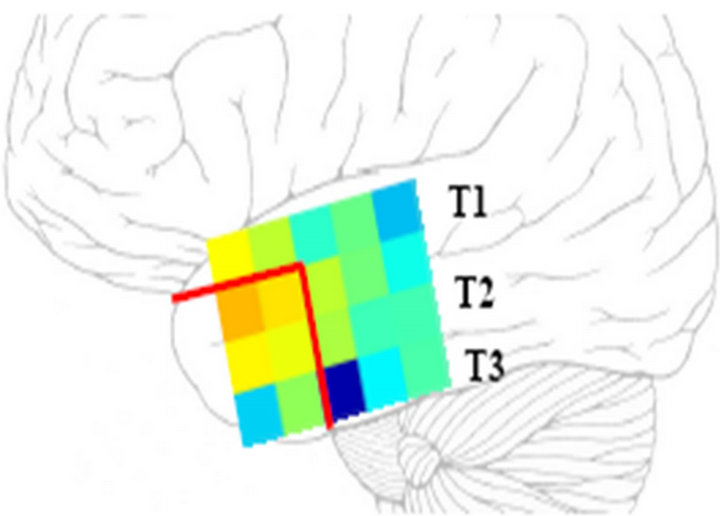
Figure 2. Representation of local synchronization pattern in the temporal lobe. See main text for explanations.
surgery outcome; the patient remained free of seizures after the surgery.
The above fact leads us to explore the role played by synchronization clusters in TLE. We have analyzed 29 ECoG data over the lateral cortex in the temporal lobe, lasting typically 3 - 5 minutes each, sampled at 200 Hz. Temporal windows of 1024 data points have been used to estimate local synchronization. Our main findings [21] can be summarized stating that surgical removal of sharply defined synchronization clusters correlates with absence of post-operative seizures. On the other side, when synchronization clusters are blurry, not sharply, defined, removal of these areas does not seem to be crucial in seizure elimination.
In order to dig further into the above findings we have analyzed another sample of ECoG data from 20 drugresistant TLE patients [22]. In this case, however, a mesial strip of 8 electrodes was also located through the Sylvian fissure recording electrical activity in the mesial area of the temporal lobe. Lateral (grid) and mesial (strip) electrodes were always placed in the ipsi-lateral temporal lobe.
Interictal temporal stability of synchronization clusters was investigated. In order to do that the coefficient of variations, CV = s/m was used, such that s is the temporal variability and m the mean value of LS (Eq.1) across several temporal windows. In this way a CVi is obtained for each electrode location i, whether in the lateral or mesial side of the temporal lobe. Note that CV definition allows evaluating simultaneously those areas with high intensity and low temporal variations in local synchronization. In fact, low values of CV imply that local synchronization activity is high and relatively stable across the temporal windows. If synchronization clusters are involved in seizure appearance and therefore should be removed during the surgery, studying its temporal stability is certainly of great importance. Surgery thus should be designed to eliminate those more stable synchronization clusters, or equivalently, those areas with low values of CV.
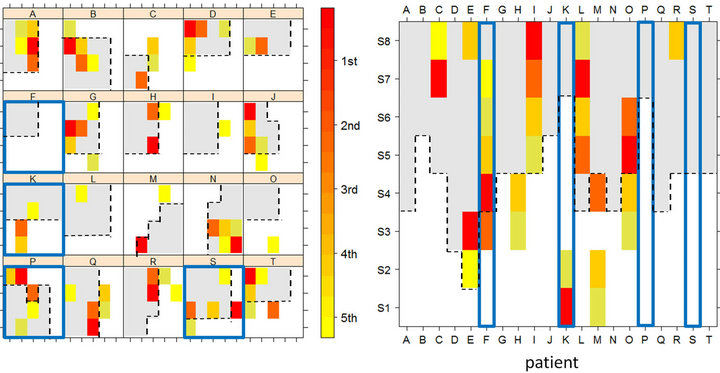
In order to find those areas with low CV values we have calculated CV for each electrode location and after that, CV were ordered from minimum to maximum values. In Figure 3 we represent the five lower values of CV (red is the 1st minima and yellow is the 5th minima) for each patient. Panel A displays CV locations in the lateral side (grid) and panel B displays CV locations in mesial area (strip). Gray areas represent the resected tissue during the surgery. Lastly, those patients with a bad surgery outcome, that is, with post-operative seizures, are in squared in blue color (patients F, K, P and S).
It is readily apparent in Figure 3 that resection of those areas with low values of CV will result in a good surgery outcome. On the other side, when cortical areas with low values of CV are not removed during the surgery the patient will continue with seizures after the surgery. By using a sophisticated statistical analysis [23] we have validated the aforementioned findings in a group of 20 TLE patients.
3.2. Synchronization Clusters and Other Network Measures
When analyzing complex network several measures can be defined over the network’s nodes, as we noted previously in the Methods section. So far we have shown that local synchronization, i.e. Eq.1 plays a central role in seizure appearance, however, other possibilities should be explored too.
We have addressed this important question in the following way. By using once more ECoG intraoperative records, as described in the above section, two other measures have been employed, in addition to local synchronization. On the one side, we have look for whether cortical locations which are highly connected with other cortical sites would play any role in seizure appearance. Because the information provided by this measure is of a global character, not local, we call it global critical node 1. Global information across a particular node can also be evaluated by using the betweenness centrality, as reviewed in the Method section.
 (a) (b)
Figure 3. Representation of stable local synchronization activity in temporal lobe. Panel A: locations of minima values in CV in the electrodes grid; Panel B: locations of minima values in CV in the electrode strip.
However, instead of using the full network, as in the previous case, we have used a simplified version of the network, a construction known as Minimum Spanning Tree (MST). As reviewed in the Method section, it is easy to convert correlation between pairs of nodes (Eq.1) to distances (Eq.3), such that highly synchronized nodes appear more “close” one to each other. The MST of a graph with N (28 in our case) nodes is a planar graph with N-1 edges connecting the 28 nodes and of minimum total length. There are no loops in the MST and it is useful to think the MST as displaying the most important links in the network.
ECoG records from 5 drug-resistant TLE patients were analyzed [24]. As in the above cases a grid of 4 × 5 electrodes was placed over the external part of the temporal lobe (lateral temporal cortex) and a strip of eight electrodes was placed into the mesial part of the temporal lobe (through the Sylvian fissure). In this way, electrical activity at both sides of the lobe is registered.
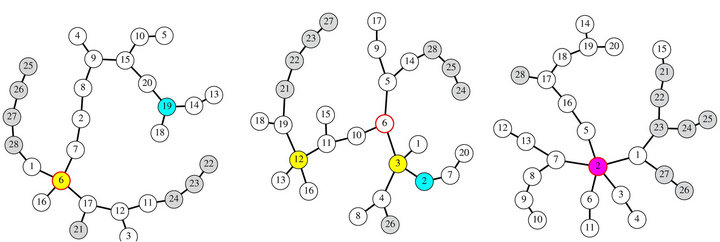
In each patient, three particular nodes were identified in the MST, namely: the area with higher local synchronization, the most connected node and the node with higher betweenness. In Figure 4 a representation of the MST for three patients is depicted. In each case identification of critical nodes is performed, that is: Highest synchronization area is represented by a cyan circle; nodes with highest connectivity are represented by yellow circles and the node with the highest betweenness is represented by red-border circle. Panel C in that figure shows a coincidence of the three measures in node 2, represented by a magenta circle. In all these figures, mesial (strip) electrodes are painted in gray.
By identifying locations of these three centrality measures in each MST and looking at whether these sites where removed during the surgery, a rough idea can be obtained of the role played by them in seizure appearance. For instance, the MST of panel A in Figure 4 displays two critical nodes, #6; concurrence of the highest betweennees and highest connectivity and #19; highest synchronization area. The resected tissue during the surgery encompasses node #6 but not the node #19 a fact which suggests that the highest connectivity and betweennes would not to play a central role in seizure appearance. This conclusion came from the surgery out
 (a) (b) (c)
Figure 4. Minimum spanning tree and critical nodes in three different patients. See main text for further details.
come; the patient remains with post-operative seizures (Engel IIB). Moreover, surgery outcome strengthen the hypothesis that local synchronization sites seems to be involved in seizure appearance; in this case with postoperative seizures, maximum local synchronization area was not resected. From a therapeutic point of view is perhaps more interesting the case in panel C. In this case, all of the three network critical nodes are located at the same cortical site, node #2, which was removed during the surgery. In this case, and with little tissue extent removed during the surgery, the patient remains free of seizures after the surgery.
All in all, identification of critical nodes seems to be a powerful tool to uncover epileptic brain dynamics. Our results show that linking this kind of information with the surgery characteristics and performance, it is possible to formulate new models of epileptogenic activity.
3.3. Mesial Synchronization Imbalance
An alternative way to record cortical activity in TLE patients is by using FOE, a semi-invasive method fundamentally aimed to lateralize seizures, i.e. which side is responsible. By using a network approach we have analyzed neurophysiological records of FOE in a group of 17 TLE patients [25]. In each patient, six-contact platinum FOE with 1-cm center-to-center spacing were inserted bilaterally under general anesthesia through the foramen ovale hole and recording activity from the inner part of the temporal lobe, mainly from enthorinal cortex. Interictal records (sampled at 200 Hz) of approximately one hour were used. In addition to the 12 (6 + 6) FOE time series, standard 10 - 20 scalp EEG time series were analyzed simultaneously. Each multivariate time series was segmented in non-overlapping windows of 2048 data points.
As describe in the method section, correlation (Eq.1) was calculated for each pair of electrodes (scalp + FOE) and converted to distances (Eq.3). By using the distance matrix, in each temporal window, a hierarchical tree was constructed, as the one displayed in Figure 5 (left panel).
As can be seen in Figure 5, left FOE electrodes (L1 to L6) are tightly synchronized, as demonstrated by the small distance between them. Right FOE (R1 to R6) are partially synchronized because, though R1, R2, R3 and R4 belong to the cluster of mesial activity, i.e. L1-L6, R1-R4 (black ellipse). However, two of the right FOE R5 and R6 seem to be isolated from the rest of mesial activiity. In the right panel of Figure 5, a representation of scalp and FOE location is depicted. Electrodes belonging to a particular synchronization cluster are colored identically. For instance scalp o2-t4-c4 and o1-t3-c3 form two tight synchronized clusters. As mentioned above, a large synchronization cluster appears in the mesial area, colored in green in the right panel of Figure 5. Even though
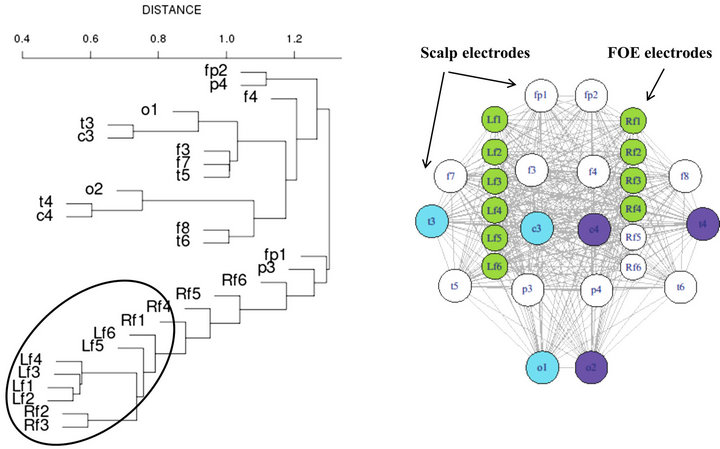
Figure 5. FOE interictal mesial desynchronization. See main text for further explanations.
most of mesial FOE belong to that cluster, and therefore are tightly synchronized, two of the rights FOE seem to behave in an apparently independent fashion. This fact is intriguing mostly because that record comes from a right TLE patient.
In order to explore more in deep the aforementioned fact we have analyzed FOE records from 17 TLE patients [25]. In each case, we have repeated the above procedure, obtaining a hierarchical tree in each temporal window. At this step, an automatic procedure to identify synchronization clusters was implemented. More important nonetheless is the identification of independent or desynchronized electrodes, that is, those sites not synchronized with the rest of the mesial area.
Our results showed a clear imbalance in regard to mesial synchronization activity, which additionally provides a trustable lateralization method. Specifically, the number of desynchronized electrodes is significantly greater in the ipsi-lateral side. These results were carried out using several synchronization measures in order to achieve a considerable confidence [25]. As compared with traditional video-EEG studies, the methodology described would reduce the analysis time drastically to one or two hours of interictal activity, at most.
4. DISCUSSION
In this work we have showed some applications of network and synchronization analysis of neurophysiological TLE records. Briefly, our results can be summarized in the following two main findings:
• There exist local synchronization clusters in the temporal lobe, whether in the mesial or lateral area. Resection of these areas seems to results in a good surgery outcome. Moreover, these areas also display very stable dynamics, as was demonstrated by its lowest CV.
• Desynchronization also seems to play a central role during the interictal period. FOE activity shows that contralateral activity, all in all, is much more synchronous that ipsi-lateral activity. It seems that interictal synchronization imbalance plays a central role in seizures appearance.
Are these findings contradictory? We think not. At least in TLE patients, there exist certain areas with highly localized and stable synchronization activity. This heterogeneity in the synchronization activity seems to be the principal cause of an overall desynchronization, at least in the mesial side of the temporal lobe, as measured by FOE.
Is this information relevant to explain seizure initiation and propagation? We think yes. Certainly the very existence of local areas with highly synchronized activity may favor ictogenesis through a mechanism similar to seizure initiation in the classical view of focal seizures. The stable character of these synchronized areas may favor the predisposition of an epileptic brain to originate seizures.
Propagation, on the other side, could be facilitated by the presence of several local areas with very different interictal synchronization states. One point to be remarked in this regard is that propagation of seizures to distant areas is generally much faster than the predicted horizontal intracortical rate of 6 - 18 cm/s, suggesting the existence of several routes, instead of a single intracortical spread [26-28]. Propagation through white matter and subcortical nuclei-mediated spread may enable the seizure to reach distant cortical areas very fast. Ictal information reaching areas of high local synchronization may enhance the synchronizability of the whole network, giving rise to the onset of seizures.
Could this information be useful in changing the present surgical treatment for drug-resistant epileptic patients? At the very moment and considering this framework, we are tailoring resection by ECoG not limited to lateral cortex, but we are although evaluating the remnant irritative activity in mesial structures after the lateral cortex have been removed. Besides, bearing in mind that resective surgery is a highly invasive treatment, though very effective at least in TLE patients, in a proximal future, alternative therapies should always be considered at the light of new results. In this regard, we think that two types of approaches can be explored.
Firstly, even though cluster analysis is based on ECoG data, which requires an intra-operative procedure, it would be possible to extend this kind of study to noninvasive recordings like magneto-encephalography (MEG) or high resolution multi-channel EEG. If this kind of analysis would yield similar results as those reported here, it would be possible to explore new non-invasive therapeutic procedures in focal epilepsy. Localization and identification of synchronization clusters by using MEG, for instance, could be followed by destruction of these areas by gamma-knife surgery, with no need for an invasive surgery.
Secondly, one could speculate that the synchronization imbalance between both mesial sides may be ‘‘balanced’’ by electrical stimulation through a device chronically implanted, similar to the electrodes currently used for deep brain stimulation.
Notwithstanding, in order to develop and apply this methodology in a more confident way, much more research is needed. The aforementioned findings would eventually provide us with a deeper knowledge of current devices applications.
5. ACKNOWLEDGEMENTS
This work was supported by grants from Instituto de Salud Carlos III (projects PI12/02839 and PI10/00160).
REFERENCES
- Chou Dichter, M.A. (1997) Basic mechanisms of epilepsy: Targets for therapeutic intervention. Epilepsia, 389, S2- S6. doi:10.1111/j.1528-1157.1997.tb05200.x
- Rosenow, F. and Luders, H. (2001) Presurgical evaluation of epilepsy. Brain, 124, 1683-1700. doi:10.1093/brain/124.9.1683
- Pastor, J., Menéndez de la Prida, L., Hernando, V. and Sola, R.G. (2006) Voltage sources in mesial temporal lobe epilepsy recorded with foramen ovale electrodes. Clinical Neurophysiology, 117, 2604-2614. doi:10.1016/j.clinph.2006.07.311
- Spencer, S.S. (2002) Neural networks in human epilepsy: Evidence of and implications for treatment. Epilepsia, 43, 219-27. doi:10.1046/j.1528-1157.2002.26901.x
- Albert, R. and Barabási, A.-L. (2002) Statistical mechanics of complex networks. Reviews of Modern Physics, 74, 47-97. doi:10.1103/RevModPhys.74.47
- Boccaletti, S., Latora, V., Moreno, Y., Chavez, M. and Hwang, D.-H. (2006) Complex networks: Structure and dynamics. Physics Reports, 424, 175-308. doi:10.1016/j.physrep.2005.10.009
- Sporns, O., Chialvo, D.R., Kaiser, M. and Hilgetag, C.C. (2004) Organization, development and function of complex brain networks. Trends in Cognitive Sciences, 8, 418-425. doi:10.1016/j.tics.2004.07.008
- Barrat, A., Barthelemy, M. and Vespignani, A. (2008) Dynamical processes on complex networks. Cambridge University Press, Cambridge.
- Wilke, C., Worrell, G. and He, B. (2011) Graph analysis of epileptogenic networks in human partial epilepsy. Epilepsia, 52, 84-93. doi:10.1111/j.1528-1167.2010.02785.x
- Ponten, S.C., Douw, L., Bartolomei, F., Reijneveld, J.C. and Stam, C.J. (2009) Indications for network regularization during absence seizures: Weighted and unweighted graph theoretical analyses. Experimental Neurology, 217, 197-204. doi:10.1016/j.expneurol.2009.02.001
- Van Dellen, E., Douw, L., Baayen, J.C., Heimans, J.J., Ponten, S.C., Vandertop, W.P., Velis, D.N., Stam, C.J. and Reijneveld, J.C. (2009). Long-term effects of temporal lobe epilepsy on local neural networks: A graph theoreticcal analysis of corticography recordings. PLoS ONE, 4, e8081. doi:10.1371/journal.pone.0008081
- Zhang, Z., Lu, G., Zhong, Y., Tan, Q., Liao, W., Chen, Z., Shi, J. and Liu, Y. (2009) Impaired perceptual networks in temporal lobe epilepsy revealed by resting fMRI. Journal of Neurology, 256, 1705-1713. doi:10.1007/s00415-009-5187-2
- King, D., Spencer, S., McCarthy, G. and Spencer, D. (1997) Surface and depth EEG findings in patients with hippocampal atrophy. Neurology, 48, 1363-1367. doi:10.1212/WNL.48.5.1363
- Bernasconi, N., Bernasconi, A., Andermann, F., Dubeau, F., Feindel, W. and Reutens, D.C. (1999) Entorhinal cortex in temporal lobe epilepsy: A quantitative MRI study. Neurology, 52, 1870-1876. doi:10.1212/WNL.52.9.1870
- Katz, A., Marks, D.A., McCarthy, G. and Spencer, S.S. (1991) Does interictal spiking change prior to seizures? Electroencephalography and Clinical Neurophysiology, 79, 153-156. doi:10.1016/0013-4694(91)90054-8
- Alarcon, G., Garcia Seoane, J.J., Binnie, C.D., Martin Miguel, M.C., Juler, J., Polkey, C.E., Elwes, R.D.C. and Ortiz Blasco, J.M. (1997) Origin and propagation of interictal discharges in the acute electrocorticogram. Implications for pathophysiology and surgical treatment of temporal lobe epilepsy. Brain, 120, 2259-2282. doi:10.1093/brain/120.12.2259
- Bourien, J., Bartolomei, F., Bellanger, J.J., Gavaret, M., Chauvel, P. and Wendling, F. (2005) A method to identify reproducible subsets of co-activated structures during interictal spikes. Application to intracerebral EEG in temporal lobe epilepsy. Clinical Neurophysiology, 116, 443- 455. doi:10.1016/j.clinph.2004.08.010
- Spencer, S.S. and Spencer, D.D. (1994) Entorhinal-hippocampal interactions in medial temporal lobe epilepsy. Epilepsia, 35, 721-727. doi:10.1111/j.1528-1157.1994.tb02502.x
- Stam, C.J. and Reijneveld, J.C. (2007) Graph theoretical analysis of complex networks in the brain. Nonlinear Biomedical Physics, 1, 3. doi:10.1186/1753-4631-1-3
- Bullmore, E. and Sporns, O. (2009) Complex brain networks: Graph theoretical analysis of structural and functional systems. Nature Reviews Neuroscience, 10, 186- 198. doi:10.1038/nrn2575
- Friston, K.J., Frith, C.D. and Frackowiak, R.S.J. (1993) Time-dependent changes in effective connectivity measured with PET. Human Brain Mapping, 1, 69-79. doi:10.1002/hbm.460010108
- Ortega, G.J., Menendez de la Prida, L., Sola, R.G. and Pastor, J. (2008) Synchronization clusters of interictal activity in the lateral temporal cortex of epileptic patients: Intraoperative electrocorticographic analysis. Epilepsia 49, 269-280. doi:10.1111/j.1528-1167.2007.01266.x
- Palmigiano, A., Pastor, J., Garcia de Sola, R. and Ortega, G.J. (2012) Stability of synchronization clusters and seizurability in temporal lobe epilepsy. PLoS ONE, 7, e41799. doi:10.1371/journal.pone.0041799
- Ortega, G.J., Sola, R.G. and Pastor, J. (2008) Complex network analysis of human ECoG data. Neuroscience Letters, 447, 129-133. doi:10.1016/j.neulet.2008.09.080
- Ortega, G.J., Peco, I.H., Sola, R.G. and Pastor, J. (2011) Impaired mesial synchronization in temporal lobe epilepsy. Clinical Neurophysiology, 122, 1106-1116. doi:10.1016/j.clinph.2010.11.001
- Pastor, J., Garcıa de Sola, R. and Ortega, G.J. (2012) Hyper-synchronization, de-synchronization, synchronization and seizures. In: D. Stevanovic, Ed., Epilepsy—Histological, Electroencephalographic and Psychological Aspects, InTech, ISBN: 978-953-51-0082-9. doi:10.5772/31004
- Milton, G.J., Chkhenkeli, S.A. and Towle, V.L. (2007) Brain connectivity and the spread of epileptic seizures. Handbook of Brain Connectivity Understanding Complex Systems, 477-503. doi:10.1007/978-3-540-71512-2_17
- Kandel, E.R., Schwartz, J.H. and Jessell, T.M. (2000) Principles of Neural Science. 4th Edition, McGraw-Hill, New York.