Health
Vol. 4 No. 9 (2012) , Article ID: 23026 , 4 pages DOI:10.4236/health.2012.49087
Measuring the immeasurable? Operationalising social capital in health research
![]()
1Department of General Practice and Primary Health Care, Ghent University, Ghent, Belgium; *Corresponding Author: HUVeerle.Vyncke@UGent.beU
2Research Foundation Flanders (FWO), Brussels, Belgium
3Department of Rehabilitation Sciences and Physiotherapy Ghent, Artevelde University College, Ghent University, Ghent, Belgium
Received 2 July 2012; revised 2 August 2012; accepted 14 August 2012
Keywords: Social Capital; Measuring; Measurement; Operationalisation
ABSTRACT
During the last decennia, social capital has been a popular topic in social sciences. However, the concept is often used as a “catch all” for divers social characteristics. Consensus on how the concept should be measured is lacking. This keeps health researchers from drawing firm conclusions on the influence of social capital on health and hampers the decision on which social capital indicators to use in health research. This study compares five ways to operationalise social capital (generalized trust, a social network index, an expanded social network index, bonding, bridging and linking social capital and a multidimensional social capital index) in their ability to explain self-rated health and pain. To evaluate the models’ capacity to explain health, two logistic regression models were built, resulting in Nagelkerke R2 measures. Data were collected in a cross-sectional study in eight neighbourhoods in the region of Ghent (Belgium) by randomly sampling 50 adult inhabitants per neighbourhood. Findings show that the explanation of the observed variance in health by the studied social capital models ranges from 1.9% to 23.1%, but is more pronounced for self-rated health than for pain. The multidimensional social capital index explains most of the variance in health, but poses an important strain on the respondents due to a large number of surveyquestions. With some prudence, we presume that the explanatory added value of the more extended social capital models is rather limited from a practical point of view as the addition in explained variance of the other models seems not in relation to the number of questions needed. Researchers should weigh up the pros and cons of different manners to measure social capital carefully, taking the goals and focus of their study into account.
1. INTRODUCTION
In the last decades, the concept social capital has gained growing interest in diverse scientific disciplines [1]. Social capital has been explored in relation to schooling and education, economy, governance, criminology and other fields [2]. However, in none of these disciplines the importance of the concept is as explicitly emphasized as in the literature on health and well-being [3]. Social capital has been related to mortality, morbidity, self-rated health, physical and mental health [2,4-8]. Even though the popularity of the concept has increased, its rise has not been welcomed uncritically. An important reason for this criticism is the lack of clarity that surrounds the concept [5]. This might be explained by the numerous research traditions in which the concept has been studied as well as the different backgrounds of researchers interested in the subject [9,10].
An important point of disagreement in social capital research concerns the level on which the concept is operationalised; can social capital be the property of individuals or is it a community characteristic [11,12]? One of the founding fathers of the theory on social capital, Robert Putnam, defines the concept as “features of social organization such as networks, norms, and social trust that facilitate coordination and cooperation for mutual benefit” [13]. This definition reflects Putnam’s opinion of social capital as a community characteristic. By contrast, others consider social capital to be an individual characteristic and therefore define the concept as the ability of individuals to command scarce resources by virtue of their membership in networks or broader social structures [9,14].
Another frequently mentioned point of criticism is that the all-encompassing interpretation of the concept used in research limits its practical applicability [15]. The term “social capital” is used to refer to an extensive number of different social characteristics at the individual, group, institutional and state level [9,16]. The lack of congruence in ways of defining social capital prevents researchers from drawing firm conclusions about the concept, its effects and the pathways through which it acts [16]. It also hinders the comparability between different studies [9,11,17] and may hamper focused strategic implementation of the concept in practice.
Consequently, this conceptual lack of clarity is reflected in the ways used to measure social capital. Researchers have used a wide range of indicators to operationalise the concept [17,18], starting from different theoretical backgrounds. The number of survey questions used to measure the concept varies, ranging from one question to a large number of questions used to calculate a scale or overall sum score.
Deciding on how to include social capital in health research can be challenging. This study highlights common, yet different, ways to operationalise social capital. It focuses on the pragmatic reduction of social capital to generalized trust, the measurement of social networks, the measurement of bonding, bridging and linking social capital as well as a multidimensional and complementary measurement of different components of social capital.
1.1. Generalized Trust
For pragmatic reasons, researchers usually try to capture the essence of the broad concept social capital in a limited number of indicators. In this approach, scholars often use the indicator “generalized trust” [12,19], which reflects the trust one has in people in general. This indicator is included in various questionnaires, such as the Social Capital Community Benchmark Survey1, the Social Capital Questionnaire by Onyx and Bullen [20], the European Social Survey2, the General Household Survey3 and the World Values Survey4.
1.2. Social Networks
The belief that social networks act upon practically all aspect of people’s lives has increasingly found its place in social sciences [21]. With his pioneering work “Le Suicide” [22], Emile Durkheim was among the first to empirically explore the influence of social networks on health by contributing rising suicide rates to a lack of social cohesion and increasing feelings of anomie. Since then, numerous studies have underlined the influence of social networks on different aspects of health [4,9, 23-24].
Today, the concept “social networks” is a central concept in social capital literature, especially in the literature that defines social capital as an individual characteristic. One of the social capital “schools” defines social capital as the “resources embedded within people’s social networks” [17]. As described by Henk Flap, “people will invest in relations with others in view of the perceived future value of the social resources made available by these relations” [21].
Different approaches can be followed to measure social capital within this theoretical tradition. One possibility is to measure the resources embedded in one’s social networks directly. This is the aim of instruments such as the “position generator” [25] which measures the social prestige associated with network members’ social position or the “resource generator” [26] which measures specific resources available in the respondent’s network. These specifically developed social capital instruments however have rarely been used in health sciences. Another possibility to measure social capital, more frequently used in relation to health, is to make use of instruments which focus on characteristics of the respondent’s social network, such as network size, network composition, the strength of ties and the feelings of trust and reciprocity present in the networks. An example of such a questionnaire is the Social Network Index [24], which inquires the respondents’ participation in 12 distinct social networks by investigating the number of people one has regular contact with.
1.3. Distinction between Bonding, Bridging and Linking Social Capital
In 2000, Robert Putnam described the distinction between bonding and bridging social capital. Recently, Szreter and Woolcock [10] elaborated on this distinction by describing a third form of social capital: linking social capital. They define bonding social capital as “trusting and co-operative relations between members of a network who see themselves as being similar”. Bridging social capital, on the other hand, refers to trusting and reciprocal relationships between people who do not consider themselves alike on specific socio-demographic characteristics. The added dimension, linking social capital, is defined as “norms of respect and networks of trusting relationships between people who are interacting across explicit, formal or institutionalized power or authority gradients in society” [10]. Although some researchers have criticised this theoretical development [27-29], others underline the added value that this conceptual elaboration could offer [30]. It is believed that the distinction between bonding, bridging and linking social capital could contribute to more clear and detailed evidence on the relationship between social capital and health [5] and thus to the public health research [12,31].
However, this conceptual contribution is not reflected in the empirical research field; to our knowledge, no published health study has measured bonding and bridging as well as linking social capital according to the definitions formulated by Szreter and Woolcock [10].
1.4. The Complementary Measurement of Different Components of Social Capital
Social capital is a broad “umbrella term”, used to refer to a wide variety of social factors. There is a growing consensus that social capital has to be measured in a way that matches its multidimensionality, by collecting information on different dimensions of the concept [32]. However, agreement on the precise composition of the components that make up the broad concept social capital is lacking.
1.5. Aims
The aim of this study is to assess to what extent five manners to measure social capital at the individual level can explain the variance in two health outcomes: selfrated health and pain. More specifically, we focus on generalized trust, a social network index, an expanded social network index, the distinction between bonding, bridging and linking social capital as well as a multidimensional social capital index.
2. METHODS
2.1. Design, Population and Sample
A cross-sectional study was set up in eight neighbourhoods in the region of Ghent, a densely populated area in the northern part of Belgium. The neighbourhoods were purposively selected, aiming for a maximal variance in socio-economic and geographic characteristics (level of deprivation, level and type of urbanisation). The inhabitants of the selected neighbourhoods were invited to participate in the study if they met specific criteria: they had to be older than 18, officially reside in the neighbourhood, have the Belgian nationality and have sufficient language skills to complete the survey. People living in residential settings (e.g. nursing homes) were excluded.
2.2. Instrumentation
The self-administered questionnaire is composed of questions on the respondents’ health, their social capital, socio-economic and demographic characteristics. Cognitive interviews are used to assess the comprehensibility and acceptability of the questions and the meaning respondents give to the used key concepts. Thirteen individual cognitive interviews were conducted with people with a low degree of schooling, as they can be considered as the “lower limit” regarding comprehensibility. These participants were purposely sampled based on age and mother tongue. Based on the findings of these pretesting interviews, minor changes were made to the questionnaire before further use in the study, mainly on specific terms and expressions used in the questionnaire and on the questionnaire’s structure.
2.2.1. Independent Variables: Social Capital
A set of questions was composed to assess the ability of five approaches to operationalise social capital (further referred to as “five models”). Where possible, existing and validated questionnaires were used.
In general, the questionnaire covers six components of the broad concept “social capital”. The presence of social networks, the magnitude of social networks and the behaviour of the respondent in these networks are explored to measure the structural components of social capital. Furthermore trust, the strength of ties (proxy for reciprocity) and the available resources in the network are included to measure the cognitive components of social capital.
The questionnaire focuses on twelve different social networks, namely relationships within the neighbourhood, relationships with schoolmates, workmates, members of religious groups, the partner, children, parents, in-laws, other close family members, friends, fellow volunteers and fellow members in groups without religious affiliation (e.g. social or recreational groups). For all twelve networks, the availability and size of networks are inventoried, as is the number of people one talks to on a regular basis, the number of people one trusts and the number of people one feels close to. For four specific networks (i.e. partner, close family members, friends and fellow members in groups without religious affiliation), information on the composition of the networks is also gathered. For these four networks, information is inquired at the level of personal income, the educational level, the religious adherence and the ethnicity of the network members. The number of network members that work in the health care sector was also investigated for these specific four networks.
One of the included cognitive components of social capital is trust. Three dimensions of trust are distinguished in the questionnaire: personalized, generalized and institutional trust. Personalized trust is reflected by the number of network members one trusts. Generalized trust refers to trust one has in people in general. The trust one has in his/her general practitioner on the one hand and doctors in general on the other hand are considered indicators of institutional trust.
In total, 83 social capital-related questions were included in this questionnaire. Based on these questions, five different models to operationalise social capital are composed. The number of questions needed to form each of these models varies from 1 to 83. Table 1 gives an overview of the theoretical basis of each of the models, the manner in which the theoretical concepts are operationalised and the number of questions used in each model.
2.2.1.1. Model 1: Generalized Trust
To be able to assess the value of a delimited social capital model, the first model comprises one single variable. This measure is based on the question “Would you say, in general, that most people can be trusted?” A four-point Likert scale was offered to answer this ques-

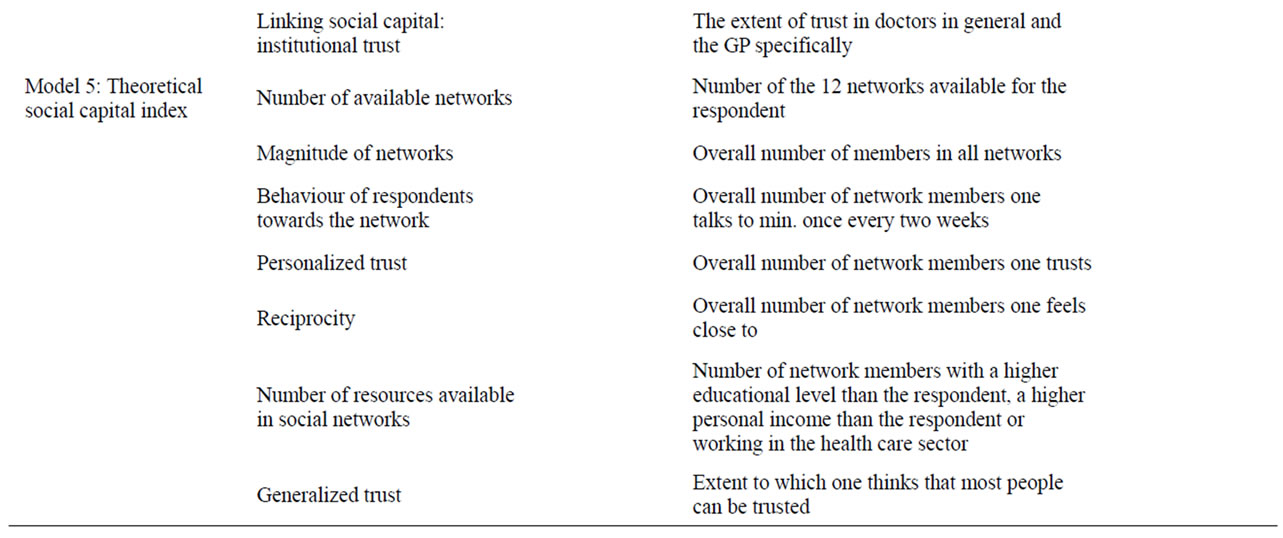
Table 1. Overview of theoretical concepts that the models encompass, used operationalisations and the number of questions in each of the five models to measure social capital.
tion ranging from “everybody” to “nobody”. This measure was dichotomized, with a score of 0 representing trust in no one or a distrust in most people, and a score of 1 representing trust in everyone or most people.
2.2.1.2. Model 2: Original Social Network Index
The second model is based on an existing questionnaire on social networks, the Social Network Index (SNI). The SNI was initially used to investigate the influence of social networks on the susceptibility to the common cold (Cohen et al., 1997). The original SNI contains information about the availability of twelve social networks for the respondent and the number of people one regularly talks to within these networks. The original questions from the SNI are included in the developed questionnaire. Based on the guidelines published by Cohen5 three original SNI-scores could be calculated. The number of high-contact roles (=network diversity) represents the number of social networks in which the respondent has regular contact with at least one other person. “Regular contact” is defined as contact once every two weeks or more often. The number of people counts the total number of people with whom the respondent has regular contact.
The number of embedded networks describes the number of a total of eight different social networks in which a respondent is active. These include family, friends, religious group, school, work, neighbours, fellow-volunteers, and fellow-members in non-religious groups. Being “active in a network” is defined as having at least five people within that social network one talks to on a regular basis (i.e. minimum once every two weeks). To calculate this measure, the five family roles (partner, children, parents, in-laws and extended family) are added together into one overall network. This overall family network is considered as an embedded network if the following two premises are fulfilled: the respondent has to talk to at least one network member on a regular basis in at least three different family networks and has to talk regularly to at least five people within the overall family network.
2.2.1.3. Model 3: Expanded Social Network Index: Social Networks, Trust and Reciprocity
Social capital is often defined as having trustful and reciprocal relationships [33]. Following this definition by Robert Putnam, questions to capture feelings of trust and reciprocity are added to the original SNI (= model 2). Feeling close to others (i.e. strong ties) is considered to be related to feelings of reciprocity [34]. Trusting relationships in which one feels close to the other are expected to be high in social capital [33].
Corresponding to the procedure to determine the original SNI scores (see model 2), scores are calculated taking the information on trust and strong ties into account. This results in the following scores: the number of high-contact, trustful and strong ties, the number of people one trusts, feels close to and talks to on a regular basis and the number of trustful, close and embedded networks.
2.2.1.4. Model 4: Bonding, Bridging and Linking Social Capital
In accordance with the definitions of Szreter and Woolcock [30], measures for bonding, bridging and linking social capital are calculated based on the sociodemographic characteristics of the respondent’s network members. Bonding social capital takes place between people with similar socio-demographic backgrounds [10]. Consequently, a score for bonding social capital was calculated, based on the homogeneity in the level of education, religion and ethnicity between the respondent and his/her family, partner, friends and the most important “other group”. The more people in these networks share the same level of education, ethnicity and religion as the respondent, the higher the score for bonding social capital.
Bridging social capital flourishes between people that differ on certain socio-demographic measures [10]. The score for this variable is based on the heterogeneity between the respondent and his/her family, partner, friends and the most important “other group” regarding level of education, religion and ethnicity. The more people in the network differ with the respondent on those sociodemographic characteristics, the higher the score for bridging social capital.
The score for linking social capital is based on the level of trust in professional caregivers expressed by the respondent. This measure is assessed by questions on the extent of the respondent’s trust in doctors in general as well as trust in his/her general practitioner. Respondents can express their opinion on the statements “To what extent do you trust doctors in general/your general practitioner” by means of a four-point Likert scale ranging from “completely” to “absolutely not”. The higher the level of trust, the higher the score for linking social capital. The original score is dichotomised with a score of 0 representing low (mean score of 3 or lower) and a score of 1 representing high linking social capital (mean score higher than 3).
2.2.1.5. Model 5: Theoretical Social Capital Index
The fifth model builds on a broad theoretical basis and distinguishes seven different components of social capital, grasping the multidimensional nature of the concept. These components are the number of available networks, the magnitude of networks, the behaviour of the respondent towards the network, personalized trust, reciprocity, the number of resources available in social networks and generalized trust.
The number of available networks represents how many of the twelve networks are available for the respondent. The magnitude of networks is calculated by adding the number of members in the available networks. The third component, the behaviour of the respondent towards the network, is operationalised by summing up the number of people with whom the respondent has regular contact. To measure personalized trust, the number of network members one trusts is determined. Reciprocity is inventoried by a proxy measure, namely the number of people to whom the respondent feels close. The number of resources available for the respondent is measured by adding the number of people with a higher educational level, a higher personal income or working in the health care sector within the networks “partner”, “friends”, “family” and “most important other group”. The last available component of social capital, generalized trust, is identical to the question on the basis of model 1.
2.2.2. Dependent Variables: Health Outcomes
Two health-related outcomes are included in the analysis, namely self-rated health and pain. To assess self-rated health, the most widely used single item to assess overall self-rated health [35] is used: respondents are asked to evaluate their general health status, using a five-point Likert scale ranging from “very good” to “very poor”. The original score is dichotomized for the analysis. A score of 1 represents good or very good perceived health and 0 represents very poor, poor or fair perceived health. To evaluate the impact of pain, respondents are asked how much pain they experienced during the past 4 weeks using a six-point Likert scale ranging from “none” to “very severe”. The original score for this variable is also dichotomized with 0 representing no or very light pain and 1 representing light, moderate, severe and very severe pain.
2.2.3. Background Variables
The socio-demographic variables included in the questionnaire are age, gender, country of birth of the respondent and his/her parents and educational level. Respondents are considered as being of Belgian origin if both they and their parents are born in Belgium. Educational level was divided into three categories: low educational level (i.e. no degree, finished primary school or the first years of secondary school), middle educational level (i.e. finished secondary school) and high educational level (completed higher education).
2.3. Procedure
In each neighbourhood, 50 adults were randomly selected from the municipal register, stratified by sex and age, representative for the neighbourhood’s sociodemographic composition. These were visited at home by an interviewer and invited to participate. Respondents who could not be reached or refused to participate were replaced by a randomly selected respondent from the same age and gender stratum until a total of 50 participants per neighbourhood was reached. After signing the informed consent, the interviewer handed over the selfadministered questionnaire and an appointment was made to collect the questionnaire later at the respondent’s home.
This study is approved by the Ethics Committee of Ghent University Hospital (project number EC/2008/355 and registration number B67020084311).
2.4. Data Analysis
The explanatory value of the five social capital models was compared for each health-related outcome separately. For this comparison, multiple logistic regression models were used. The values of the Nagelkerke pseudo R2 were used to estimate the variance in the outcome measure explained by each respective model.
Due to skew distribution, some of the independent variables (i.e. the number of people in model 2, the number of people one trusts, feels close to and talks to on a regular basis in model 3 and behaviour of the respondent towards the network, reciprocity and resources in model 5) were transformed by adding the constant value “1” to the original score and subsequently performing a log transformation. The transformed variables show less striking outliers and a more linear relationship to the outcome variables.
For most questions, respondents were offered five answering categories to estimate the number of people for which the question was applicable (i.e. “0”, “1”, “2 until 4”, “5 until 7”, “8 until 15” and “more than 15”). In the analyses, the mathematical mean of the intervals was used to estimate the respondent’s answer. The highest possible answer, “more than 15”, was given the value 15. The data are analyzed using the SPSS Software version 17 for Windows.
3. RESULTS
3.1. Response Rate
Of the 712 contacted inhabitants, 202 could not be reached (i.e. nonexistent address or not at home at three different points in time) and 131 refused participation. For the analysis, 379 respondents provided useful data, resulting in an overall response rate of 53%.
3.2. Description of the Sample
Characteristics of the respondent are described in Table 2. The number of men and women is analogous, with respectively 48.4% men and 51.6% women. The age of the participants ranges from 18 to 91, with a mean of 48.
Most of the respondents (N = 328) are of Belgian origin (i.e. both they and their parents are born in Belgium). One hundred and thirteen respondents (30.3%) have a low educational level (i.e. no degree, finished primary school or the first years of secondary school). One hundred and fourty-six respondents (39.2%) finished secondary school, while 114 respondents (30.5%) finished higher education.
Most of the respondents (298 versus 76) rate their general health as good to very good and about half of the sample reports having experienced no or very light pain in the last four weeks.
3.3. Comparison of the Model’s Explanatory Power
Table 3 gives an overview of the models’ ability to explain the observed variance in self-rated health and pain.
3.3.1. Self-Rated Health
The first (generalised trust) and fourth model (distinction between bonding, bridging and linking social capital) explain the least observed variance in self-rated health (7.2% and 10% respectively). The second model (original SNI) explains 14.1% of the observed variance in self-rated health, while the third model (expanded SNI) explains 15% of this variance. The social capital index is
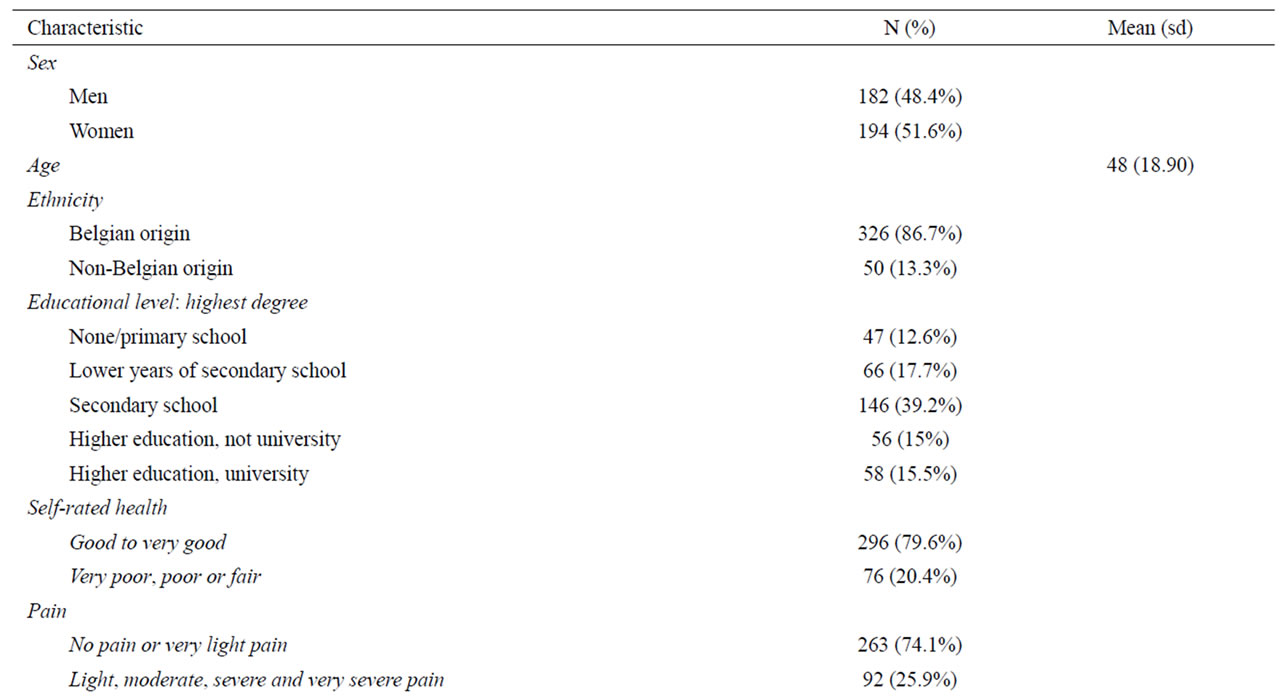
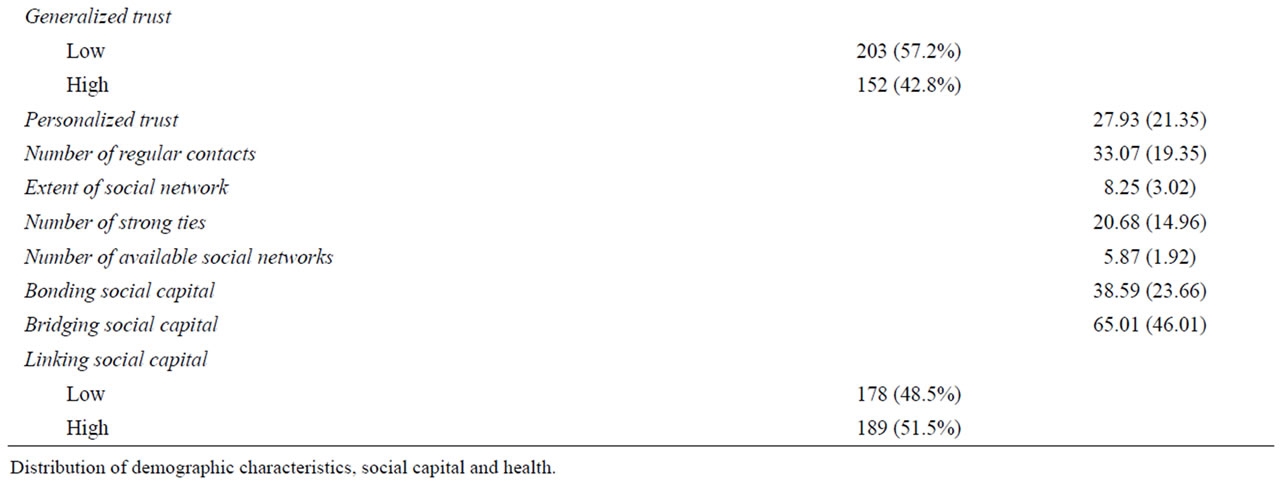
Table 2. Distribution of demographic characteristics, social capital and health.

Table 3. Ability to explain the observed variance in self-rated health and pain by five different models to measure social capital.
able to explain most of the observed variance in selfrated health (23.1%).
3.3.2. Pain
The fourth (distinction between bonding, bridging and linking social capital) and the first model (generalised trust) explain the least of the observed variance in the last health outcome; they respectively explain 1.9% and 2% of the variance in pain. The third model (expanded SNI) explains 3.1%. The second model (original SNI) explains more of the variance in pain (3.9%). As was the case with self-rated health, the social capital index is able to account for most of the observed variance, by explaining 5.7%.
4. DISCUSSION
The lack of consensus regarding the measurement of social capital is an often heard point of criticism in social capital research and is said to hinder a clear insight into the nature, effect and value of social capital [4,9,17,18]. This study has opposed different approaches to operationalise social capital in order to address the need for a clear choice on how to conceptualise the concept, based on theoretical and practical arguments. It has described five models encompassing (components of) social capital; one measuring generalized trust, one incorporating a social network index, one enclosing an expanded social network index, one distinguishing bonding, bridging and linking social capital and one containing a multidimensional social capital index. The ability of these models to explain the observed variance in self-rated health and pain was compared, taking into account the burden they pose on respondents (using the number of needed survey questions as an indicator for the latter).
Our findings have shown that the explained variance considerably differs between the two included health outcomes. For pain, the variance explained by the five studied models varies from 1.9% to 5.7% whereas the explained variance for self-rated health varies between 7.2% and 23.1%. In the case of self-rated health, especially the SNI, the expanded SNI and the social capital index explain relatively large proportions of the variance (respectively 14.1%, 15% and 23.1%).
Not surprisingly, social capital seems to play a much more pronounced role in self-rated health than in pain. Several qualitative studies show that participants include aspects of health far beyond physical dimensions when asked to evaluate their general health status, such as social comparison [36,37], coping [37,38], family relations [36], social support, external validation and external causes [39]. As for “pain” this is probably much less the case, since pain is more the result of intra-person determinants such as severity of the illness or the condition.
One of the five models developed in this study is an extensive (83 questions) social capital index that aims to capture the complexity of the concept social capital both in depth and in width. As expected, this index succeeds in explaining the highest proportion in the variance compared to the other models, both for self-rated health and for pain. The social capital index in this study explains higher proportions of variance, compared to models used in other studies that focus on the explanatory value of social capital on health. In a Finish study, including not only social capital variables but also demographic variables such as age and gender, the explained variance in self-rated health varies between 6.9% and 8.2% [40]. In a study based on the European Social Survey, a similar model explains 14% of the variance in self-rated health [41]. The difference between our findings and those of other studies might be explained by the large number of questions we used. At the one hand this enabled a broad measurement of the concept of social capital. On the other hand, the questions might unintentionally have grasped other determinants closely related to health. Both of these scenarios can have contributed to a higher proportion of explained variance.
The impact of a single-item model measuring generalised trust was also explored. Again as expected, this model explains the least variance in self-rated health. Interesting to see, however, is that in the explanation of pain this one question explains as much variance as the 27 questions measuring bonding, bridging and linking social capital.
Recent literature stresses the potential role of bonding, bridging and linking social capital [5,30,31]. However, this is not confirmed by the findings of this study: this 27-item model is weaker in explaining health than the original Social Network Index, which poses a similar burden on respondents with its 23 questions. This suggests that the availability and size of one’s network (measured by the SNI) have a larger impact on one’s self-rated health and perceived pain than the network composition and the level of trust in professional healthcare workers (measured by the model on bonding, bridging and linking social capital). Nevertheless, a more detailed measurement of bonding, bridging, and linking social capital might have resulted in other findings.
Two of the included models deal with social network characteristics. The original SNI takes into account the availability and size of networks. The expanded SNI adds information on trust and reciprocity in the networks to the original SNI. Even though the expanded SNI includes 24 questions more, both models explain a comparable amount of the observed variance in self-rated health and pain. This implies that trusting and feeling close to others does not substantially add to the explanation of pain perception and self-rated health over and above the influence of the size and availability of one’s network. These findings do not support the recent research by Nakhaie and Arnold [42]. These authors describe and stress the power of strong and trusting ties, which might be associated with the importance of love for health. They conclude that loving and feeling loved in relationships are important health-enhancing aspects of one’s social capital, as loving relationships are associated with social support and diverse psychological and physical advantages [42].
4.1. Strengths and Weaknesses of the Study
To our knowledge, this study is the first to compare different approaches to operationalise social capital in relation to health. It incorporates the fairly recent and highly debated theoretical development in social capital research, namely the distinction of bonding, bridging and linking social capital, which has until now rarely been translated into empirical research. All included models were supported by literature and—where possible— based on internationally validated questionnaires. In the collection of the data, particular attention was paid to the inclusion of respondents from all social classes: respondents were invited during a face-to-face contact at their homes, the questionnaires were collected during a second home visit and help was provided to fill in the questionnaire if needed.
However, caution is in order regarding the generalisation and the interpretation of the findings.
A first weakness of the study is related to the data collection. Because data on the level of social capital or the health status of people who refused participation is not available, a non-response analysis could not be executed. However, as the sample was a randomized sample clustered on age, gender and neighbourhood characteristics (deprivation and urbanity), one can presume that nonrespondents will not significantly differ from the respondents on the level of these important characteristics.
Some weaknesses in the used measurement of the key concepts of the study should also be taken into account. The model that distinguishes between bonding, bridging and linking social capital explains only a limited proportion of the observed variance in the studied health outcomes. This is in contrast to what might be expected seen the relatively large number of questions (27) used. In the theory on bonding, bridging and linking social capital, the concepts “diversity” [5,31] and “shared identity” [10] play a substantial role: bonding social capital is created between people who consider themselves as alike, bridging social capital between people who differ on important socio-demographical characteristics. In this study, however, diversity is only measured in terms of sex, ethnicity, religiosity and educational level. Furthermore, linking social capital is defined as “norms of respect and networks of trusting relationships between people who are interacting across explicit, formal or institutionalized power or authority gradients in society” [10]. In this study, the conceptualisation of this concept is not only restricted to one type of relationships (i.e. doctors in general and the GP in particular) but also restricted in the nature of the relationship (trust). Yet, also relationships with other authorities or beholders of power in society such as other health care workers, policy makers and public authorities might be of importance for welfare and health. In addition, not only trust but also other aspects of these relationships might be important aspects of linking social capital. Clearly, further deepening of the measurement of bonding, bridging, and linking social capital might lead to a more valid model.
Secondly, this study focuses only on two aspects of the multi-dimensional concept “health” i.e. self-rated health and pain. It would be interesting to analyse the explanatory value of the five models on the variance in other health outcomes. Thirdly, some of the models in this study (SNI, expanded SNI) use norms of trust and reciprocity to measure social capital. By doing this, they fit into the research tradition based on the theory of Putnam [33], the most dominant view in social capital research related to health. However, caution is required as this theory is sometimes criticised for its lack of focus on the resources embedded in social networks [43]. The measurement of social resources in networks has been intensively studied during the last two decennia and is a valid, reliable as well as practical manner of measuring social capital [17]. It’s application however is mainly explored in regard to status attainment or job market outcomes. A further exploration of its application in health related research might contribute to the unremitting/ongoing search for a meaningful, theoretically sound and workable way to measure social capital in health sciences.
4.2. Conclusion and Implications for Further Research
The findings of this study might raise more questions than they answer; this study does not provide clear-cut and final answers, applicable in different contexts. Keeping the weaknesses of this study in mind, however, some important conclusions can be drawn.
The social capital index explains a large proportion of the variance in self-rated health and seems to be able to grasp the diversity of social capital. Therefore, this index might be potentially interesting for researchers focussing on social capital and trying to capture the concept in all its dimensions. Further analysis of our data will focus on the fact whether some dimensions of the social capital index or specific networks have a more decisive role in explaining health outcomes. This could result in a more dense multidimensional social capital index, while losing the lowest possible amount of explanatory power.
The social capital index imposes a serious burden on respondents (83 questions) and is therefore probably less suited to be used in research including social capital as one of many determinants of health. In this context, the two most confined social capital models—the singleitem model measuring generalized trust and the Social Network Index composed of 23 questions—can be considered as acceptable options.
The addition in explained variance of the expanded SNI compared to the original SNI does not seem to be in relation to the adding of 24 questions (0.9% more explained variance in self-rated health and 0.8% less explained variance in pain) and is therefore less suited without further research. Concerning the measurement of bonding, bridging and linking social capital, this study has made a first attempt. However, the operationalisation should be further adjusted, improved and pretested.
Tackling the major determinants of health is of great importance to promote the health of the general population (http://ec.europa.eu/health/ph_determinants/healthdeterminants_en.htm). To conclude, this study confirms the findings of other studies stating that social capital (moderately) influences health. This impact seems to be more pronounced on self-rated health, known as a multi-dimensional concept, than it is on the more individual determined concept of pain.
When interested in social capital, researchers should consider the pros and cons of the different models to measure social capital, with the goals of the study as an important criterion. The results of this study can contribute to this choice. Yet, it is important to bear in mind that social capital is not the only factor that influences health and to regard social capital as part of the broader picture of health determinants.
![]()
![]()
REFERENCES
- Halpern, D. (2005) Social capital. Polity Press, Cambridge.
- Kawachi, I. and Berkman, L.F. (2000) Social cohesion, social capital and health. In Berkman, L.F. and Kawachi, I., Eds., Social epidemiology. Oxford University Press, New York.
- Morrens, B. (2008) Sociaal kapitaal en gezondheid: Een overzicht van de recente onderzoeksliteratuur. Tijdschrift voor Sociologie, 29, 138-157.
- De Silva, M.J., McKenzie, K., Harpham, T. and Huttly, S.R.A. (2005) Social capital and mental illness: A systematic review. Journal of Epidemiology and Community Health, 59, 619-627. doi:10.1136/jech.2004.029678
- Ferlander, S. (2007) The importance of different forms of social capital for health. Acta Sociologica, 50, 115-128. doi:10.1177/0001699307077654
- Kawachi, I., Kennedy, B.P. and Glass, R. (1999) Social capital and self-rated health: A contextual analysis. American Journal of Public Health, 89, 1187-1193. doi:10.2105/AJPH.89.8.1187
- Mansyur, C., Amick, B.C., Harrist, R.B. and Franzini, L. (2008) Social capital, income inequality, and self-rated health in 45 countries. Social Science & Medicine, 66, 43-56. doi:10.1016/j.socscimed.2007.08.015
- Poortinga, W. (2006) Social relations or social capital? Individual and community health effects of bonding social capital. Social Science & Medicine, 63, 255-270. doi:10.1016/j.socscimed.2005.11.039
- Macinko, J. and Starfield, B. (2001) The utility of social capital in research on health determinants. The Milbank Quarterly, 79, 387-427. doi:10.1111/1468-0009.00213
- Szreter, S. and Woolcock, M. (2004) Health by association? Social capital, social theory, and the political economy of public health. International Journal of Epidemioliogy, 33, 650-667. doi:10.1093/ije/dyh013
- Kawachi, I., Kim, D., Coutts, A. and Subramanian, S.V. (2004) Commentary: Reconciling the three accounts of social capital. International Journal of Epidemiology, 33, 682-690. doi:10.1093/ije/dyh177
- Poortinga, W. (2006) Social relations or social capital? Individual and community health effects of bonding social capital. Social Science & Medicine, 63, 255-270. doi:10.1016/j.socscimed.2005.11.039
- Putnam, R. (1995) Bowling alone: America’s declining social capital. Journal of Democracy, 6, 65-78. doi:10.1353/jod.1995.0002
- Portes, A. (1998) Social capital: Its origins and application in modern sociology. Annual Review of Sociology, 24, 1-24. doi:10.1146/annurev.soc.24.1.1
- Hean, S., Cowley, S., Forbes, A. and Griffiths, P. (2004) Theoretical development and social capital measurement. In Morgan, A. and Swann, C., Eds., Social capital for health: Issues of definition, measurement and links to health. Health Development Agency, London, 41-68.
- Derose, K.P. and Varda, D.M. (2009) Social capital and health care access: A systematic review. Medical Care Research and Review, 66, 272-306. doi:10.1177/1077558708330428
- Lin, N. and Erickson, B.H. (2008) Theory, measurement, and the research enterprise on social capital. In Lin, N. and Erickson, B.H., Eds., Social capital. An international research program. Oxford University Press Inc., New York. doi:10.1093/acprof:oso/9780199234387.003.0010
- Stone, W. (2001) Measuring social capital. Towards a theoretically informed measurement framework for researching social capital in family and community life. Australian Institute of Family Studies—Commonwealth of Australia Melbourne.
- Subramanian, S.V., Kim, D.J. and Kawachi, I. (2002) Social trust and self-rated health in US communities: A multilevel analysis. Journal of Urban Health, 79, S21- S34. doi:10.1093/jurban/79.suppl_1.S21
- Onyx, J. and Bullen, P. (2000) Measuring social capital in five communities in NSW. Journal of Applied Behavior Science, 36, 23-42. doi:10.1177/0021886300361002
- Flap, H. (2004) Creation and returns of social capital. A new research program. In Flap, H. and Völker, B., Eds., Creation and returns of social capital. A new research program. Routledge, London.
- Durkheim, E. (1897) Le suicide. Etude de sociologie. Félix Alcan, Paris.
- Berkman, L.F. and Syme, S.L. (1979) Social networks, host resistance, and mortality: A nine-year follow-up study of Alameda County residents. American Journal of Epidemiology, 109, 186-204.
- Cohen, S., Doyle, W.J., Skoner, D.P., Rabin, B.S. and Gwaltney, J.M. (1997) Social ties and susceptibility to the common cold. Journal of American Medical Association, 1997, 1940-1944. doi:10.1001/jama.1997.03540480040036
- Lin, N. and Dumin, M. (1986) Access to occupations through social ties. Social Networks, 8, 365-385. doi:10.1016/0378-8733(86)90003-1
- Van der Gaag, M. and Snijders, T. (2004) Proposals for the measurement of individiual social capital. In Flap, H. and Völker, B., Eds., Creation and returns of social capital. A new research program. Routledge, London.
- Ellaway, A. (2004) Commentary: Can subtle refinements of popular concepts be put into practice. International Journal of Epidemiology, 33, 681-682. doi:10.1093/ije/dyh184
- Muntaner, C. (2004) Commentary: Social capital, social class, and the slow progress of psychosocial epidemiology. International Journal of Epidemiology, 33, 674-680. doi:10.1093/ije/dyh200
- Navarro, V. (2004) Commentary: Is capital the solution or the problem? International Journal of Epidemiology, 33, 672-674. doi:10.1093/ije/dyh179
- Derose, K.P. (2008) Do bonding, bridiging, and linking social capital affect preventable hospitalizations? Health Services Research, 43, 1520-1541. doi:10.1111/j.1475-6773.2008.00856.x
- Putnam, R. (2004) Commentary: “Health by association”: Some comments. International Journal of Epidemiology, 33, 667-671. doi:10.1093/ije/dyh204
- Van Oorschot, W., Arts, W. and Gelissen, J. (2006) Social capital in Europe. Measurement and social and regional distribution of a multifaceted phenomenon. Acta Sociologica, 49, 149-167. doi:10.1177/0001699306064770
- Putnam, R. (2000) Bowling alone: The collapse and revival of American community. Simon and Schuster, New York.
- Granovetter, M. (1973) The strength of weak ties. American Journal of Sociology, 78, 1360-1380. doi:10.1086/225469
- Bjorner, J.B., Fayers, P. and Idler, E. (2005) Self-rated health. In Fayers, P. and Hays, R., Eds., Assessing quality of life in clinical trials. Methods and Practice. 2nd Edition, Oxford University Press, New York.
- Idler, E.L., Hudson, S.V. and Leventhal, H. (1999) The meanings of self-ratings of health. A qualitative and quantitative approach. Research on Aging, 21, 459-476. doi:10.1177/0164027599213006
- Simon, J.G., De Boer, J.B., Joung, I.M.A., Bosman, H. and Mackenbach, J.P. (2005) How is your health in general? A qualitative study on self-assessed health. European Journal of Public Health, 15, 200-208. doi:10.1093/eurpub/cki102
- Manderbacka, K. (1998) Examining what self-rated health question is understood to mean by respondents. Scandinavian Journal of Social Medicine, 26, 145-153.
- Borawski-Clark, E., Kinney, J. and Kahana, E. (1996) The meaning of older adults’ health appraisals: Congruence with Objective Indicators and as Determinants of Mortality. Journal of Gerontology: Social Sciences, S51, S157-S170.
- Nummela, O., Sulander, T., Karisto, A. and Uutela, A. (2009) Self-rated health and social capital among aging people across the urban-rural dimension. International Journal of Behavioral Medicine, 16, 189-194. doi:10.1007/s12529-008-9027-z
- Delaney, L., Wall, P. and O’Haodha, F. (2007) Social capital and self-rated health in the Republic of Ireland: evidence from the European Social survey. Irish Medical Journal, 100, 52-56.
- Nakhaie, R. and Arnold, R. (2010) A four year (1996- 2000) analysis of social capital and health status of Canadians: The difference that love makes. Social Science & Medicine, 71, 1037-1044. doi:10.1016/j.socscimed.2010.05.033
- Carpiano, R.M. (2006) Toward a neighborhood resourcebased theory of social capital for health: Can Bourdieu and sociology help? Social Science & Medicine, 62, 165- 175. doi:10.1016/j.socscimed.2005.05.020
NOTES
1http://www.cfsv.org/communitysurvey/
2http://www.europeansocialsurvey.org
3http://www.statistics.gov.uk/ssd/surveys/general_household_survey.asp
4http://www.worldvaluessurvey.org
5http://www.psy.cmu.edu/~scohen/SNIscore.html