Engineering
Vol.4 No.12A(2012), Article ID:26065,7 pages DOI:10.4236/eng.2012.412A117
Mathematical Modeling of the Actual Infiltration Process for the Preparation of C/C Composites
Department of Chemical Engineering, Hong-Ik University, Seoul, Korea
Email: *gychung@hongik.ac.kr
Received August 24, 2012; revised September 25, 2012; accepted October 8, 2012
Keywords: Numerical Modeling; C/C Composites; CVI; Overturning; Propane
ABSTRACT
The mathematical modeling for the preparation of C/C composites from propane by F-CVI (Forced-flow Chemical Vapor Infiltration) was studied. The modeling for the actual processes including overturning the preform in the middle of the deposition process was carried out. Effects of the interval and the number of overturning processes on the time changes of porosity distribution were observed. The actual deposition process could be continued longer by overturning the preform. Furthermore, the total amount of deposition increased twice when several times of overturning were applied. It was confirmed that a low concentration and a slow reaction rate are necessary for a uniform infiltration even when the preform is overturned in the middle of the process.
1. Introduction
Ceramic composites are widely used industrially because of their prominent properties. Especially, carbon/carbon composites are lighter, and have a low thermal expansion, a high thermal conductivity, and a good mechanical resistance. They can be produced by reinforcing composites with fibers by Chemical Vapor Infiltration (CVI). In the CVI process, the precursor gas diffuses into a porous preform, reacts at pore walls, and deposits matrix materials [1]. Here, deposition of pyrolytic carbon in a well defined manner is required. Hence the modeling of the real deposition process such as overturning the preform in the middle of the process is important [2]. Here, the numerical simulations were used to optimize parameter values of the actual CVI process [3].
The kinetic mechanisms of the heterogeneous carbon deposition have been proposed [4,5]. And modeling based on the detailed surface kinetic mechanism [6-8] and the active surface sites [9] were also proposed. On the other hand, a global deposition model was used when transport phenomena were taken into account [10]. Diffusion and deposition kinetics were considered [11]. Furthermore, models visualizing the deposition in the preform based on the overall deposition reaction kinetics were also proposed [12,13]. In this work, the modeling based on the overall deposition reaction kinetics proposed by Vaidyaraman [14] was developed for the visualization of the deposition profile in the preform.
The objective of this work is modeling the preparation of fiber reinforced C/C composites by F-CVI of C from propane. Time changes of pore size, porosity, and amount of deposition, etc. could be estimated. The main concerns were the effects of overturning the preform in the middle of the deposition process. How the distribution of porosity and the final average porosity change with the overturning process were calculated for the different timeinterval and the different number of overturning. The results were compared with those obtained without overturning the preform.
2. Model Development
The same modeling as used in our previous work [15] was used in this research. The only differences were the inclusions of overturning the sample in the middle of the process. For the inclusions of the overturning process in the modeling, the additional mathematical equations were not necessary. The only necessary operation was that the calculated parameter values were exchanged in the following way so that the entrance parameter values become the exit parameter values and vice versa. The following explanations for the model equations are almost same as reported in our previous work [15].
The cylindrical preform is composed of fibers which are assumed nonporous. It is also assumed that pores among fibers distributed evenly in the whole preform as shown in Figure 1.
Reactant gas, i.e., propane, flows from one side of the preform to the other by the convection in the z-direction.
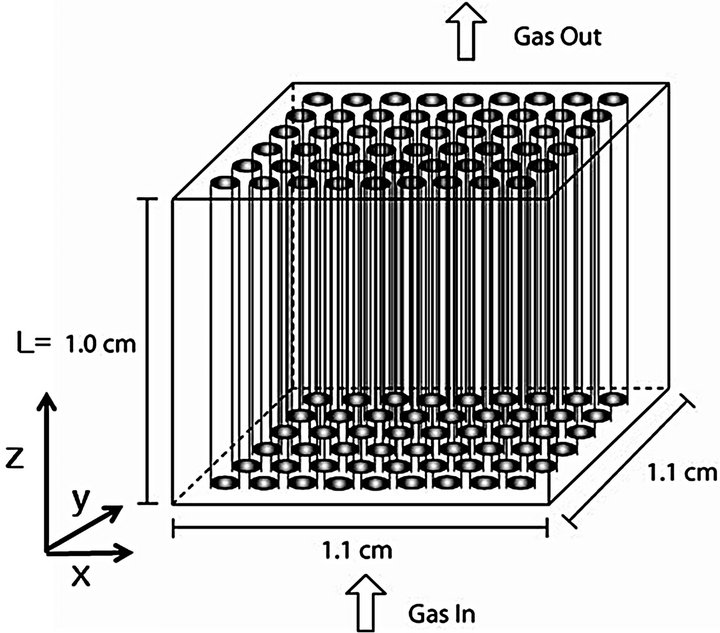
Figure 1. Schematic diagram of the perform.
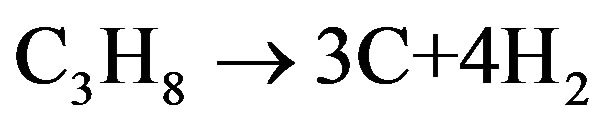
It is supposed that the carbon infiltration and deposition reaction is a first order of propane concentration. One mole of propane produces 3 moles of carbon and 4 moles of hydrogen.
 (1)
(1)
The mole balance for each ingredient was made as follows.
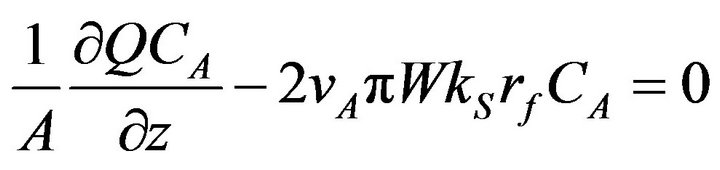 (2)
(2)
Here, the second item is the deposition on the outside lateral surface of fibers in the preform. The deposition rate constant (kS) reported by Vaidyaraman [14] was used.
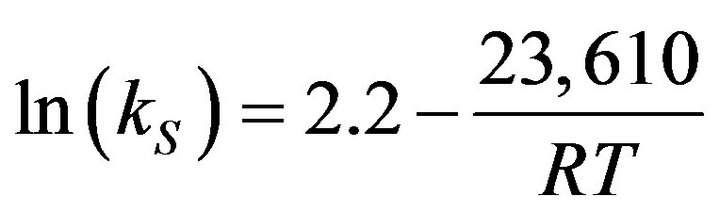 (3)
(3)
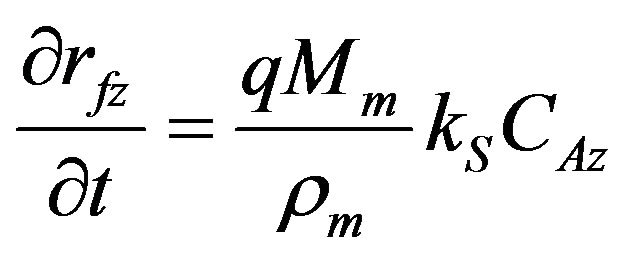
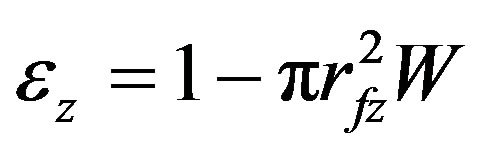
Here, R is the gas constant and T the reaction temperature. The momentum balance equation for the packed column was used. The equations for the changes of fiber radius (rf), the amount of deposition per unit cross-sectional area (D), and porosity (![]() ) at z are as follows.
) at z are as follows.
 (4)
(4)
![]() (5)
(5)
 (6)
(6)
Here, q is the mole number of deposited C from 1 mole of propane. Mm and ρm are the molecular weight and the density of deposited carbon, respectively. CAz is the concentration of propane at z and W is the number of fibers per unit cross-sectional area of perform. Time changes of fiber radius in Equation (4) were time changes of thickness of deposit around the cylindrical fiber. The amount of deposition in Equation (5) and the porosity in Equation (6) were calculated with this fiber radius.
The above equations were changed into a dimensionless form and solved by a finite difference method.
As explained above, the overturning process was included in the following way. After a certain time of deposition, the calculated parameter values were exchanged so that the entrance parameter values become the exit parameter values and vice versa.
3. Results and Discussion
Mathematical modeling was carried out with the parameter values listed in Table 1. Dimensions of the preform were taken from a sample used in the experiments done in our laboratory. In the previous work [15], CVI depositions were carried out without overturning and the modeling calculation results were fitted to the experimental data of the amount of deposition in the preform with an adjusted reaction rate constant. This adjusted reaction rate constant was used in the following work.
3.1. Deposition Rate Constant
In our previous work, comparisons of the experimental amount of deposition with the modeling calculation results were obtained as shown in Figure 2 [15]. Preforms were not overturned in the previous experiments. Symbols are experimental data and curves are modeling results. Experiments were carried out at 900˚C. When the rate constant in equation (3), reported by Vaidyaraman et al. [14], was multiplied by 2 at 100% propane and by 30 at 5%, 10%, 20% propane, the modeling results matched with the experimental data [15]. Hence modeling calculations in this research were carried out with an adjusted rate constant of 10 kS, which is the middle value between 2 kS and 30 kS.
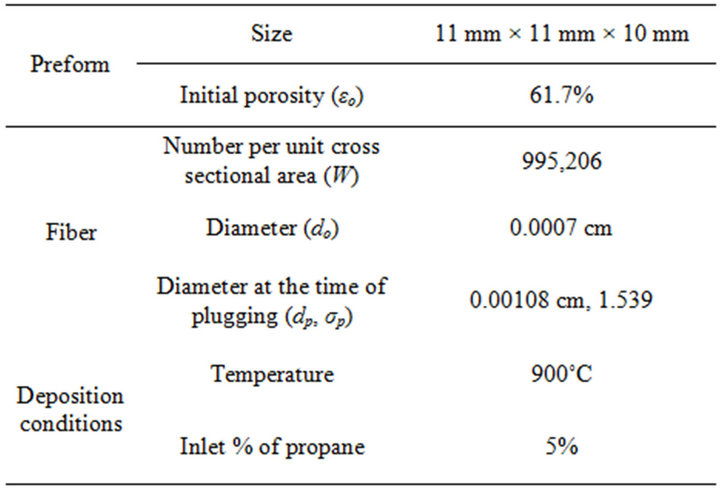
Table 1. Dimensions of the preform and deposition conditions used in the modeling.
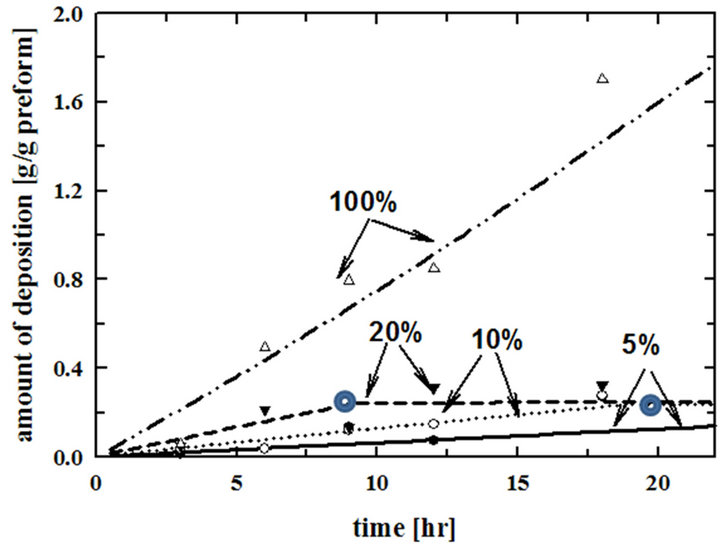
Figure 2. Comparisons of the modeling calculations with the experimental data of the amount of deposition per unit mass of the preform at different inlet percentages of propane. Modeling results were obtained by calculating with 2 kS for 100% and 30 kS for 5%, 10%, and 20% inlet propane [15]. The symbols,  , are inflection points.
The modeling calculation results in Figure 2 have inflection points. These are at the times when the pore entrances on the outside surfaces of the preform are plugged. There are no more depositions inside of the preform after those points. The surface area for the deposition on the outside of the preform is very small compared with that inside of the preform. As a result, the amount of deposition becomes very small. So the slope of the fitting curve becomes very small. This is the reason why overturning the preform in the middle of the deposition process is necessary.
3.2. Effects of Overturning during the Process
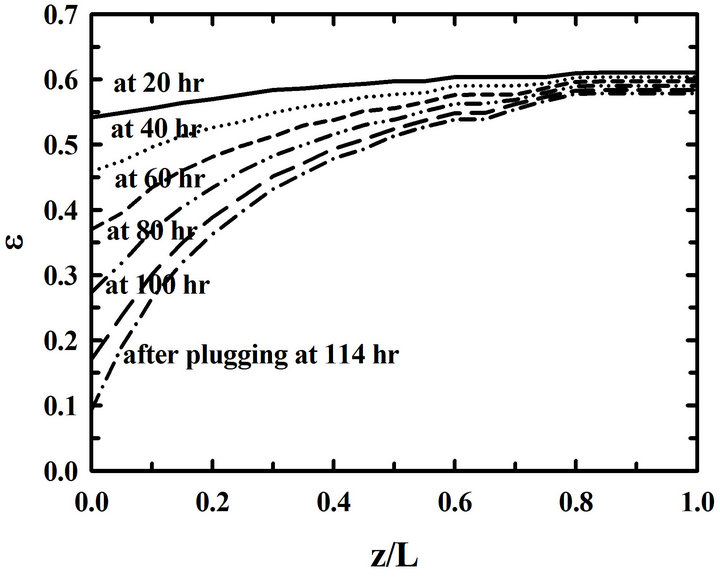
During deposition, the porosity near pore entrances decreases fast because of a high propane concentration. On the other hand, the porosity near pore exits decreases slowly because of a low propane concentration. So it is necessary to overturn the preform during a deposition process in order to reduce the porosity differences. The porosity distributions in the preform are in Figure 3 for the 3 cases of depositions a) without overturning, b) with overturning at every 30 hrs, and c) with overturning at every 10 hrs. The porosity differences between pore entrances and pore exits in the preform deposited without overturning are big. On the other hand, those porosity differences of the preform deposited with over-turning many times decreased a lot. Furthermore, the differences between porosities at the entrance and at the exit become small when the time intervals of overturning the preform are small. So there resulted more uniform depositions in the preform with the 10-hr-interval overturning than those in the preform with the 30-hr-interval overturning
 (a)
(a)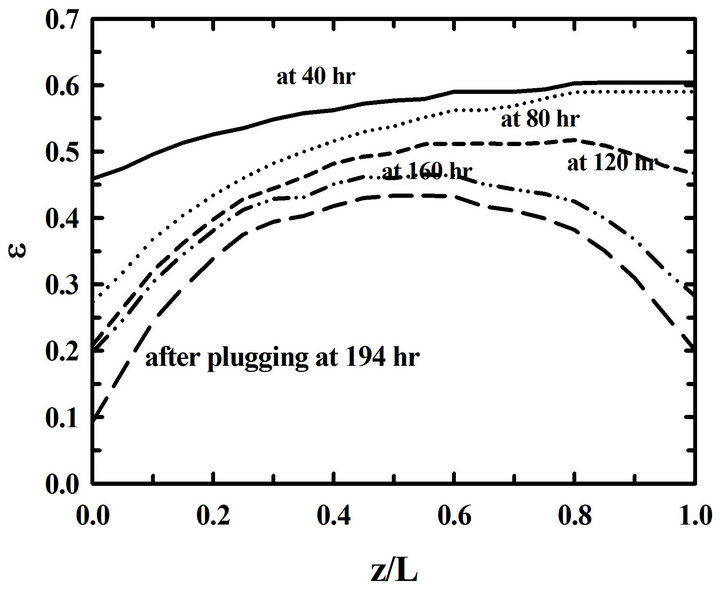 (b)
(b)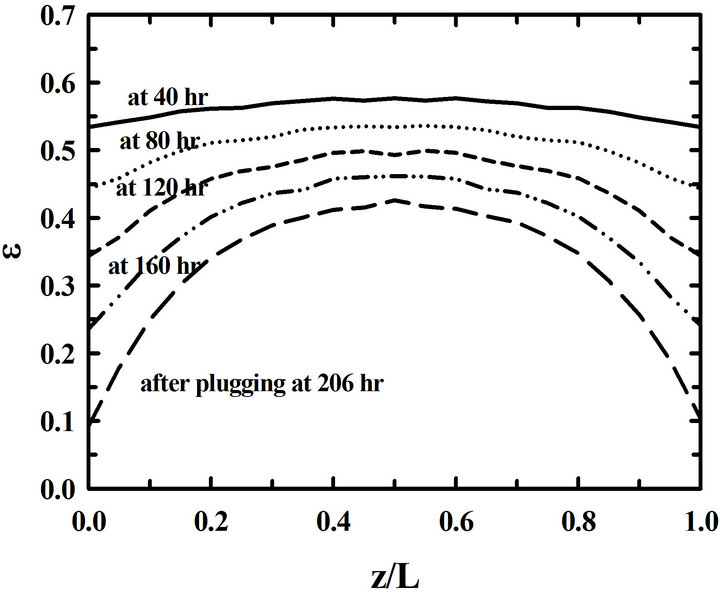 (c)
(c)
Figure 3. Time changes of the distributions of porosities (ε) in the preform for the different time intervals of overturning: (a) without an overturning, (b) with the 30-hr-interval, and (c) with the 10-hr-interval overturning.
in Figure 3(c). This can be seen again in Figure 4. A small time-interval overturning resulted in a uniform deposition at the time of pore plugging.
Figure 4 is the porosity distribution at the time of plugging pore entrances on the outside surfaces of the preform for the different time-intervals of overturning. As shown in Figure 3, it can be seen again that porosity differences at pore entrances and at pore exits show little differences when the time-interval of overturning the preform is small.
Time changes of the porosities at z = 0.2 L are shown in Figure 5. Since the time intervals of overturning the preform are different, the numbers of overturning are different in each case. The time of plugging pore entrances is extended as the time-intervals of overturning the preform becomes short. Additionally, the final porosities after plugging pore entrances become small.
Time changes of the average porosity and the total amount of deposition for the different time intervals of overturning the preform are shown in Figure 6. The decrease of the average porosity means the increase of the amount of deposition. It can be said that the amount of deposition done with 10 times overturning of 20-hr-interval becomes twice of that done without overturning.
3.3. Effects of Other Process Parameters
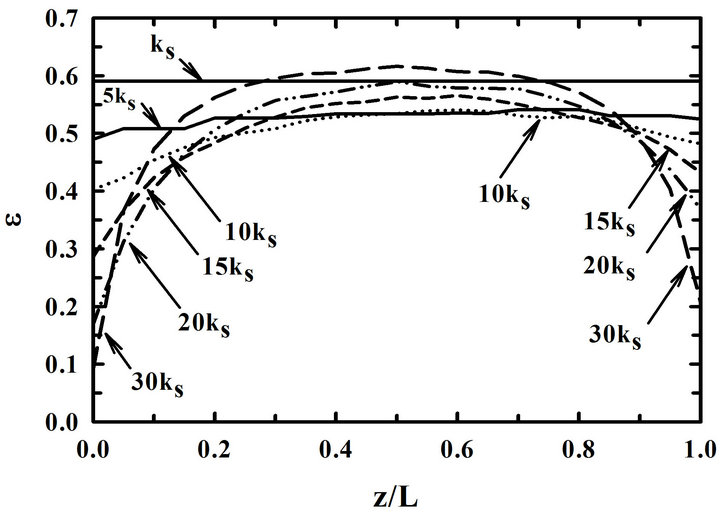
Figure 7 is the distributions of porosities in the preform (a) at 80-hr and (b) at the plugging time for the different reaction rate constants when the preforms were overturned at 30-hr-interval. Other conditions for the calculation were 900˚C, 5% inlet propane concentration, and 10 kS. A relatively uniform deposition is obtained with a small reaction rate constant as expected.

Figure 4. Distributions of porosities at the plugging time for the different time intervals of overturning such as 10, 20, 30, 60, and 90 hrs.
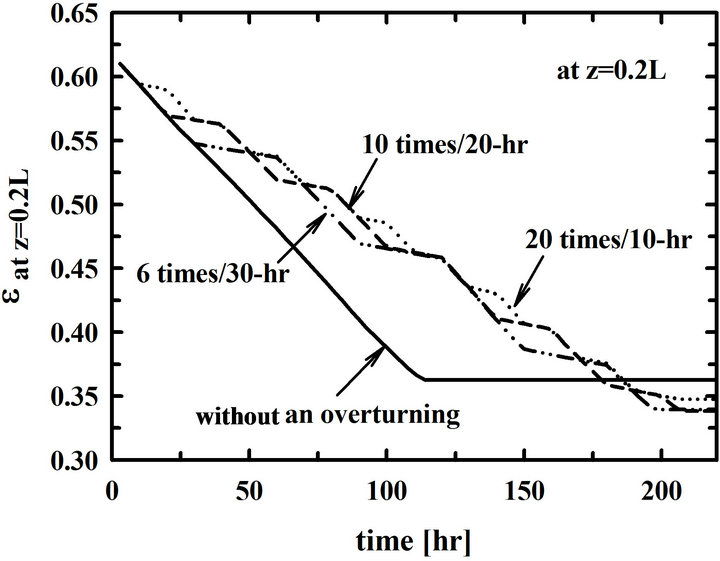
Figure 5. Time changes of porosities at z = 0.2 L for the different time intervals of overturning such as 10, 20, 30, 60, and 90 hrs.
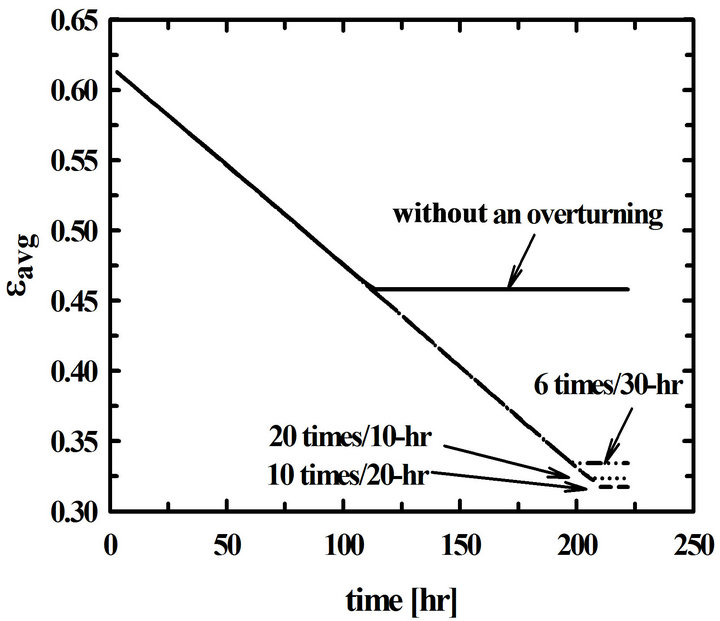
Figure 6. Time changes of the average porosities of the preform for the different time intervals of overturning.
When the reaction rate constant is big, the differences between porosities at pore entrances and exits are big. Furthermore, the porosity at the center of the preform is very big compared with those at pore entrances and exits. In other words, a non-uniform deposition is obtained at the center of the preform. In conclusion, it can be said that a uniform deposition is obtained at a slow reaction rate even when the preform is overturned in the middle of the deposition process.
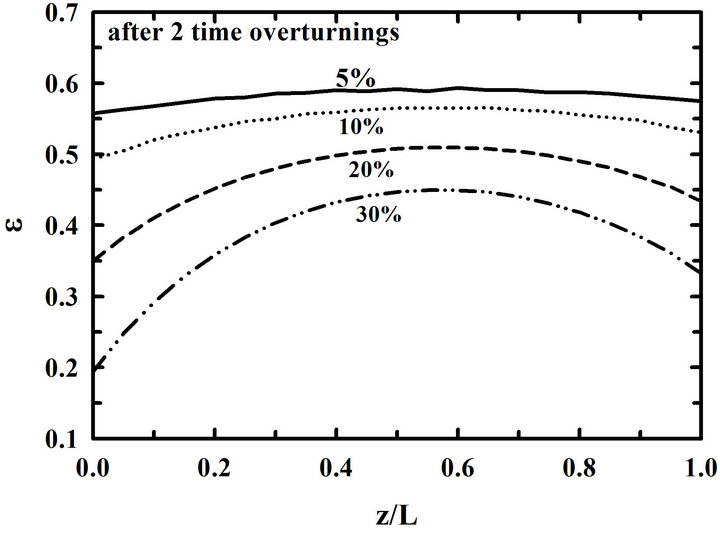
Effects of the percentage of propane on the infiltration when the preform is overturned at a certain time interval are shown in Figure 8. Distributions of porosities in the preform after 25 hr deposition are shown in Figure 8(a). They are distributions of porosity after 2 times of overturning, since the preform was overturned at 10-hr interval. A uniform deposition is obtained at a small percentage of propane even when the preform is overturned in the middle of the deposition process.
 (a)
(a)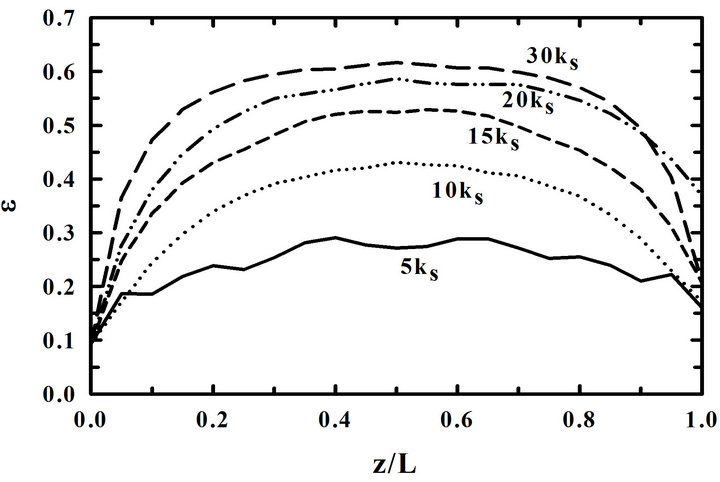 (b)
(b)
Figure 7. Distributions of porosities in the preform for the different reaction rate constants (a) at 80-hr and (b) at the plugging time. Preforms were overturned at 30-hr-interval.
Distributions of porosities in the preform at the plugging time for the different percentages of propane are shown in Figure 8(b). As the percentage of propane becomes big, the time of plugging pore entrances gets short. When 5% and 30% of propane are used, the plugging times are 104 hr and 28 hr, respectively. It is shown again that a uniform deposition is obtained at a small percentage of propane even when the preform is overturned. However, the porosity at the center of the preform remains very large even when a low propane concentration is used.
4. Conclusions
Modeling studies on the actual infiltration process including the overturning process for the preparation of C/C composites by the pyrolysis of propane have been carried out. The adjusted reaction rate constant obtained in the previous work [15] was used in this modeling. How the distribution of porosity and the final average porosity change with the overturning process was obtained. Effects of the interval and the number of overturning processes
 (a)
(a) (b)
(b)
Figure 8. Distributions of porosities in the preform (a) at 25-hr and (b) at the plugging time for the different propane concentrations. Calculations were made at 900˚C with a 10-hr-interval overturning.
were observed. The results were compared with those obtained without overturning the perform [16]. Effects of parameters of the deposition process were also analyzed and the following conclusions were obtained.
When the preform was overturned in the middle of the deposition process, a relatively uniform deposition was obtained. The amount of deposition made with 10 times of 20-hr-interval overturning became twice of that obtained without overturning.
It could be seen again that a low concentration and a slow reaction rate are necessary for a uniform infiltration even when the preform is overturned in the middle of the process.
A small time-interval between overturnings resulted in a uniform deposition at the time of plugging pore entrances in the preform. And the time of plugging pore entrances was extended. As a result, the final porosity after plugging pore entrances became small.
5. Acknowledgements
This work was supported by the Korea Science and Engineering Foundation KOSEF) Grant No. R01-2008-000- 21103-0) funded by the Korean Government. This work was also supported by 2012 Hongik University Research Fund.
REFERENCES
- W. Zhang and K. J. Hüttinger, “Simulation Studies on Chemical Vapor Infiltration of Carbon,” Composites Science and Technology, Vol. 62, No. 15, 2002, pp. 1947- 1955. doi:10.1016/S0266-3538(02)00128-8
- M. K. Kim and G. Y. Chung, “Computer Simulation of the Preparation of C/SiC Composites in the F-CVI Reactor,” Resources Processing, Vol. 54, 2007, pp. 25-28. doi:10.4144/rpsj.54.25
- G. Y. Chung, B. J. McCoy, J. M. Smith and D. E. Cagliostro, “Chemical Vapor Infiltration: Dispersed Graded Depositions for Ceramic Composites,” AIChE Journal, Vol. 39, No. 11, 1993, pp. 1834-1846. doi:10.1002/aic.690391111
- M. Frenklach and H. Wang, “Detailed Surface and Gas- Phase Chemical Kinetics of Diamond Deposition,” Physical Review B, Vol. 43, 1991, pp. 1520-1545. doi:10.1103/PhysRevB.43.1520
- M. Okkerse, M. de Croon, C. R. Kleijn, H. van den Akker and G. B. Marin, “A Surface and a Gas-Phase Mechanism for the Description of Growth on the Diamond (100) Surface in an Oxy-Acetylene Torch Reactor,” Journal of Applied Physics, Vol. 84, 1998, pp. 6387-6398. doi:10.1063/1.368965
- R. Lacroix, R. Fournet, I. Ziegler-Devin and P. M. Marquaire, “Kinetic Modeling of Surface Reactions Involved in CVI of Pyrocarbon Obtained by Propane Pyrolysis,” Carbon, Vol. 48, 2010, pp. 132-144. doi:10.1016/j.carbon.2009.08.041
- I. Ziegler, R. Fournet and P. M. Marquaire, “Influence of Surface on Chemical Kinetic of Pyrocarbon Deposition Obtained by Propane Pyrolysis,” Journal of Analytical and Applied Pyrolysis, Vol. 73, No. 1, 2005, pp. 107-115. doi:10.1016/j.jaap.2004.12.004
- I. Ziegler, R. Fournet and P. M. Marquaire, “Pyrolysis of Propane for CVI of Pyrocarbon: Part Ⅲ: Experimental and Modeling Study of the Formation of Pyrocarbon,” Journal of Analytical and Applied Pyrolysis, Vol. 79, 2007, pp. 268-277.
- A. Becker and K. J. Huttinger, “Chemistry and Kinetics of Chemical Vapor Deposition of Pyrocarbon-Ⅱ Pyrocarbon Deposition from Ethylene, Acetylene and 1,3-Butadiene in the Low Temperature,” Carbon, Vol. 36, 1998, pp. 177-199.
- G. L. Vignoles, C. Gaborieau, S. Delettrez, G. Chollon and F. Langlais, “Reinforced Carbon Foams Prepared by Chemical Vapor Infiltration: A Process Modeling Approach,” Surface and Coatings Technology, Vol. 203, 2008, pp. 510-515. doi:10.1016/j.surfcoat.2008.04.065
- A. Li, K. Norinaga, W. Zhang and O. Deutschmann, “Modeling and Simulation of Materials Synthesis: Chemical Vapor Deposition and Infiltration of Pyrolytic Carbon,” Composites Science and Technology, Vol. 68, 2008, pp. 1097-1104. doi:10.1016/j.compscitech.2007.07.007
- G. Y. Chung, B. J. McCoy, J. M. Smith and D. E. Cagliostro, “Chemical Vapor Infiltration: Modeling Solid Matrix Deposition for Ceramic Composites Reinforced with Layered Woven Fabrics,” Chemical Engineering Science, Vol. 47, 1992, pp. 311-323. doi:10.1016/0009-2509(92)80022-5
- J. Ibrahim and S. Paulucci, “Transient Solution of Chemical Vapor Infiltration/Deposition in a Reactor,” Carbon, Vol. 49, 2011, pp. 915-930. doi:10.1016/j.carbon.2010.11.002
- S. Vaidyaraman, W. J. Lackey and P. K. Agrawal, “Carbon/ Carbon Processing by Forced Flow-Thermal Gradient Chemical Vapor Infiltration (FCVI) Using Propane,” Carbon, Vol. 34, 1996, pp. 609-617. doi:10.1016/0008-6223(95)00191-3
- D. G. Hwang and G. Y. Chung, “Modeling Studies on the Effects of the Process Parameters in Forced-Flow Chemical Vapor Infiltration Reactor for the Preparation of C/C Composites,” Korean Journal of Chemical Engineering, Vol. 29, 2012, pp. 1266-1271. doi:10.1007/s11814-011-0303-2
- D. G. Hwang and G. Y. Chung, “Studies on the Effects of the Concentration in the Preparation of C/C Composites by the CVI Process of Propane,” Industrial & Engineering Chemistry Research, Vol. 18, 2012, pp. 1136-1140. doi:10.1016/j.jiec.2012.01.016
Nomenclature
A : cross-sectional area of the preform [cm2]
C : concentration of A, propane [mol/cm3]
D : amount of deposition per unit cross-sectional area of the perform [g/cm2]
k : first order (surface deposition) reaction rate constant [cm/s]
L : height of the perform [cm]
M : molecular weight q : mole number of carbon deposited from 1 mole of propane R : gas constant, 1.987 [cal/gmol K]
r : fiber radius [cm]
T : reaction temperature [K]
W : number of fibers in a unit cross-sectional area of the preform [#/cm2]
z : z-axis
Greek Letters
ε : porosity
ρ : density of deposited carbon [g/cm3]
Subscripts
A : gaseous species that enter the reactor f : fiber m : deposited carbon o : initial s : surface z : z-direction, gas flow direction
NOTES
*Corresponding author.