Engineering
Vol. 4 No. 6 (2012) , Article ID: 19837 , 6 pages DOI:10.4236/eng.2012.46037
Transmittance Measurement of the Nonplanar Optical Based on Focal-Plane-Array Camera
College of Electro-Mechanical Engineering, Changchun University of Science and Technology, Changchun, China
Email: *chengzhi_su@126.com
Received December 25, 2011; revised January 20, 2012; accepted January 28, 2012
Keywords: Transmittance Measurement; Nonplanar Optical; Focal-Plane-Array Camera
ABSTRACT
Aiming to solve the problem that it is difficult to accurately measure UV cut-off transmittance of xenon quartz glass by using present spectrophotometer in China SG III project. Through the analysis, we believe that its reason was that the xenon quartz glass was nonplanar so the outgoing beam geometry from under-test was different from that from standard sample. A method of transmittance measurement based on focal-plane-array camera was proposed in this article. The effects of camera uniformity and spot sampling on transmittance measurement were analyzed theoretically. This method, which can reduce the effect of beam geometry on transmittance measurement and eliminate the cutting error occurring during light transmission by monitoring the completeness of incident beam in real-time, is verified from experiments. The random standard uncertainty of this method here is 0.035% or less. It is particularly useful in the transmittance measurement of nonplanar optical.
1. Introduction
With development of China’s high-power lasers such as SG III device, higher demand is presented for the pulse xenon lamp as pumping light source of the work material for solid-state laser. The UV cut-off transmittance of xenon quartz glass has a direct impact on solid-state laser life [1]. In experiments we found that it is difficult to accurately measure UV cut-off transmittance of xenon quartz glass by using present spectrophotometer.
At present, optical transmittance is measured usually by adopting general spectrophotometer [2-4] or some special measurement devices [5-7]. The measurement basically uses integrating sphere as optical collector for the capability of homogeneity, and sensors such as electric eye or photomultiplier as optoelectronic detectors. Considering the focus of xenon quartz glass under test is different from that of the standard sample used to calibrate transmittance measurement instrument, it is nonplanar so the outgoing beam geometry from under-test is different from that from standard sample, which leads to incomeparability between actual and calibrated transmittance measurement. The transmittance measurement of xenon quartz glass presents a particularly challenging case for traditional method.
A different method is therefore required to address the challenges. The method needs to satisfy two conditions: 1) It is not sensitive to incident beam geometry. 2) It can monitor incident beam geometry to effectively eliminate cutting error which occurs during light transmission. Yang Zhiwen [8] suggested to add additional lens or adjust the position of integrating sphere in transmittance measurement, but standard uncertainty of this method can only reach to 1% [9]. Jessica Cheung et al. [10] described a dual lens method, but it is difficult to produce two identical optical in the transmittance measurement of xenon quartz glass.
In this paper, a transmittance measurement method is proposed, which measures light flux directly using additional imaging lens and camera’s focal-pane-array as the optical detector. It is not used integrating sphere as optical collector and one sensors as optoelectronic detectors but camera’s focal-plane-array as the optical detector in the method, so excluding unnecessary details of other factors such as collimated source and optical filter affecting on the accuracy of transmittance measurement, only the problems due to the camera as detector in transmittance measurements are therefore analyzed and discussed in this article.
2. Measurement Principle
As shown in Figure 1, the principle is presented as follows:
• Standard beam is generated from collimated source after spectra correction by using a optical filter;
• The beam is imaged on a camera by additional lens after passing through the under-test element;
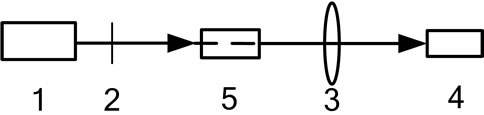
Figure 1. Schematics of optical transmittance measurement based on camera. 1. Collimated source; 2. Optical filter; 3. Additional imaging lens; 4. Camera; 5. Element under test.
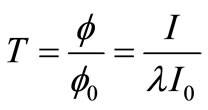
• The camera fulfills the photoelectric conversion, and then the camera response signals I0 and I, which correspond to in and out light fluxes  and
and  respectively, are obtained. Finally by taking a ratio of I and I0, the under-test optical element transmittance will be as follows:
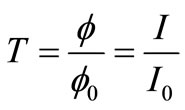 (1)
(1)
3. Analysis on Effect of Focus on Beam Geometry
As shown in Figure 2, in transmittance measurement, now assume that light flux of standard beam is  and light flux density of its arbitrary section sp0 is uniform. The standard beam is imaged on focal plane array sp1 by additional lens. Also, assume that the transmittance of additional lens is τ, its axis is parallel to standard beam, and rear focus is at F. Considering installation error, the attitude angle of focal plane sp1 relative to receiving surface of camera sp2 is θ and it should be fixed in the process of measurement.
In transmittance measurement, there are three cases about the effect of focus of the under-test optical element on the incident beam geometry:
1) Incident beam geometry of receiving surface of camera is not changed, when measuring planar optical element (see Figure 3).
2) Incident beam geometry of receiving surface of camera is changed and light flux density of spot is reduced, during the measurement of optical element with positive focus (see Figure 4).
3) Incident beam geometry of receiving surface of camera is changed and light flux density of spot is reduced, when the measurement of optical element with negative focus (see Figure 5).
4. The Relationship between Camera Response and Beam Geometry
From the analysis above, incident beam geometry in receiving surface of camera is changed due to different focuses, and the essential reason of the change is that different focus leads to the movement of image surface relative to receiving surface. As shown in Figures 2-5, assume that the attitude angle of receiving surface sp2 relative to image surface sp1 is denoted θ, and the distance
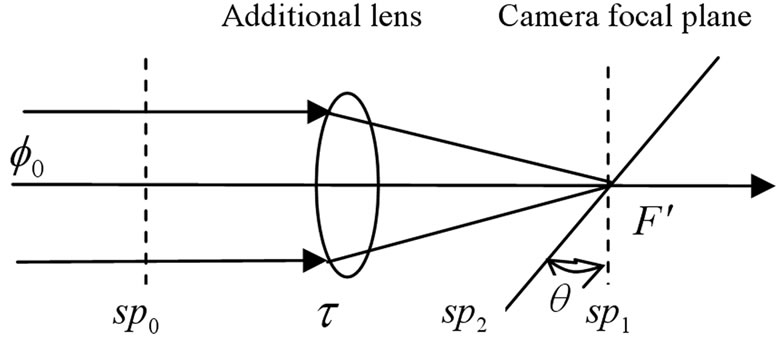
Figure 2. Schematics of transmittance measurement without optical element under test.
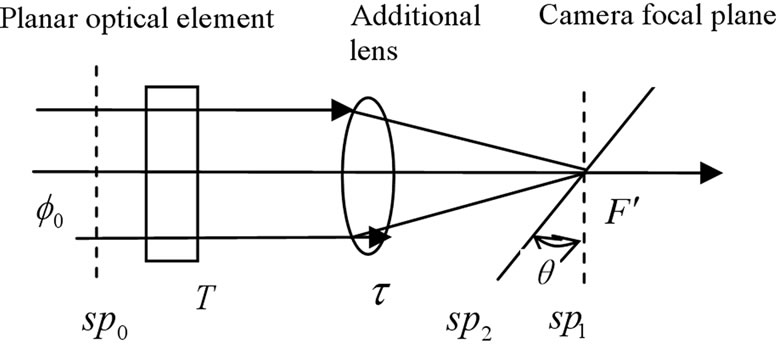
Figure 3. Schematics of transmittance measurement of planar optical element.
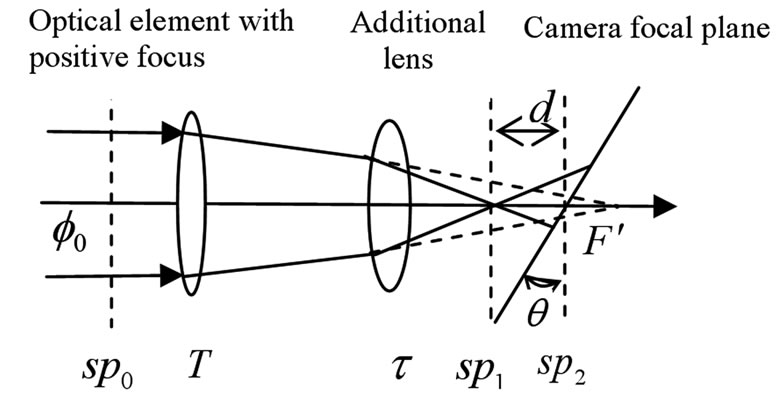
Figure 4. Schematics of transmittance measurement of optical element with positive focus.
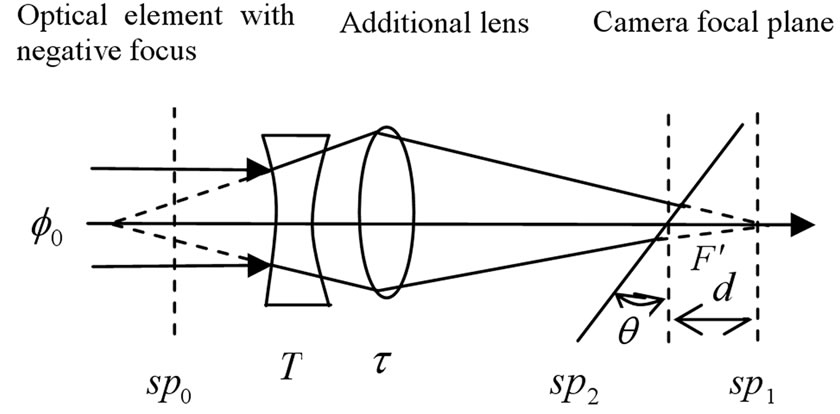
Figure 5. Schematics of transmittance measurement of optical element with negative focus.
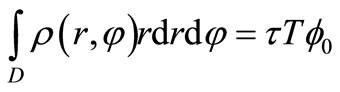
between them is d. Then create polar coordinate plot o—(r, ) on receiving surface sp2, and assume that pixel sensitivity of camera is k(r,
 ) and its light flux density distribution is ρ(r,
 ), so the expression for camera response I is
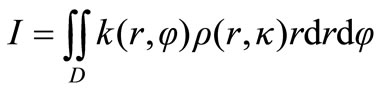 (2)
(2)
where D is a spot area in receiving surface while the attitude angle of camera receiving surface relative to image surface is θ and the distance between them is d.
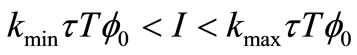
Assume that the minimum sensitivity of every pixel of camera’s focal plane array is kmin, and the maximum is kmax, then the range of camera response is
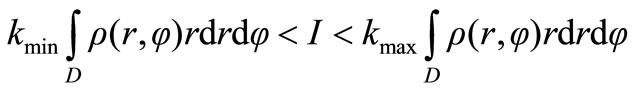 (3)
(3)
Assume there is no loss of light energy when the incident light from exit pupil of additional lens to image surface, so light flux of arbitrary section of exit pupil beam is not changed, and that can be described as
 (4)
(4)
where τ is additional lens transmittance, T is under-test optical element transmittance, and  is light flux of standard beam.
Combine Equations (3) and (4), then gives
 (5)
(5)
The model of camera area array used in experiment in this article, whose grayscale range is 0 - 65,535, is MTV- 1881EX produced by MINTRON corporation in Taiwan. In order to reduce the effect of nonuniformity grayscale error of camera response on transmittance measurement, the range of camera response is regulated to 10,000 - 65,535 by adding background light and meanwhile the nonuniformity grayscale error of camera response is corrected to 3 after calibration by continuously tunable standard light source. So transmittance measurement error due to nonuniformity of camera response is
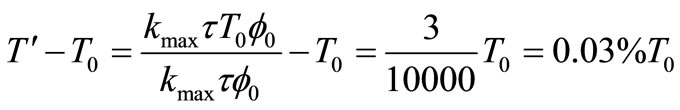 (6)
(6)
where T0 is the true value of transmittance, T' is the measured value of transmittance.
Equation (6) shows that maximum error of transmittance measurement due to nonuniformity of camera response is 0.03% (maximum value of T0 is 100%). Estimated value of T' is consistent with uniform distribution and its standard uncertainty is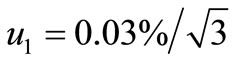 .
.
5. The Effect of Spot Sampling on Light Flux Measurement
Figure 6 shows us the spot image obtained from camera. Because the camera focal plane array is a discrete photoelectric transfer device, less 100% of light flux is measured to evaluate the overall light flux. From signal theory, the spot can be considered as two-dimensional spatial signal, so whether the continuous spot signal can be recovered from discrete spot signal lies on whether the sampling theorem is met or not in this case. That is to say,
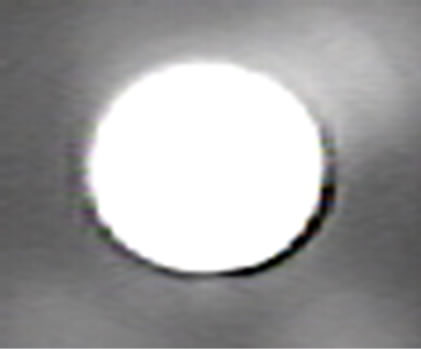
Figure 6. Spot image.
spatial sampling frequency should be more than twice of maximum frequency component of spot signal.
In transmittance measurement, distribution of spot energy must be continuously curved surface. According to geometrical optics, light flux density of spot is assumed as Gaussian distribution.
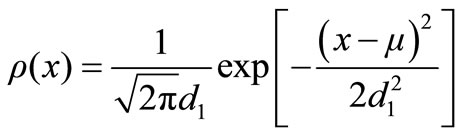 (7)
(7)
where µ is the mean of spot distribution, d1 is standard deviation of spot distribution. After Fourier transform on expression (7), signal spectrum function can be described as follows:
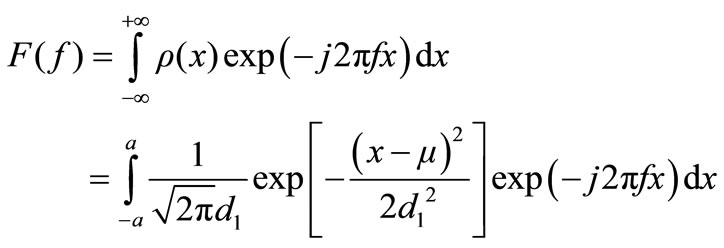 (8)
(8)
where a is spot radius.
In Figure 7, according to Equation (8), the amplitude spectrum of spot signal is plotted against d1, showing that signal bandwidth is increased as d1 is decreased. In order to improve measuring accuracy, maintain the spot with greater dispersion, and keep d1 > 1 and its corresponding bandwidth less than 5/mm–1. The pixel size of MTV- 1881EX camera is 8 µm and its corresponding sampling frequency is 125/mm–1, which is more than the spot signal bandwidth. So, it ensures that continuous spatial spot signal can be recovered from discrete spot signal.
To estimate measurement error of light flux due to spot sampling, let spot radius a = 1 mm,mathematical expectation of spot distribution µ = 0, and standard deviation of spot distribution d1 = 1. Figure 8 shows us the spot distribution before sampling. Theoretically, the light flux is
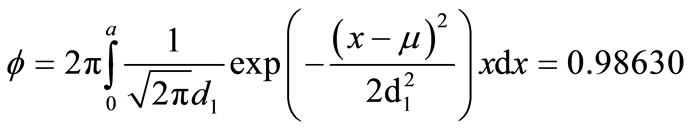 (9)
(9)
Figure 9 is the spot distribution after sampling, which is approximated to the curved surface shown in Figure 8. The light flux of spot is computed by using trapezoidal numerical integration as follows:
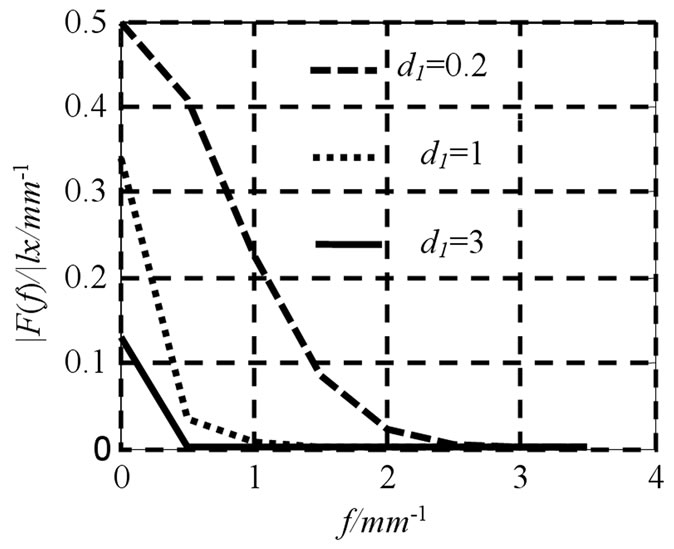
Figure 7. Amplitude spectrum of spot signal.
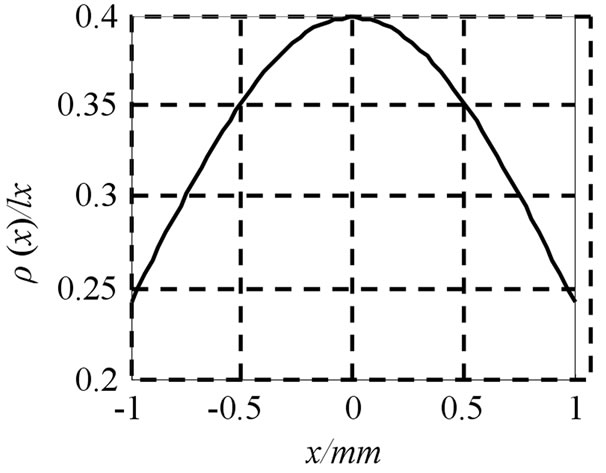
Figure 8. Distribution of spot before sampling.
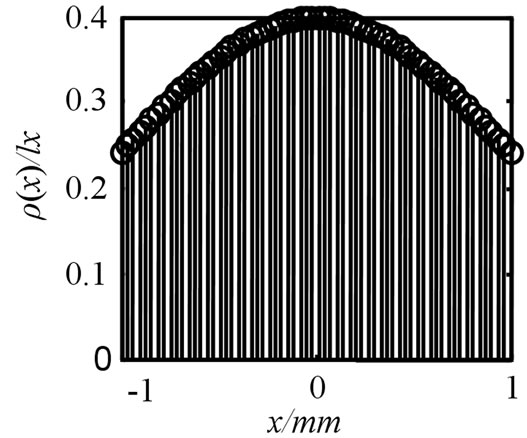
Figure 9. Distribution of spot after sampling.
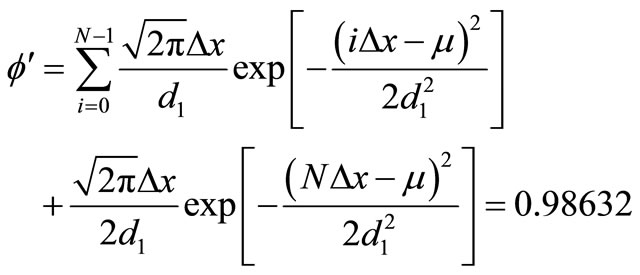 (10)
(10)
where N = a/Δx, Δx is sampling interval.
The maximum error e of light flux measurement due to space sampling of spot is calculated as follows
 (11)
(11)
Substituting Equations (9) and (10) in Equation (11), e < 0.0025% is obtained and corresponding maximum error of transmittance measurement is
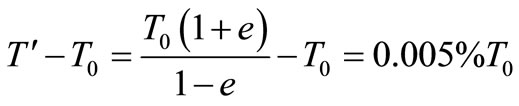 (12)
(12)
where T0 is the true value of transmittance and T' is the measured value of transmittance.
Equation (12) shows that maximum error of transmittance measurement due to spot sampling is 0.005% (maximum value of T0 is 100%). Estimated value of T' accords with uniform distribution and its standard uncertainty is .
.
6. Transmittance Measurement Experiment
6.1. Equivalent Principle
As shown in Figure 10, a transmittance measurement setup is implemented. At present, it is only standard transmittance planar sample that can be offered by metrologica department, so in the experiment, spot distribution on receiving surface of camera is changed by aligning the attitude and position of the camera manually, then the effect on transmittance measurement is equivalent to that of various focus of under-test element. In order to achieve the purpose, camera plane array is mounted on a movable stage, denoted as 10 in Figure 10, to realize various movements of camera, such as the pitching movement relatives to optical axis, Preand Post movement relatives to additional lens and vertical movement relatives to optical table. Keep the receiving surface of camera and image surface overlap as much as possible, with the position of camera d = 0 and angle θ = 0. Meanwhile, the positive direction of d is direction of light transmission, and the positive direction of angle θ is anticlockwise.
Light source is collimator tube (f = 550 mm). The incident light is divided into two beams called A and B by using spectroscope (λ = 550 nm). Here B is reference beam which is used to offset the variation of light source intensity caused by voltage fluctuation of power supply, and A is the measurement beam traveling through the under-test element. The detector is MTV-1881EX CCD. The focus of additional Imaging lens is f = 50 mm. The image acquisition card is DH-CG300 produced by China DA-HENG Company.
6.2. Cutting Error
Because standard beam axis is different from that of under-test optical element, cutting error occurs during light transmission, when the spot shown as Figure 11 is not complete. The problem can be solved by observing spot image while adjusting the axes of standard beam and under-test optical element until the spot shown as Figure 11 is complete.
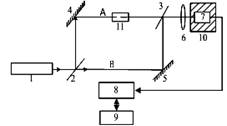
Figure 10. Setup of optical transmittance measurement based on camera. 1. Collimator tube; 2, 3. Spectroscopy; 4, 5. Antireflection lens; 6. Additional imaging lens; 7. Camera; 8. Image acquisition card; 9. Image processor; 10. Movable stage; 11. Element under test.
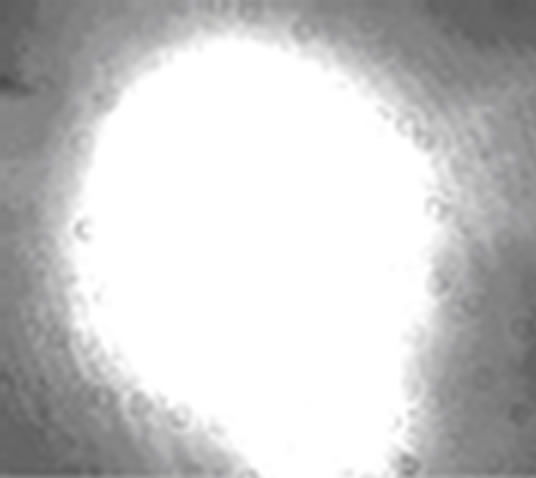
Figure 11. Spot image with cutting error.
6.3. Result
Firstly, the setup is allowed to equilibrate for 30 min before the experiment begins. Secondly, splitting ratio λ = 0.999 is obtained by carrying out measurement without under-test optical element. Then standard samples are measured with various attitudes and positions of camera. The two spot images are obtained by image acquisition card. The integral for gray scale is computed respectively over the whole spot area by image processor so that total response signals I0 and I are obtained, and then the undertest optical element transmittance is written as follows
 (13)
(13)
Results of measured data are shown in Table 1. We are only concerned about the effects of camera response and spot sampling on transmittance measurement, so repeatability error is only discussed here. From the analysis above, theoretical compound standard uncertainty of transmittance measurement due to measurement error of light flux based on camera plane array is
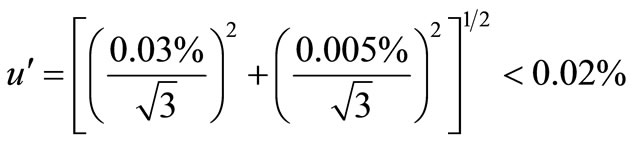 (14)
(14)
The experimental mean uncertainty due to the error is u = 0.035% from Table 1, which is basically identical to
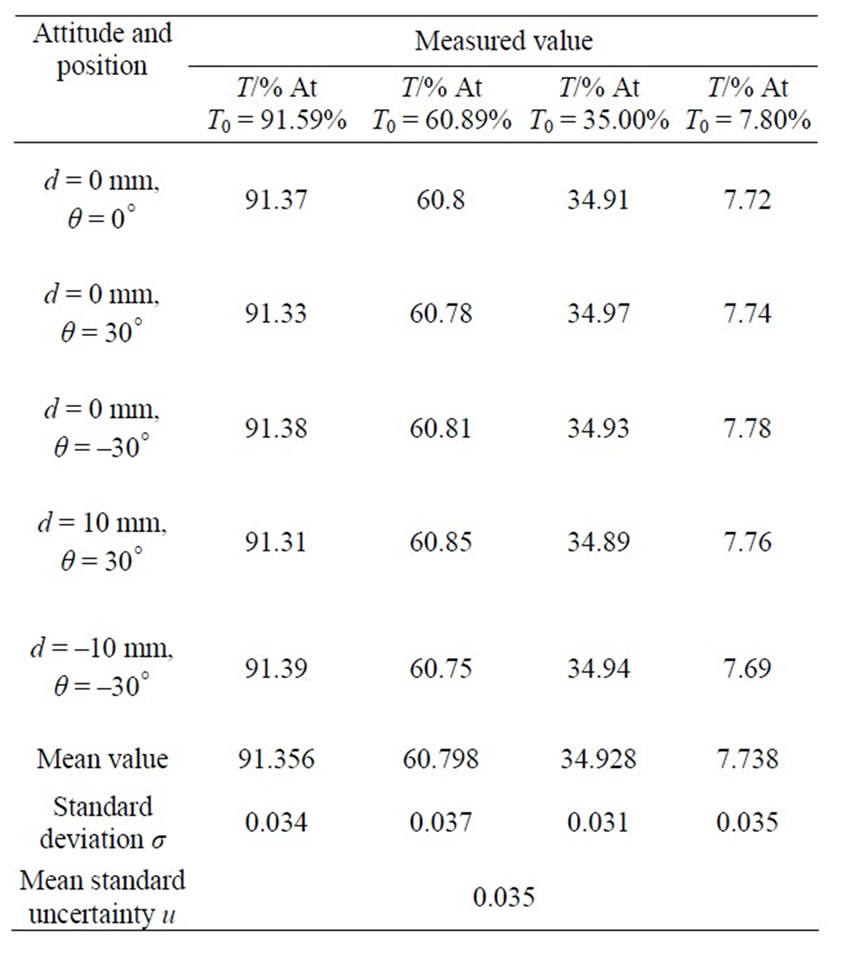
Table 1. Measured data for camera at different attitudes and positions.
the theoretical result u' < 0.02% analyzed above. But the uncertainty u is bigger than the uncertainty u' because the uncertainty u includes other uncertainties due to error sources including stray light, light intensity fluctuation, spectral variation and so on.
7. Conclusions
From the theoretical analysis above and transmittance experiment, conclusions are drawn as follows:
• Without considering systemic errors, the standard uncertainty of transmittance measurement method based on camera plane array is less than 0.035%, which means that the method is not sensitive to incident beam geometry.
• This method can effectively reduce the effect of beam geometry on transmittance measurement and eliminate cutting error during light transmission by realtime monitoring the incident spot.
• The method is appropriate for accurately measuring transmittance of nonplanar optical element.
REFERENCES
- H.-B. Li, L.-L. Hu, W.-Z. Lin, et al., “Study on Properties of Cerium-Doped Silica Glass Tube for Xenon Flash Lamp,” Chinese Journal of Lasers, Vol. 31, No. 6, 2004, pp. 654- 658.
- P. Y. Wu, P. F. Gu and J. F. Tang, “Spectrophotometer for Measuring Spectral Reflectance and Transmittance,” Applied Optics, Vol. 33, No. 10, 1994, pp. 1975-1979. doi:10.1364/AO.33.001975
- E. R. Woolliams, D. F. Pollard, N. J. Harrison, E. Theocharous and N. P. Fox, “New Facility for the High Accuracy Measurement of Lens Transmission,” Metrologia, Vol. 37, 2000, pp. 603-605. doi:10.1088/0026-1394/37/5/59
- L. Hanssen, “Integrating-Sphere Element and Method for Absolute Measurement of Transmittance, Reflectance, and Absorptance of Specular Samples,” Applied Optics, Vol. 40, No. 19, 2001, pp. 3196-3204. doi:10.1364/AO.40.003196
- E. I. Dmitriev, O. K. Filippov and V. G. Filippov, “Apparatus for Measuring the Spectral Directed Transmittance of Wide-Aperture Opticals,” Journal of Optical Technology, Vol. 75, No. 1, 2008, pp. 57-58.
- Z.-J. Yang and Y.-M. Li, “New Advances of Optical Metrology and Measurement in National Defence,” Cinese Applied Optics, Vol. 22, No. 4, 2001, pp. 35-39.
- W.-H. Bi, B.-J. Zhang, Y. Zhang and G.-W. Fu, “Novel Measurement of Coated Glass Visible Light Transmittance,” Chinese Opto-Electronic Engineering, Vol. 35, No. 4, 2008, pp. 53-57.
- Z. W. Yang, “Optical Measurement,” Beijing Institute of Technology Press, Beijing, 1995.
- Xi’an Institute of Applied Optics in National Defense of China, “Fine Measure Instrument.” www.jungong.net.images/gbz/jilang/jgj2.doc
- J. Cheung, J. L. Gardner, A. Migdall, S. Polyakov and M. Ware, “High Accuracy Dual Lens Transmittance Measurements,” Applied Optics, Vol. 46, No. 22, 2007, pp. 5396- 5400. doi:10.1364/AO.46.005396
NOTES
*Corresponding author.