Engineering
Vol. 4 No. 7 (2012) , Article ID: 20541 , 4 pages DOI:10.4236/eng.2012.47044
Hydrodynamics of the Pilot Scale Wet Scrubber with Restricted Outlet Absorbent Flow Rate
Department of Chemical and Mining Engineering, College of Engineering and Technology, University of Dar es Salaam, Dar es Salaam, Tanzania
Email: smanyele@udsm.ac.tz
Received February 24, 2012; revised April 20, 2012; accepted April 30, 2012
Keywords: Wet Scrubber; Liquid Accumulation Rate; Liquid Accumulation Level; Outlet Liquid Flow Rate; Liquid-to-Gas Ratio; Valve Opening Position; Incineration
ABSTRACT
This paper presents the hydrodynamics of the wet scrubber coupled to a pilot CFB incineration facility. The scrubber was operated using tap water as a scrubbing liquid. The outlet liquid flow rate, Qo, and accumulation rate, Qa, strongly depend on the inlet liquid flow rate, Qin, with different profiles. At higher Qin values, Qo stabilizes, leading to higher Qa and finally flooding. The values of Qa were higher than Qo except for Qin ranging between 0.53 and 0.72 L/s (safe operating range) in which Qa ≌ Qo and Qa = Qin/2. The outlet-to-inlet liquid flow rate ratio, Qo/Qin decreased for Qin > 0.53 L/s. The increase in the accumulation-to-inlet liquid flow rate ratio, Qa/Qin, at higher Qin indicates a change in flow regime towards flooding, accompanied by an abrupt increase in the height of accumulating liquid, Ha. The difference between Qa/Qin and Qo/Qin (denoted as, ΔQao/Qin), shows a minimum close to zero in the safe operating range. The gas flow rate towards the wet scrubber had slight effect on Qo and Qa when Qin was maintained constant. The ratio Qo/Qin decreased slightly with Ha/Ht irrespective of gas velocity. Changing the liquid-to-gas ratio, L/G and Qin strongly affects the maximum and minimum values of Qo/Qin and Qa/Qin.
1. Introduction
Wet scrubbers are wet collection devices for fumes, mists and suspended dusts used in air pollution control systems [1]. Other air pollution control devices for dusts control include electrostatic precipitators [2], cyclones [3], bag houses [2,4-6], etc. Wet scrubbers collect particles by direct contact with a liquid (usually water or lime water). Wet scrubbers have been used for air pollution control in incineration and waste-to-energy processes [7]. There are multitudes of scrubber designs grouped according to the liquid contacting mechanism used. In addition, scrubbers can be broadly classified as low-, moderate-, or highenergy units depending on how the liquid is introduced into the scrubber [8]. Energy requirements in wet scrubbers can be expressed as the pressure drop across the scrubber or by the level of contacting power, expressed as kWh/m3 gas treated [9]. The most common units of measurement for contacting power are kWh/1000m3 of gas, while the liquid circulation rates are given in liters per m3 of gas [10-12].
During wet scrubber operation, the liquid inlet flow rate corresponding to the existing gas flow rate is determined from mass balance equations. However, the outlet liquid flow rate is normally less than the inlet liquid flow rate due to some of the liquid accumulating in the bottom of the scrubber. The advantages of the liquid accumulation include sealing effect provided which prevents the flue gas from short-circuiting to the scrubbing solution tank and also as a cooling agent for the incoming hot gases. However, the critical disadvantage of liquid accumulation is the possibility of flooding, which occurs when the liquid level in wet scrubber becomes excessively high leading to overflow of the liquid towards the gas inlet pipe and thus interfering with the combustion process.
This paper investigates the hydrodynamics of the wet scrubber based on inlet and outlet liquid flow rates, accumulation rate for the liquid in the wet scrubber bottom (expressed as the accumulation rate and accumulation height), gas flow rate, liquid outlet control valve opening position, liquid-to-gas ratio, etc.
2. Literature Review
Wet scrubbers rely on a liquid spray to remove gaseous emissions, with particulate control as a secondary function. The major types of wet scrubbers are venturi scrubbers, jet (fume) scrubbers, and spray towers or chambers. Venturi scrubber’s consume large quantities of scrubbing liquid and electric power and incur high pressure drops. Jet or fume scrubbers rely on the kinetic energy of the liquid stream. The typical removal efficiency of a jet or fume scrubber (for particles 10 mm or less) is lower than that of a venturi scrubber. Spray towers can handle larger gas flows with minimal pressure drop. Spray towers are also used as gas coolers where the hot gases are cooled prior to exiting the process to the environment.
Because wet scrubbers may contribute to corrosion, removal of water from the effluent gas from scrubbers may be necessary. Another consideration is that wet scrubbing results in a liquid effluent contaminated with solids present in the gas stream. Wet scrubbing technology is used where the contaminant cannot be removed easily in a dry form, for soluble gases and wettable particles, and if the contaminant will undergo some subsequent wet process (such as recovery, wet separation or settling, or neutralization). Gas flow rates range from 20 to 3000 m3/min. Gas flow rates approximately 2000 m3/min may have a corresponding pressure drop of 25 cm H2O column [13]. Figure 1 shows the typical wet scrubber designs.
Wet scrubbers capture relatively small dust particles with large liquid droplets. In most wet scrubbing systems, droplets produced are generally larger than 50 µm (in the 150 to 500 micrometer range). The size distribution of particles to be collected is source specific. For example, particles produced by mechanical means (crush or grind) tend to be large (above 10 µm); whereas, particles produced from combustion or a chemical reaction will have a substantial portion of small (i.e., less than 5 µm) and submicrometer-sized particles. Several mechanisms for particle removal in a wet scrubbing system are summarized in Table 1.
The most critical sized particles are those in the 0.1 to 0.5 μm range because they are the most difficult for wet scrubbers to collect. A relationship between particle size and collection efficiency for typical wet scrubber exist, such that from 0.1 μm, the collection efficiency drops below 90% and increases again beyond 0.5 μm reaching about 100% at 2 μm and above.
In order to properly design a particulate wet scrubber, one must obtain as much information as possible concerning the characteristics of the flue gas stream to be treated. This information must be obtained or estimated
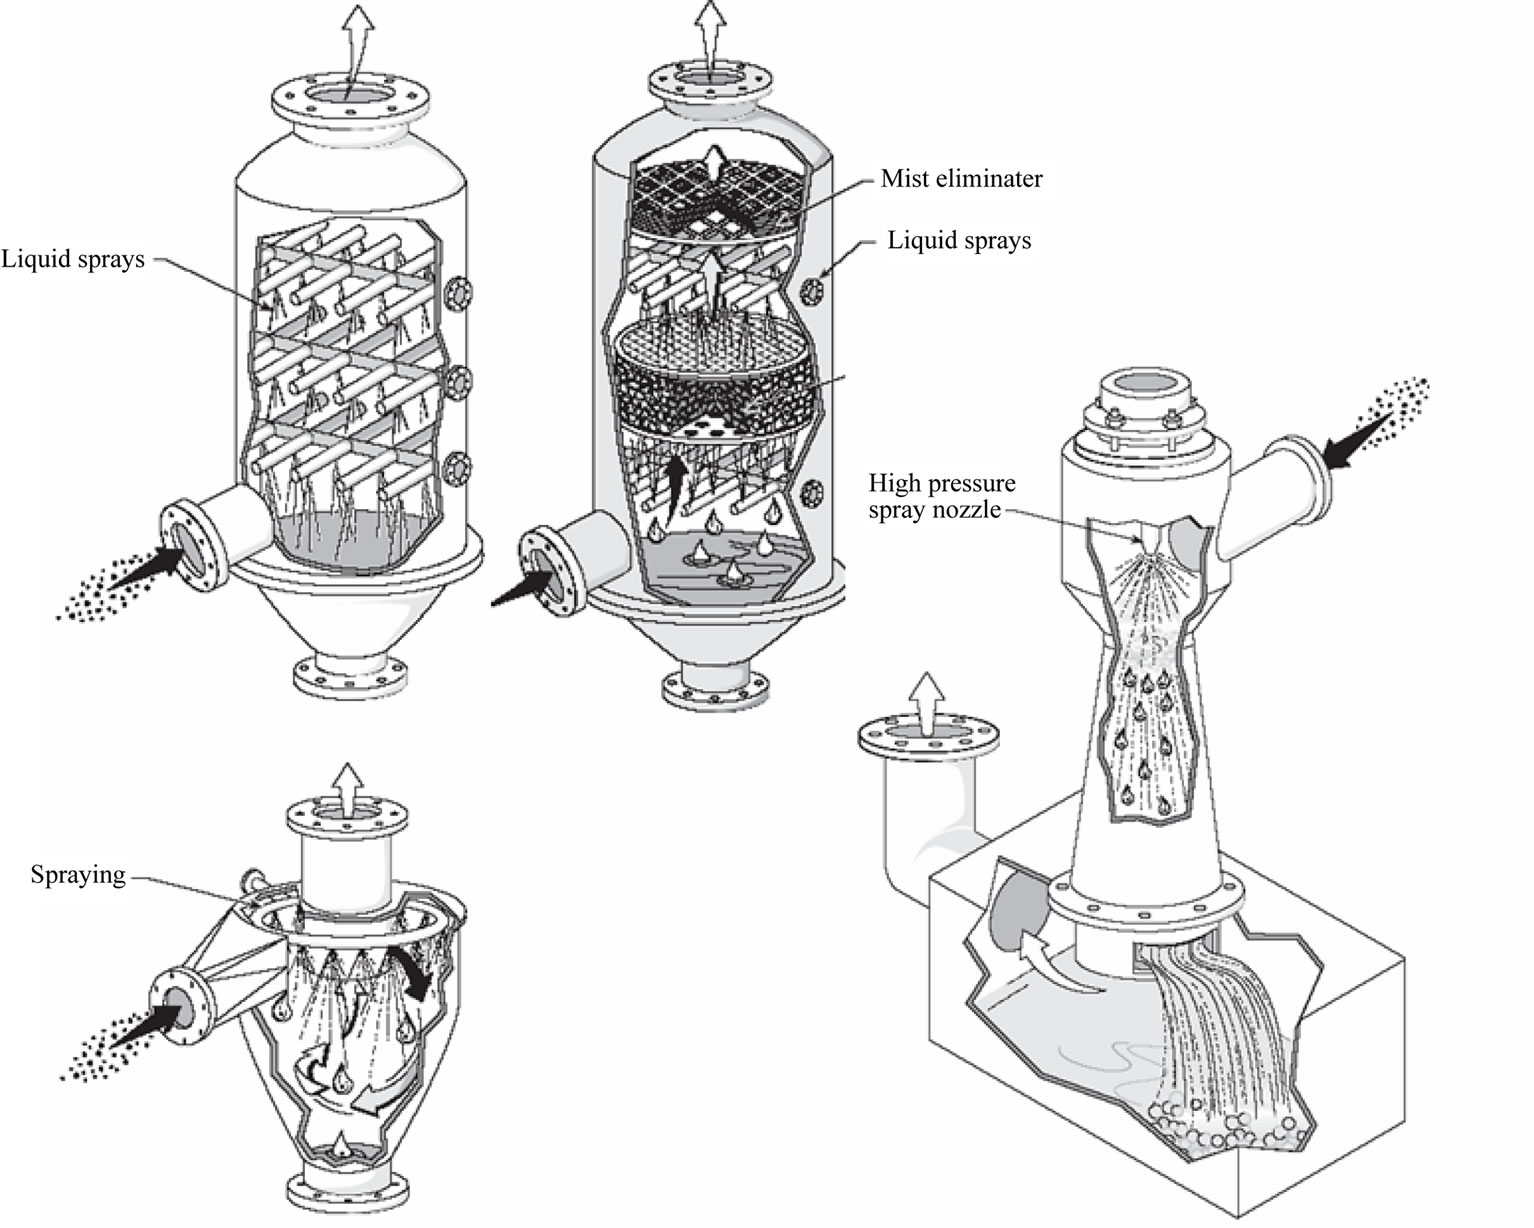
Figure 1. Typical designs for wet scrubber configurations (spray chamber, counter-current-flow packed tower, irrigated cyclone scrubber, and venturi scrubber).
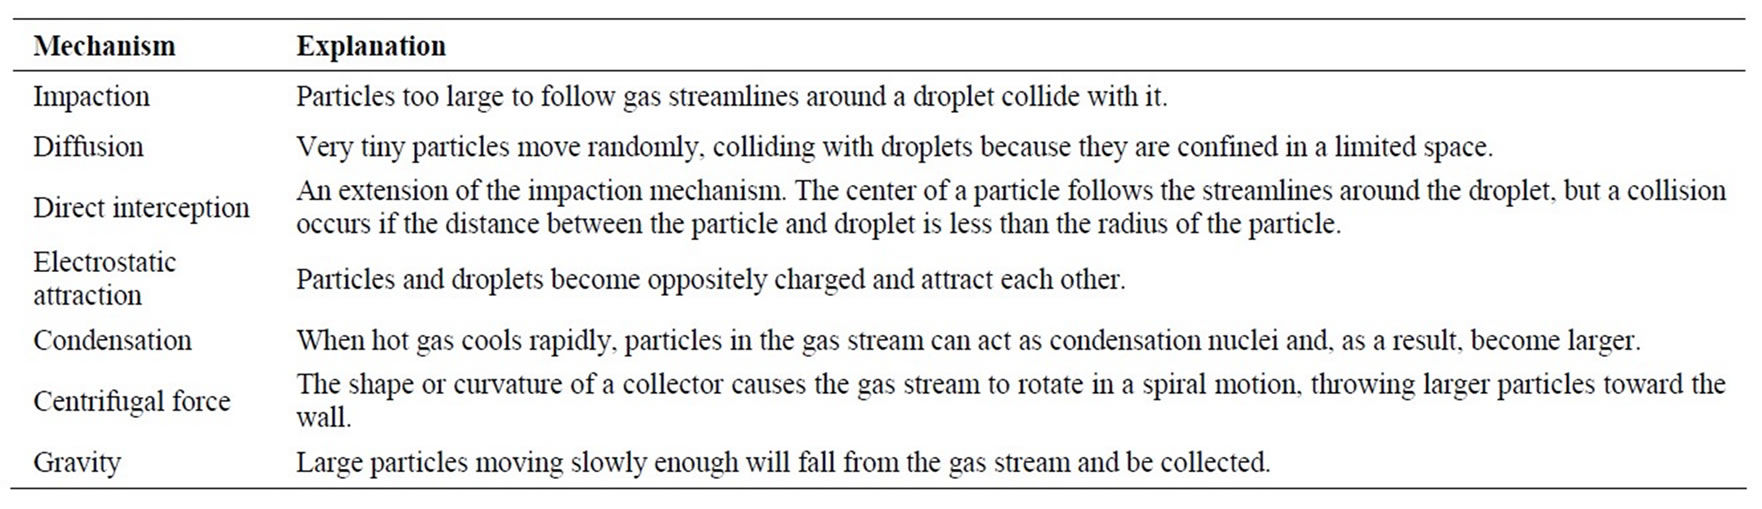
Table 1. Particle collection mechanisms for wet scrubbing systems.
for both the average and maximum ranges that will occur. During combustion, for instance, the gas flow rate always exceeds the blower capacity due to additional gases generated. Scrubbing systems must be able to operate effectively at both the normal day-to-day conditions as well as to accommodate any maximum ranges.
There are a number of parameters that affect particle and acid gas removal efficiency and must be considered in the design of a wet scrubbing system, that is, dust properties (particle size distribution being most important), exhaust gas characteristics, static pressure drop [13], scrubber liquid flow rate [12], required particle removal efficiencies, and removal of entrained liquid droplets.
Dust properties include particle size distribution, concentration and chemical composition. The particle size distribution is the most important factor that affects scrubber design and operation. However, particle size distribution data is rarely available for most sources and generally must be estimated from similar type sources. The average and maximum particle concentrations (or grain loading) must be obtained to properly size the scrubber and the solids removal system. For incinerators, grain loading depends on amount of fly ash escaping from the primary and secondary combustion chambers. The chemical composition of the dust particle is important as it determines if the material will cause any plugging problems or precipitate problems.
Liquid flow rate is based on the gas flow rate, temperature in the scrubber, compensation for evaporation rate and type of scrubbing system utilized. Values need to be identified for both normal and maximum operating conditions. Also, for the extended life of pumps, the recirculation rate and permissible levels of suspended solids in the recirculated liquid need to be identified. In this study, the scrubbing liquid is continuously pumped into the scrubber at a high rate with recirculation.
3. Materials and Methods
Before you begin to format your paper, first write and save the content as a separate text file. Keep your text and graphic files separate until after the text has been formatted and styled. Do not use hard tabs, and limit use of hard returns to only one return at the end of a paragraph. Do not add any kind of pagination anywhere in the paper. Do not number text heads—the template will do that for you.
Finally, complete content and organizational editing before formatting. Please take note of the following items when proofreading spelling and grammar:
3.1. Process Description
The test series consisted of runs with gas flow rates ranging from 0 to 14 m/s and liquid flow rates ranging from 0.15 to 0.95 L/s. Different combinations of gas and liquid flow rates were used. Experiments were designed to study the hydrodynamics of the scrubber Stage 1, which is similar to Stage 2. The gas flow rate was controlled by using a flap on the blower suction side (connected to the wind box), while the inlet liquid flow rate from the pump was controlled using a gate valve connected to a flow meter. The flue gas from the combustion chamber exits the riser and passes through a series of cyclones for removing solid particles, heat exchanger for reducing temperature and finally passes through the multistage wet scrubbers. Figure 2 shows the experimental setup, incorporating a circulating fluidized bed incineration facility with multistage wet scrubbers used in this study.
3.2. Varying the Outlet Valve Opening Position
The outlet liquid flow rate from the wet scrubber was controlled using the valve connected to the outlet pipe at the bottom of the scrubber Stage 1. Three opening positions, Vop, were studied, that is full-open, 3/4-open, and 1/2-open positions, as a means of controlling the outlet flow rate, Qo, thus, the assumed values of Vop were 1.0, 0.75, and 0.5, respectively. Lower values of Vop were not tested because below 1/2-open position, the accumulation rate was exceedingly high leading to flooding of the scrubber. The outlet liquid flow rate was determined by
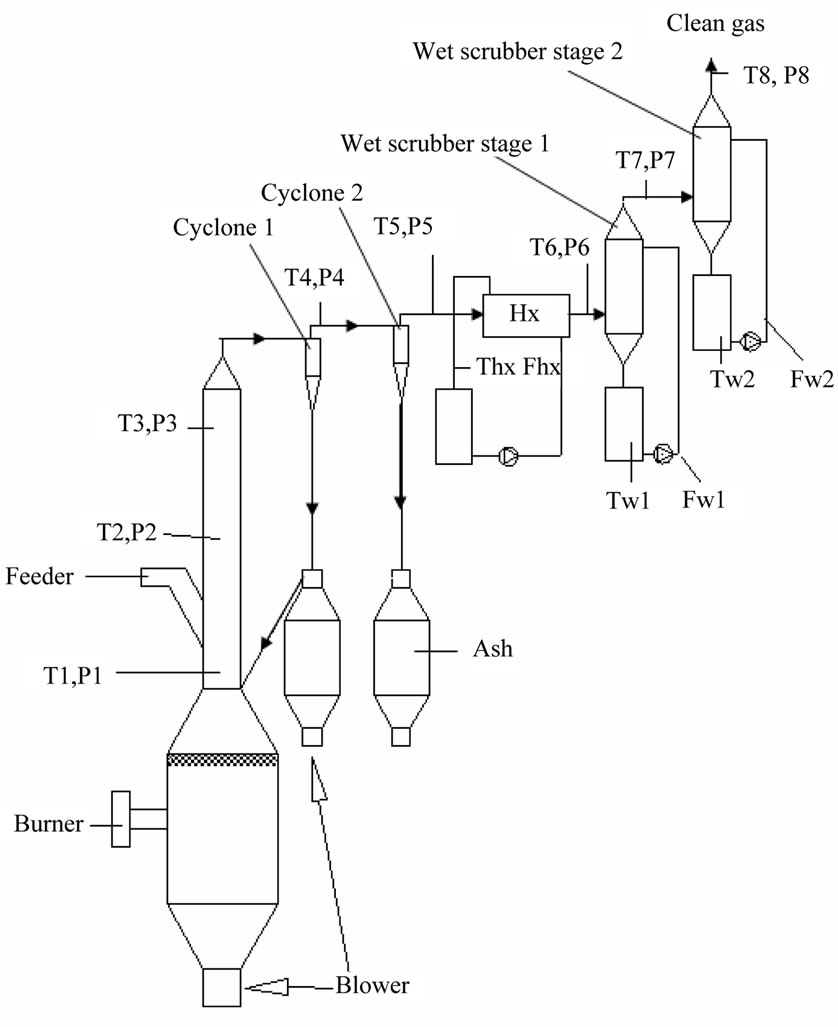
Figure 2. The experimental set up.
noting the time required to collect a known volume of liquid using a stopwatch. The average of three measurements was used to establish the outlet flow rate.
3.3. Determination of Liquid Accumulation Rate in the Wet Scrubber
A known flow rate of scrubbing liquid was introduced into the scrubber in the form of a spray directed downwards. The optimum operation of the wet scrubber was measured by using the scrubbing liquid level that remains within the scrubber, defined as liquid accumulation rate, Qa. If the liquid accumulation rate is too high, the scrubbing liquid flows back to the heat exchanger, through the gas duct, and finally to the cyclones and combustion chamber. An accumulation liquid level was necessary in order to provide sealing effect to prevent the gas from short-circuiting to the scrubbing solution tank. This reason necessitated studying the water level within the scrubber bottom. The liquid accumulation rate was determined using Equation (1):
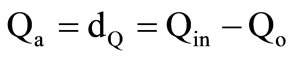 (1)
(1)
The liquid accumulation data was collected at different gas flow rates. The level of scrubbing liquid within the scrubber, Ha, was determined by reading the level of liquid in the level indicator tube. The data was collected by varying the inlet liquid flow rate from 0.15 to 0.95 L/s. There are three terms used for accumulation, these are: Accumulation rate (dQ or Qa) is the amount of scrubbing liquid retained in the wet scrubber per unit time; liquid accumulation height (Ha) is the height occupied by scrubbing liquid retained in the wet scrubber; and, effective height (He = Ht – Ha), which is the height of wet scrubber used for scrubbing processes between the liquid level and top of the scrubber. Thus, accumulation reduces the available space for mass and heat transfer in the wet scrubber.
The difference between Qa and Qo was determined from Equation (2):
 (2)
(2)
3.4. Liquid Flow Rate Ratios
Two ratios were defined in order to normalize the wet scrubber data, so that it can be used in any scale of operation. The outlet-to-inlet liquid flow rate ratio, Qo/Qin, is the ratio between outlet flow rate and inlet flow rate, data of which eliminates the scale dependency of the results. Another useful quantity is the accumulation-to-inlet liquid flow rate ratio, Qa/Qin, which is the ratio between liquid accumulation rate and the inlet flow rate. The difference between the two quantities was estimated as per Equation (3):
 (3)
(3)
3.5. Determination of the Liquid-to-Gas Ratio
The liquid to gas ratio was calculated by dividing the liquid flow rate (L/s) by the flow rate of the gas in the wet scrubber (m3/s) giving Q/G in litres of liquid per m3 of gas (L/m3), as shown in Equation (4):
 (4)
(4)
Each velocity of the gas applied was multiplied by the cross-sectional area of the duct of the blower to get volumetric flow rate of gas in m3/s.
4. Results and Discussion
4.1. Variation of Qo with Qin
Figure 3 shows the variation of Qo (L/s) with Qin (L/s) at variation gas velocities in the combustion chamber, Ug (m/s), when the scrubbing solution outlet valve is full open, 3/4-open and 1/2-open. The curves have similar shapes for all valve opening positions, that is, increasing initially and stabilizing for Qin > 0.8 L/s as reported also by Said et al. (2010). Stabilizing curves indicate that Qo
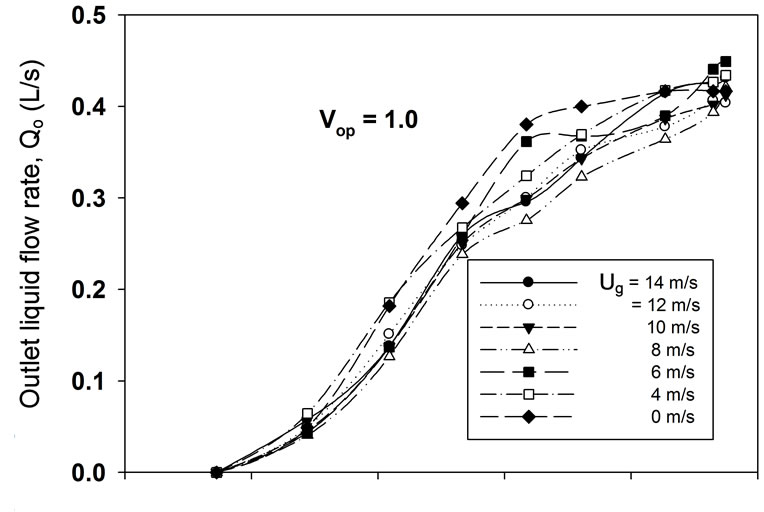
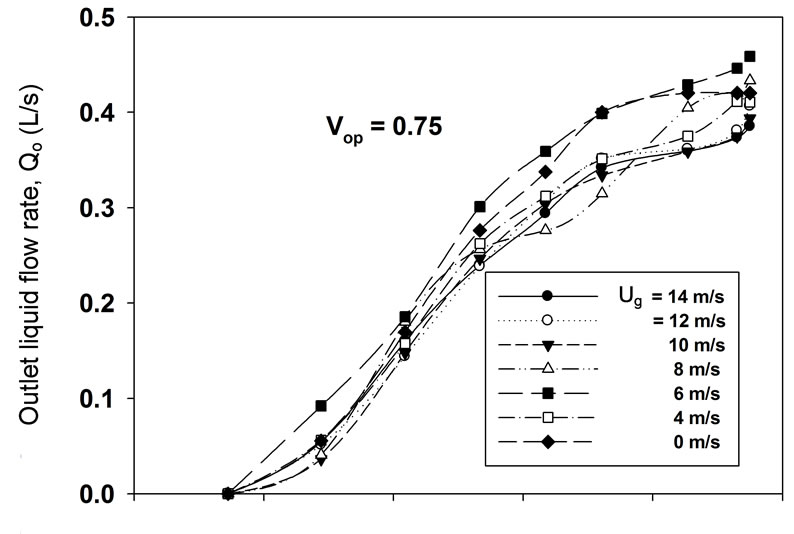
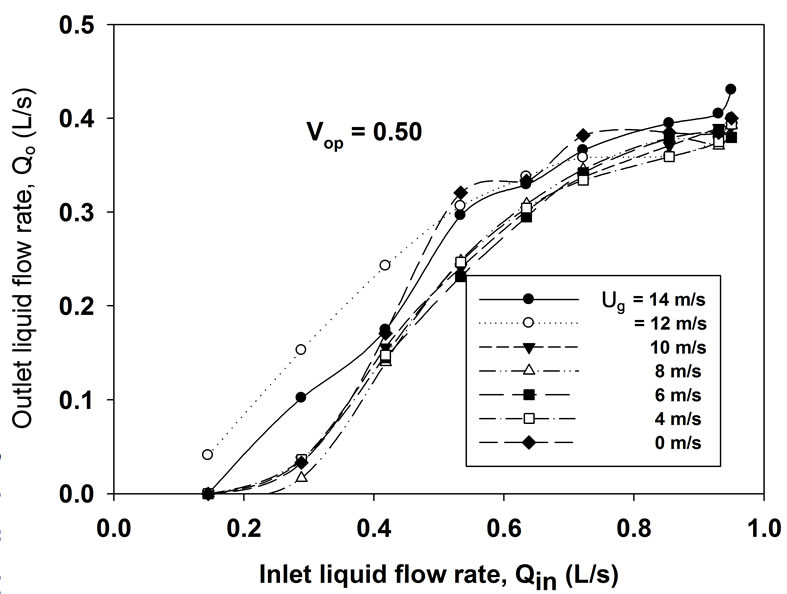
Figure 3. Variation of the outlet liquid flow rate with the inlet liquid flow rate at different valve opening position and flue gas velocities.
ceases to increase, implying that also that Qa increases further (based on Equation (1)) which can lead to flooding. Thus, Qin = 0.8 L/s is assumed to be the maximum inlet liquid flow rate. In all combinations of operating conditions of Ug, Qin, and Vop, Qo is less than Qin indicating that there is always liquid accumulating in the wet scrubber. There is a delay in the appearance of Qo, which signifies that there is also a minimum inlet flow rate at which the scrubbing solution flows outside the scrubber, that is when Qin > 0.2 L/s, as shown in Figure 3. The minimum liquid flow rate into the scrubber depends on gas velocity and valve opening position.
4.2. Dependency of Qa on Qin
The variation of Qa with Qin (Figure 4) shows different profiles compared to those of Qo. Despite the general increase in Qa with increasing Qin, Qa stabilizes for Qin ranging between 0.4 and 0.7 L/s even when the outlet valve is open (Vop = 1.0, 0.75 and 0.5). This behaviour was also reported by Said et al. (2010). The initial increase in Qa at very low values of Qin was not reported by former researchers because the range of Qin was shorter,
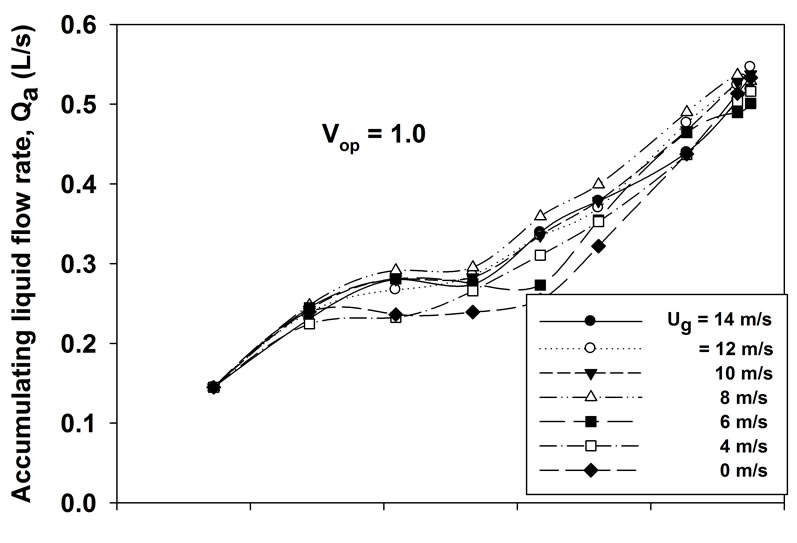
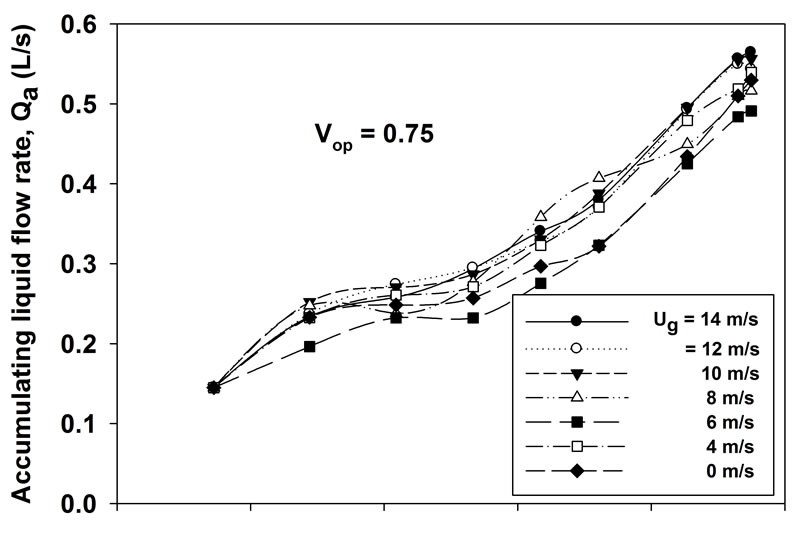
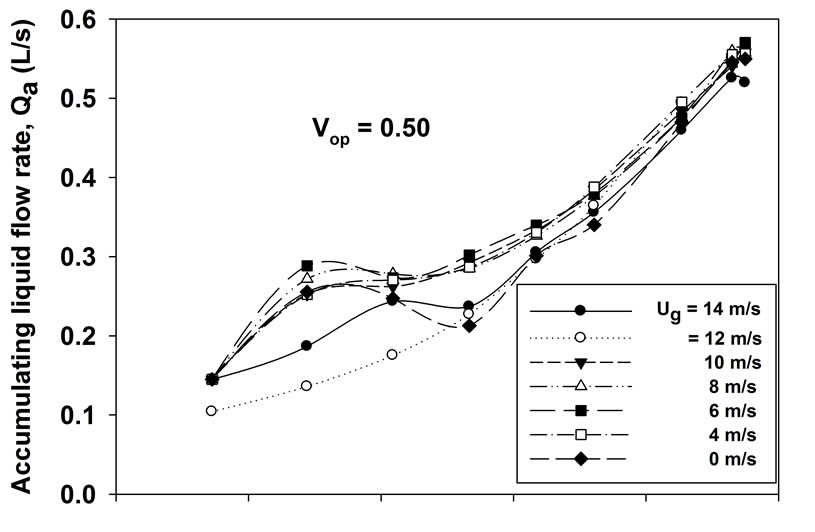
Figure 4. Variation of Qa with Qin in the scrubber at different outlet valve opening positions and the flue gas velocities.
starting from 0.3 L/s onwards different from minimum value used in this study, i.e., Qin = 0.1 L/s. Similar to results reported in literature [12], the effect of Ug on Qa diminishes at higher Qin higher than 0.7 L/s, below which, Qa increases sharply with Qin for all valve opening positions. The accumulation rate can also be regarded as a cause of deviation of Qo from Qin. This deviation is important for safe operation of wet scrubbers connected to combustion systems which receive hot gases.
4.3. Comparison between Qo and Qa at Different Valve Opening Position
Based on the rsults presented in Figures 3 and 4, it is evident that a difference exists between Qa and Qo not only in actual values, but also in the way these parameters change with Qin. Figure 5 presents the variation the average values of Qo and Qa values (averaged over all gas velocities) for the three valve positions (full-open, 3/4-open and half-ope 3/4 with inlet scrubbing liquid flow rate, Qin. For Qin < 0.5 L/s, and Qin > 0.7, Qa values are higher than Qo. The values Qo and Qa are equal in the Qin range between 0.5 and 0.7 L/s. Above half-open outlet valve position (Vop > 0.5), the valve opening position was observed to have a small effect on the outlet flow rate such that the averaged values for all gas flow rates fall almost on the same curve as shown in the Figure 5. Similarly, the average values of Qa for different air flow rates fall on the same curve, regardless of changes in valve opening positions for Vop > 0.5. It is evident from Figure 5 that the Qo and Qa become equal for Qin values ranging between 0.53 and 0.72 L/s, while before and after this range, Qa, values are higher than Qo. Superimposed in Figure 5, is the plot of the quantity ΔQao, that is, the difference between Qa and Qo against Qin. This difference shows a minimum turning point equal to zero for
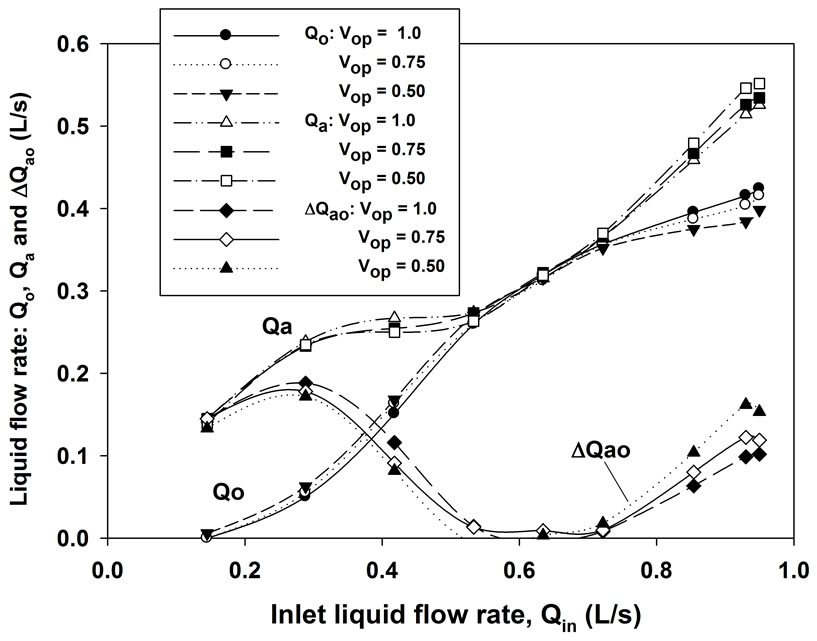
Figure 5. Comparison of the averaged outlet liquid flowrate and liquid accumulation rate in the wet scrubber at different valve opening positions.
Qin between 0.533 and 0.722 L/s.
4.4. Dependnency of Qo/Qin and Qa/Qin Ratios on Qin
Figure 6 shows the variation of the ratio (Qo/Qin) with Qin at different conditions of gas flow rate and valve opening positions. Initially, at low values of Qin, the ratio Qo/Qin increases faster, reaching a maximum value, location of which depends slightly on gas velocity, Ug and valve opening position, Vop. The values of Qo/Qin, however, decreases slightly after a maximum, An observation
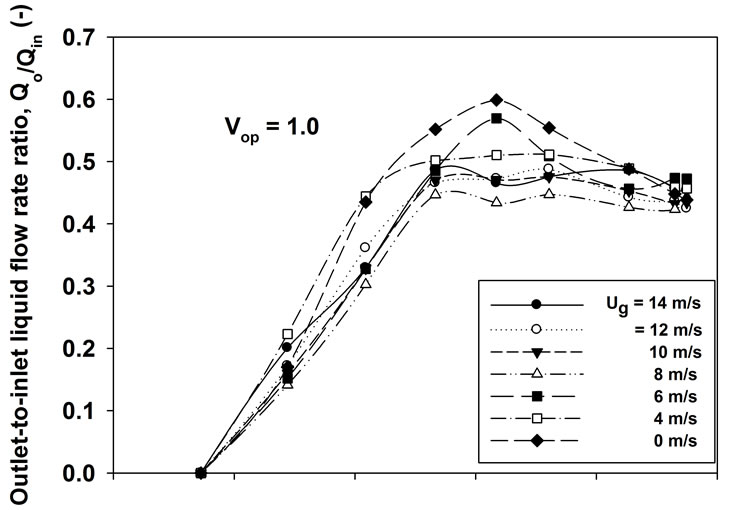
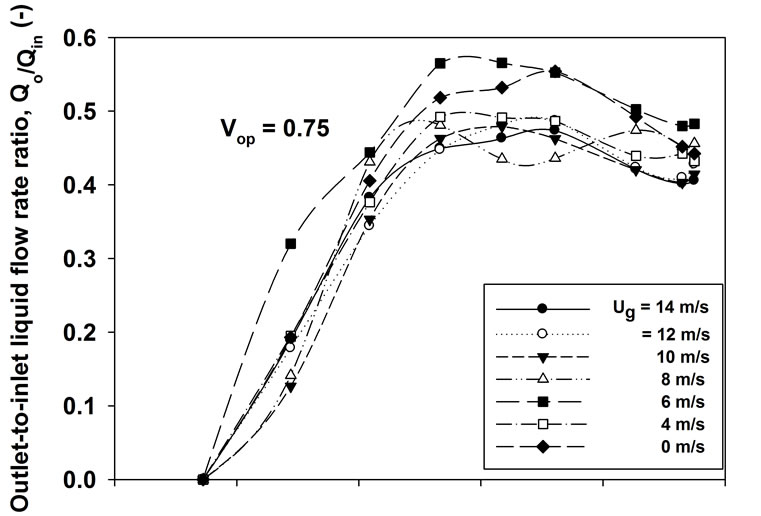
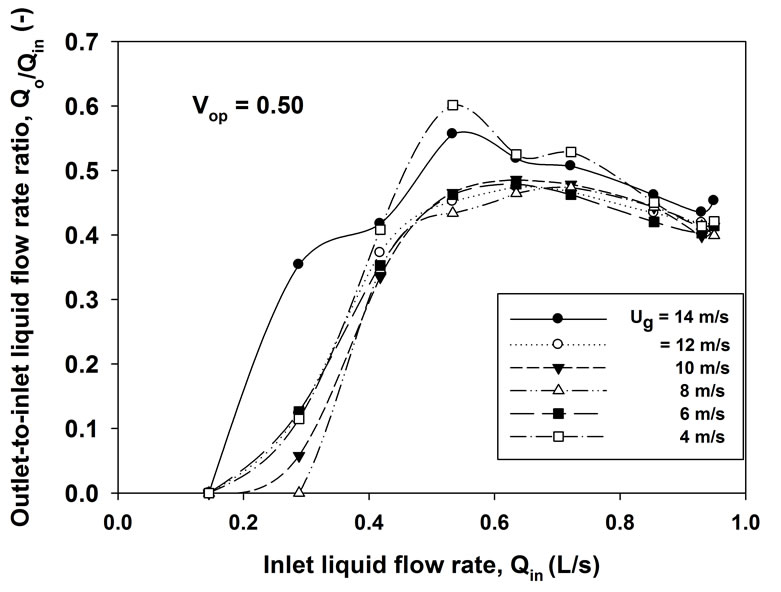
Figure 6. Variation of outlet-to-inlet liquid flow rate ratio with inlet liquid flow rate under different outlet valve opening position and gas velocites.
which can be attributed to the fact that Qo ceases to increase as Qin is increased from 0.5 to 0.95 L/s such that the ratio Qo/Qin decreases also, as reported also in Figure 3. It should be noted that Qo/Qin do not exist for Qin < 0.2 L/s because no outlet liquid flow is observed at very low values of Qin.
Figure 7 shows the variation of Qa/Qin ratio with Qin
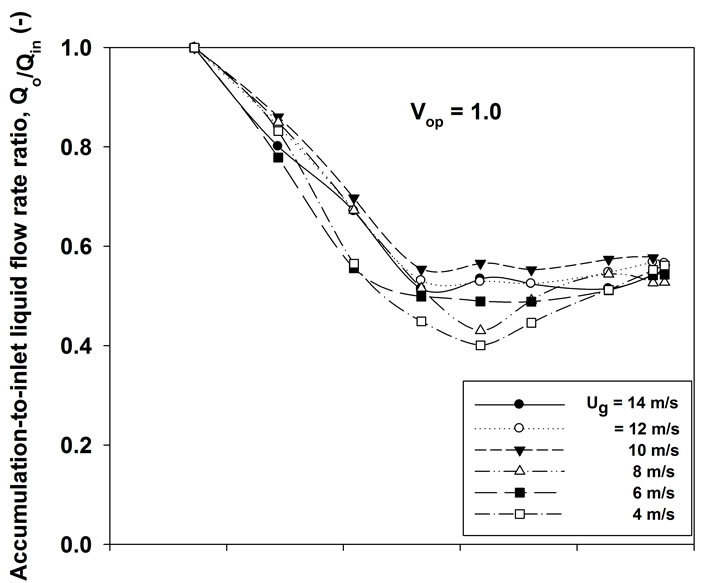
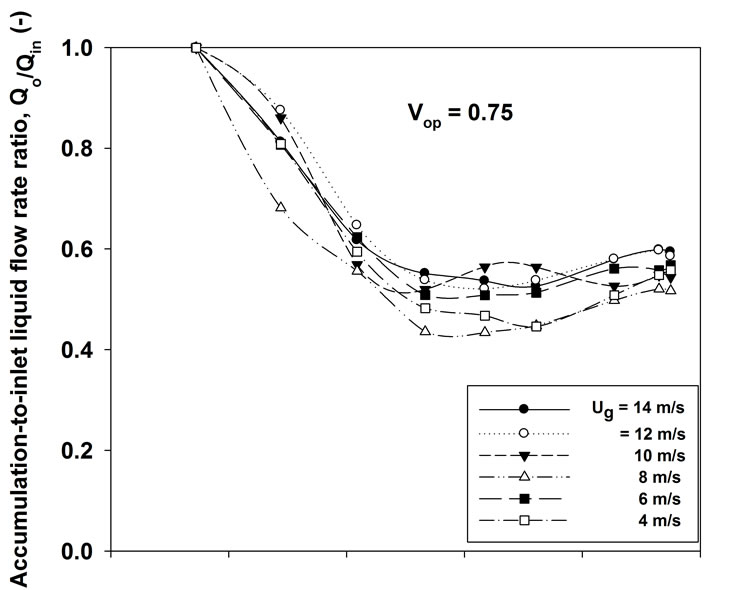
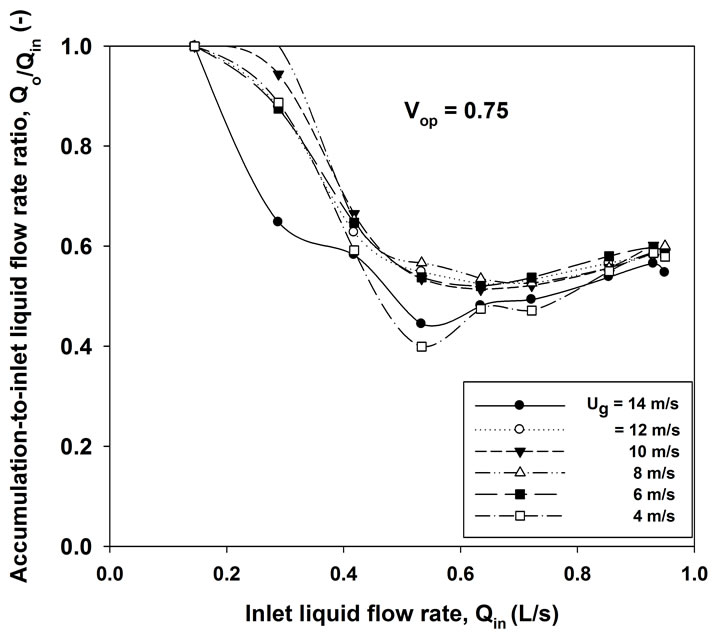
Figure 7. Variation of accumulation-to-inlet liquid flow rates with Qin under different outlet valve opening positions and gas velocities.
for different valve opening positions and gas flow rates. Different from Qo/Qin, Qa/Qin decreases with increasing Qin until a minimum point is reached beyond which Qa/Qin increases slightly.
However, both ratios show turning points so that a quadratic relationship is depicted between these parameters. This shows that as Qin is increased beyond 0.5 L/s the accumulation rate is low compared to Qin, but beyond the minimum point Qa is still lower than Qin but higher compared to the original values. The fact Qa/Qin starts at 1.0 is because initially all the liquid entering the scrubber do not flow out (Qo = 0) at lower Qin values and Qa = Qin. For Qin < 0.2 L/s, Qa/Qin = 1.0 indicating that all the liquid entering the wet scrubber accumulates with Qo = 0. This is because, at low inlet liquid flow rate, the accumulating liquid is filing the wet scrubber bottom and no outlet flow is observed.
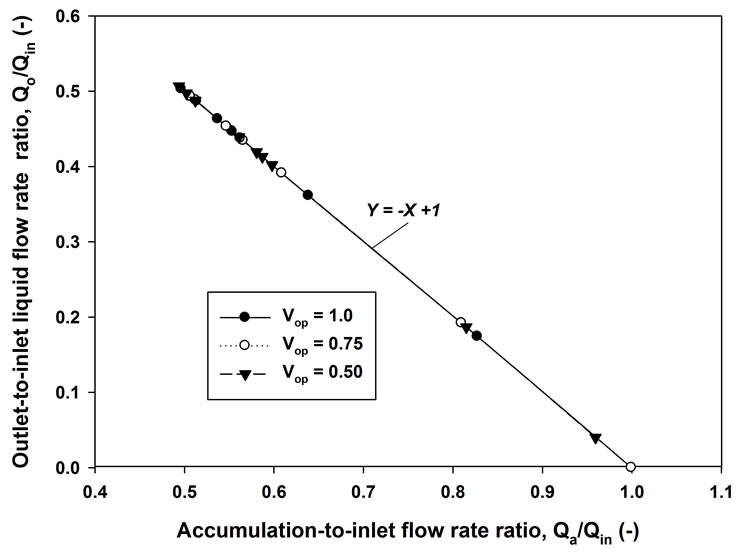
Figure 8 compares the ratios Qa/Qin and Qo/Qin at various Qin values and valve opening positions. The two ratios are equal when Qin = 0.5 to 0.7 where they are equal to 0.5. The curves are opposite in nature because Qin = Qa + Qo. In general, Qa is higher than Qo, except for the Qin values from 0.5 to 0.7 L/s. Superimposed in Figure 8 is the variation of the ratio ΔQao/Qin with Qin. Initially, the difference between Qa/Qin and Qo/Qin is very high but drops to zero when Qin reaches 0.53 to 0.75 L/s. Beyond this range, ΔQao/Qin increases again due to abrupt increase in Qa as flow regime approaches flooding. The re-surfacing of the ratio ΔQao/Qin is an indication that the flow regime is the wet scrubber is changing towards flooding regime.
4.5. Effect of Gas Flow Rate on Qo and Qa
The flow of hot gases into the wet scrubber and evaporating water increases the pressure in the scrubber shell.
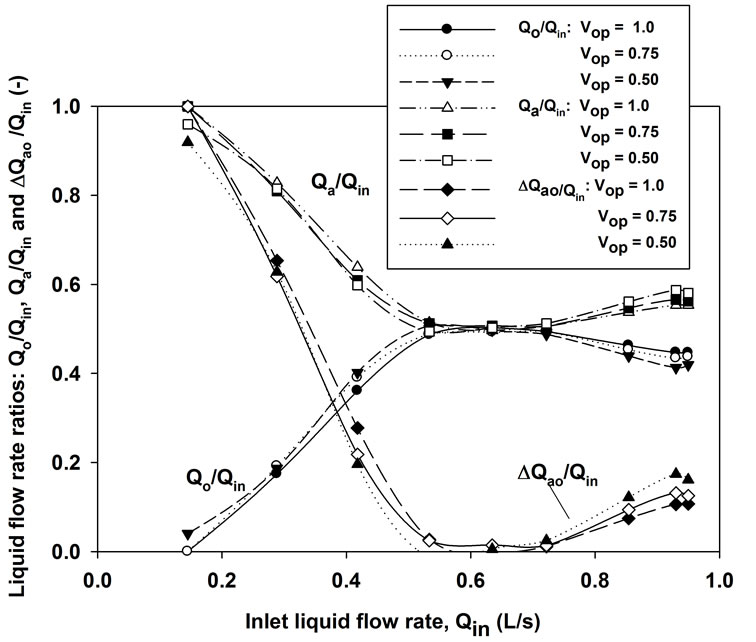
Figure 8. Comparison of outlet-to-inlet and accumulationto-inlet flow rate ratios in the wet scrubber under different outlet valve opening positions.
As a result, the pressure at the top of the accumulating liquid surface is expected to increase the outlet liquid flow rate. However, the trend was observed to be strongly dependent on Qin than on Ug. Figure 9 shows the variation of Qo and Qa with gas velocity Ug at different inlet liquid flow rates. Results show that both Qa and Qo are independent of Ug but rather depend strongly on Qin. The higher the inlet liquid flow rate, Qin, the higher the outlet liquid flow rate, Qo, and the liquid accumulation rate, Qa. Under incineration conditions, Ug will increase beyond gas flow forced by blower, but will not strongly affect Qa and Qin as shown in Figure 9. Moreover, the increase in Qin due to generation of the flue gas is shown to have no effect on the hydrodynamics of the wet scrubber.
4.6. Effect of Qa and Ha on Outlet Liquid Flow Rate
Both Ha and Qa affects the outlet liquid flow rate from the scrubber. Increasing Ha adds hydrostatic head which pushes the accumulated liquid downward, hence increasing the outlet flow rate. Figure 10 shows the effect of Ha on the outlet liquid flow rate, Qo (at 1/2 open valve position). In general, Qo increases with Ha showing that
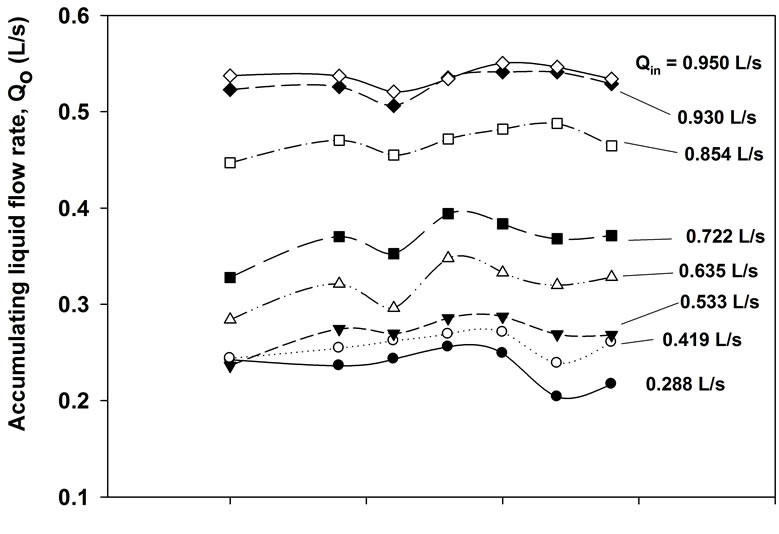
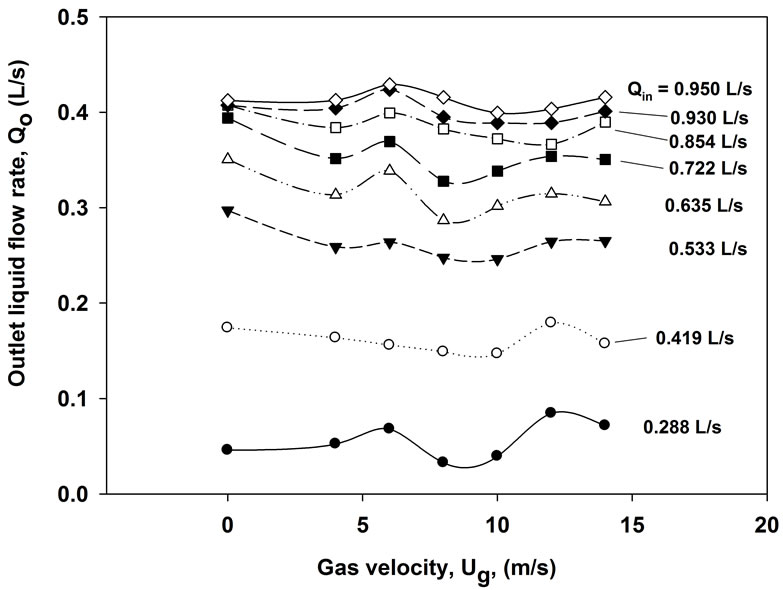
Figure 9. Variation of the outlet liquid flow rate and accumulation rate in the liquid scrubber with gas velocity at different inlet liquid flow rate.
 Normalized liquid accumulation height, Ha/Ht (-)
 Figure 10. Dependence of Qo on Qa and Ha in the wet scrubber at different gas velocities (when the valve is half-open).
the hydrostatic head created by the accumulating liquid increases the scrubbing liquid outlet flow rate. However, Qo depends also on the gas flow rate, which creates high pressure in the effective height of the scrubber, hence increasing Qo and minimizing Ha and Qa.
At lower Qa values, Qo is very low, and remains constant until Qa is higher than 0.2 L/s, where the former increases abruptly. For Qa > 0.4 L/s, Qo stabilizes at about 0.4 L/s, which corresponds to Qin in the range of 0.533 to 0.722 L/s as observed in Figures 3 and 5. The behaviour shown in Figure 10 can be attributed to the balance between gas pressure in the equivalent scrubber height and the hydrostatic head of the accumulated liquid corresponding to Ha.
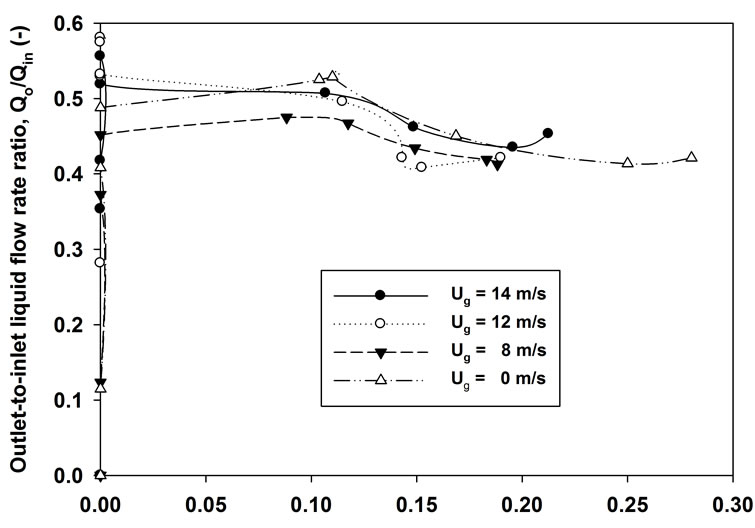
4.7. Effect of L/G Ratio on the Outlet Liquid Flow Rate
The L/G ratio is a combination of two parameters: liquid inlet flow rate, Qin and gas flow rate Qg. The effect of changing L/G ratio on the wet scrubber hydrodynamics was studied in order to establish the proper operating conditions for the wet scrubber. Figure 11 shows the effect of increasing L/G ratio on the outlet liquid flow rate, Qo, at different values of Qin. The range of values of
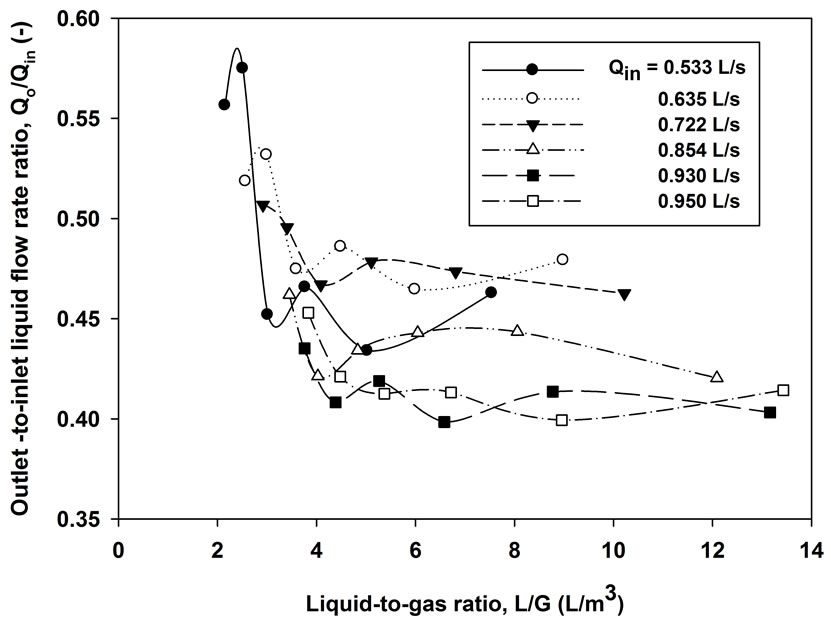
Figure 11. Mapping of Qo values at different liquid-to-gas ratios and specific inlet liquid flow rates in the wet scrubber.
L/G observed in the wet scrubber increases with increasing value of Qin, such that very narrow range exit at lower values of Qin (for instance, 0.288 L/s) and very wide range of L/G at higher values of Qin (that is, 0.95 L/s). The curves at different values of Qin are similar, except that the range of values of Qo (vertical position of the curves) depends solely on Qin. While increasing Qin causes the curves to shift upwards, the latter widens in the L/G range, and the troughs become wider as well.
4.8. Effect of L/G Ratio on Liquid Accumulation Rate
Figure 12 shows the variation of Qa/Qin with the liquidto-gas ratio, L/G. As L/G is increased, the Qa/Qin values shows a peak, which migrates to the right as the inlet liquid flow rate is increased. Horizontally, Qa curves increases as Qin increases. The turning point indicates that at higher L/G ratio, that is higher liquid inlet flow rate at constant gas flow rate, the Qa/Qin decreases as a result of higher Qin. Similarly, increasing Qin raises the vertical position of the turning points. Moreover, higher Qin leads to higher Qa as stated before.
5. Conclusions
It can be concluded from the above findings that:
1) The outlet liquid flow rate from the scrubber depends strongly on the inlet liquid flow rate. However, at a very high inlet liquid flow rate the outlet liquid flow rate do not increase further, indicating possibility of flooding.
2) Despite the fact that the rate of accumulation increases with Qin, the profiles of Qa versus Qin are different from those of Qo.
3) The accumulation ate is always higher than the liquid outlet flow rate except for Qin ranging between
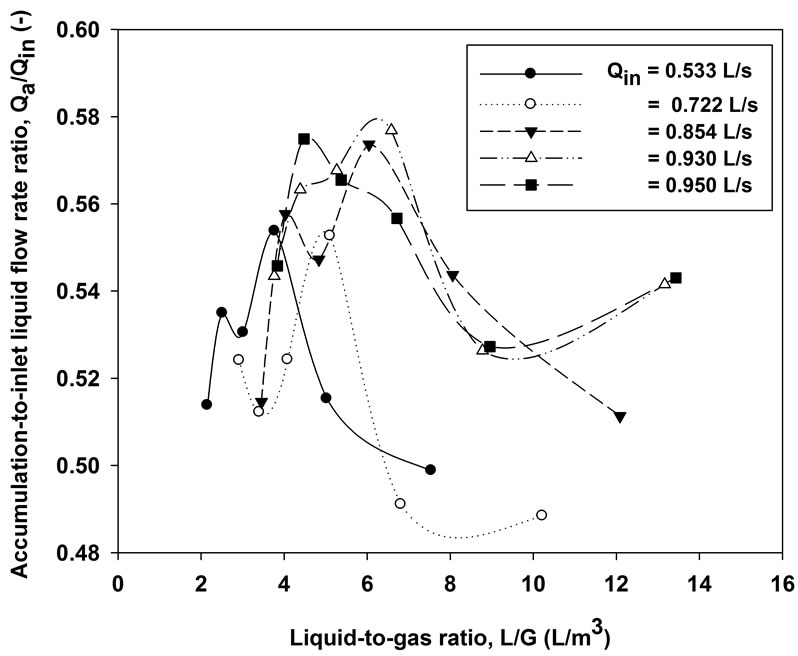
Figure 12. Values of Qa at different liquid-to-gas ratios and specific inlet liquid flow rates in the wet scrubber.
0.53 and 0.75 L/s, in which Qa = Qo, and Qa = Qin/2. This range defines the safe operating range without regime change towards flooding.
4) The slight decrease in the outlet-to inlet liquid flow rate ratio, Qo/Qin for Qin > 0.5 L/s signifies that Qo remains constant even when Qin is increased further. This observation is important to the operation of the wet scrubber as flowing can be avoided by limiting Qin.
5) The initial decrease in Qa/Qin indicates that Qa is always lower than Qin. However, the slight increase in Qa/Qin at higher inlet liquid flow rate is an indication of a change in flow regime towards flooding, which can be avoided by observing the liquid accumulation height, Ha.
6) When compared, the difference between Qa/Qin and Qo/Qin decreases to zero as Qin is increased between 0.53 and 0.72 L/s, beyond which the difference increases again.
7) The gas flow rate towards the wet scrubber has slight effect on Qo and Qa if the inlet liquid flow rate is maintained constant. This implies that since the incineration cycle is always carried out at constant liquid flow rate, below the flooding point, then the scrubber hydrodynamics is not affected even when the changes in flue gas flow rate due to combustion and blower action are extremely high.
8) The liquid-to-gas ratio, L/G, strongly affects both Qo and Qa and hence Qo/Qin and Qa/Qin. The relationship between L/G and the liquid flow rate ratios shows maximum turning points in different zones along the L/G axis.
6. Acknowledgements
The author is grateful for the financial support from SIDA/Sarec core support through the University of Dar es Salaam.
REFERENCES
- C. D. Cooper and F. C. Alley, “Air Pollution Control: A Design Approach,” Prospect Heights, III, Wavelans Press, 1986.
- W. R. Carson, W. C. Nobles, M. H. Anderson and T. J. Boyd, “Electrostatic Precipitation Test Program at TVA’s 20 MW FBC Pilot Plant,” Proceedings of the 9th International Conference on CFB Combustion, 1987.
- E. P. Columbus, “Series Cyclone Arrangements to Reduce Gin Emissions,” Transactions of ASAE, Vol. 36, No. 2, 1993, pp. 545-550.
- J. D. McKenna and J. H. Turner, “Fabric Filter-Baghouses I, Theory, Design, and Selection, Roanoke,” ETS, VA, 1989.
- S. A. Fraser, S. Maartmann, E. Pollock and V. Razbin, “Evaluation of Electrostatic Precipitators versus Baghouses for a 150 MWe Utility CFB Boiler,” Proceedings of the 10th International Conference on CFB Combustion, 1989.
- G. P. Greiner, “Fabric Filter-Baghouses II—Operation, Maintenance, and Trouble Shooting (A User’s Manual),” Valley Printers, Salem, 1993.
- Y. Chang and M. Chen, “Industrial Waste to Energy by CFB Combustion,” Resources, Conservation and Recycling, Vol. 9, 1993, pp. 281-294.
- S. Calvert, “Engineering Design of Fine Particle Scrubbers,” Journal of the Air Pollution Control Association, Vol. 24, No. 10, 1974, pp. 929-934. doi:10.1080/00022470.1974.10469990
- S. Calvert, “Particle Control by Scrubbing,” In: S. Calvert and H. M. Englund, Eds., Handbook of Air Pollution Technology, Willey, New York, 1984.
- S. Calvert, “Scrubbing,” In: A. C. Stern, Ed., Air Pollution, Vol. IV, Academic Press, New York, 1977.
- S. Calvert, J. Goldschmid, D. Leith and D. Mehat, “Wet Scubber System Study,” In: Scrubber Handbook, Vol. 1, US Department of Commerce, NTIS, PB-213016, 1972.
- M. M. Said and S. V. Manyele, “Hydrodynamics of the Multistage Wet Scrubber Coupled to a CFB Incinerator,” African Journal of Environmental Science and Technology (AJEST), 2010.
- A. J. Bourncore and W. T. Davis, “Air Pollution Engineering Manual,” Van Nostrand Reinhold, New York, 1992.