Journal of Information Security
Vol.4 No.4(2013), Article ID:36623,4 pages DOI:10.4236/jis.2013.44021
2D Conjugate Maps of DNA Sequences
School of Software, Yunnan University, Kunming
Email: bqxian@126.com, conjugatesys@gmail.com
Copyright © 2013 Qinxian Bu, Jeffrey Z. J. Zheng. This is an open access article distributed under the Creative Commons Attribution License, which permits unrestricted use, distribution, and reproduction in any medium, provided the original work is properly cited.
Received June 22, 2013; revised July 24, 2013; accepted August 1, 2013
Keywords: Random Sequences; DNA Sequences; Conjugate Maps; Visualization
ABSTRACT
Random sequences play an important role in wider security applications, such as mobile communication and network security. Due to DNA sequences owning natural randomness, in order to show DNA’s characteristics intuitively, this paper proposes a method to present DNA sequences as conjugate maps. The method includes two core models: measuring models to transfer DNA data into measurements, and visual models to test random sequences as distribution maps to show DNA’s characteristics. The spatial relations between sample DNA and CA random sequences are illustrated and compared in the end. The results show that the distribution of DNA sequences and CA random sequences has significant differences and similarities. It can provide a reference for in-depth visualization study of DNA sequences on their measurement maps.
1. Introduction
Random sequences create unpredictable numeric strings in understanding [1]. They are widely used in wider fields, such as mobile communications [2], cryptosystem security [3] and environment simulation [4]. Modern DNA study shows some interesting facts. The separation of alleles on homologous chromosome and independent assortment of non-allelic genes on non-homologous chromosome do not interfere with each other. They are distributed into gamete independently, which bring about relevant randomness of line arrangement.
DNA sequences are the genetic information carrier of organism, which can be considered as a string consisting of A, T, C and G. Since DNA sequences are composed of a large number of units, it is difficult for researchers to seek information from sequences directly. Thus, people analyze DNA sequences using some assistant tools [5]. This paper applies the conjugate maps on DNA sequences borrowing the model of testing random number sequences from cipher technology to organize DNA sequences’ information visually. This approach provides a visually useful way to study the randomness of DNA sequences and analyze their spatial distribution properties [6].
2. Description of Methods
It is useful to manipulate random sequences using a concurrent map model. The model separates a whole sequence into multiple segments to apply different measures on each segment into a set of concurrent measurements. There are two core parts in the method: measuring module and map module. The process flow of mapping DNA sequences is shown in Figure 1.
Measuring module uses DNA sequences as input data, and then uses the calculation methods designed by measuring module to obtain measurements.
Map module use measurements which come from the output of measuring module as input data, and apply the visualization methods of mapping module to obtain kinds of maps for further analysis.
2.1. Measuring Module
In this module, the probability statistics method is used

Figure 1. The flow diagram of mapping DNA sequences.
to transfer DNA data into measurements.
Input: DNA sequence with a length of N, which is divided into M segments. Each segment has m units as a group.
Output: A set of M groups of measurements.
Processing: Select each m nucleotides as a group. Count the percentage of A, T, C and G in the group respectively until the partition of the whole DNA sequences are complete. Using four percentages as measurements for the group, a set of M groups of measurements are generated. The measuring parameters are shown in Table 1.
In this method, I Î{1,2,…M}, and the identifier P represents the final measurements. The method of 2D conjugate need select 2 measurements from above list. There are four types of measurement bases. Their combination has six modes. Samples in this paper use the measurements of A% and G% to generate maps. The probability measurements used in this paper are shown in Table 2.
Using selected measuring data, measuring module has been created. Relevant maps will be produced using the data recursively.
2.2. Map Module
Using concurrent measurements to generate maps, the method chooses two measurements from four parameters. We call this special map as conjugate map that produces 2D distributions in the module. The values of two selected measurements determine position of each pair. This special map contains more information than traditional ways of time sequence diagrams and Poincare maps [7].
After measuring module, measurement sequences are generated and the conjugate maps are created by following procedure.
Input: Two measurements selected from Table 2.
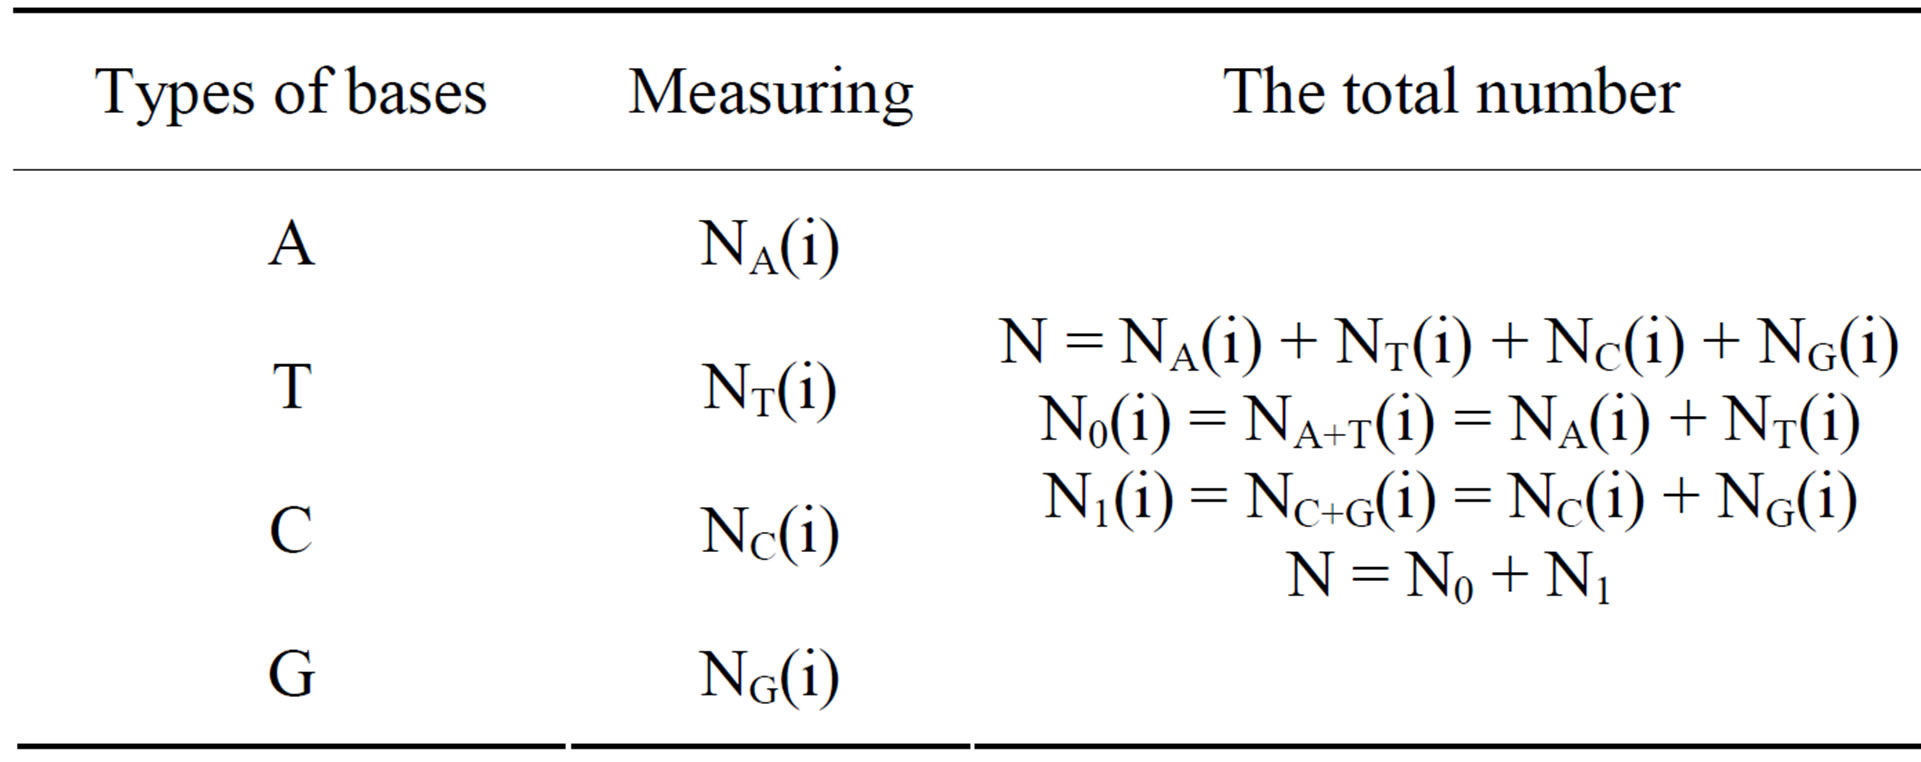
Table 1. Measuring parameters.
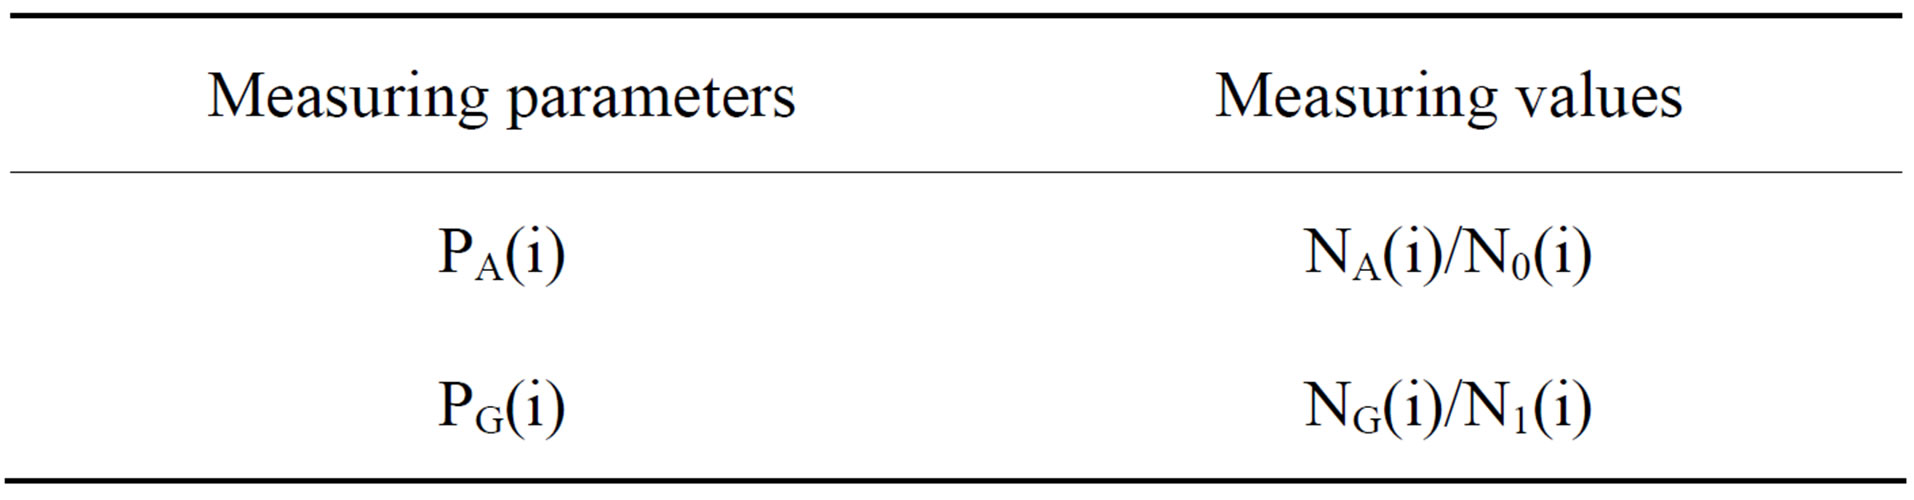
Table 2. Probability measurements.
Output: corresponding graphic maps.
Processing: Two measurements of each segment correspond to a point. Collecting all segments, one map distribution is generated. Under this construction, Conjugate maps are generated based on the two selected measurements.
Through complete work of map module, these visual results illustrate the spatial distribution information of DNA sequences directly to show the characteristics of DNA sequences using 2D map technology.
3. Results
Sample DNA sequences come from the database of GenBank [8]. The first is the complete sequence of DNA around the rice Adh1-adh2 region [9]. The second and the third are different active DNA transposable element families from maize [10]. The information of DNA sequences are shown in Table 3.
The random sequences used as a comparison are produced by one dimensional form of CA with three variables using three types of function. The functions are NO. 36, NO. 55, and NO. 210 respectively.
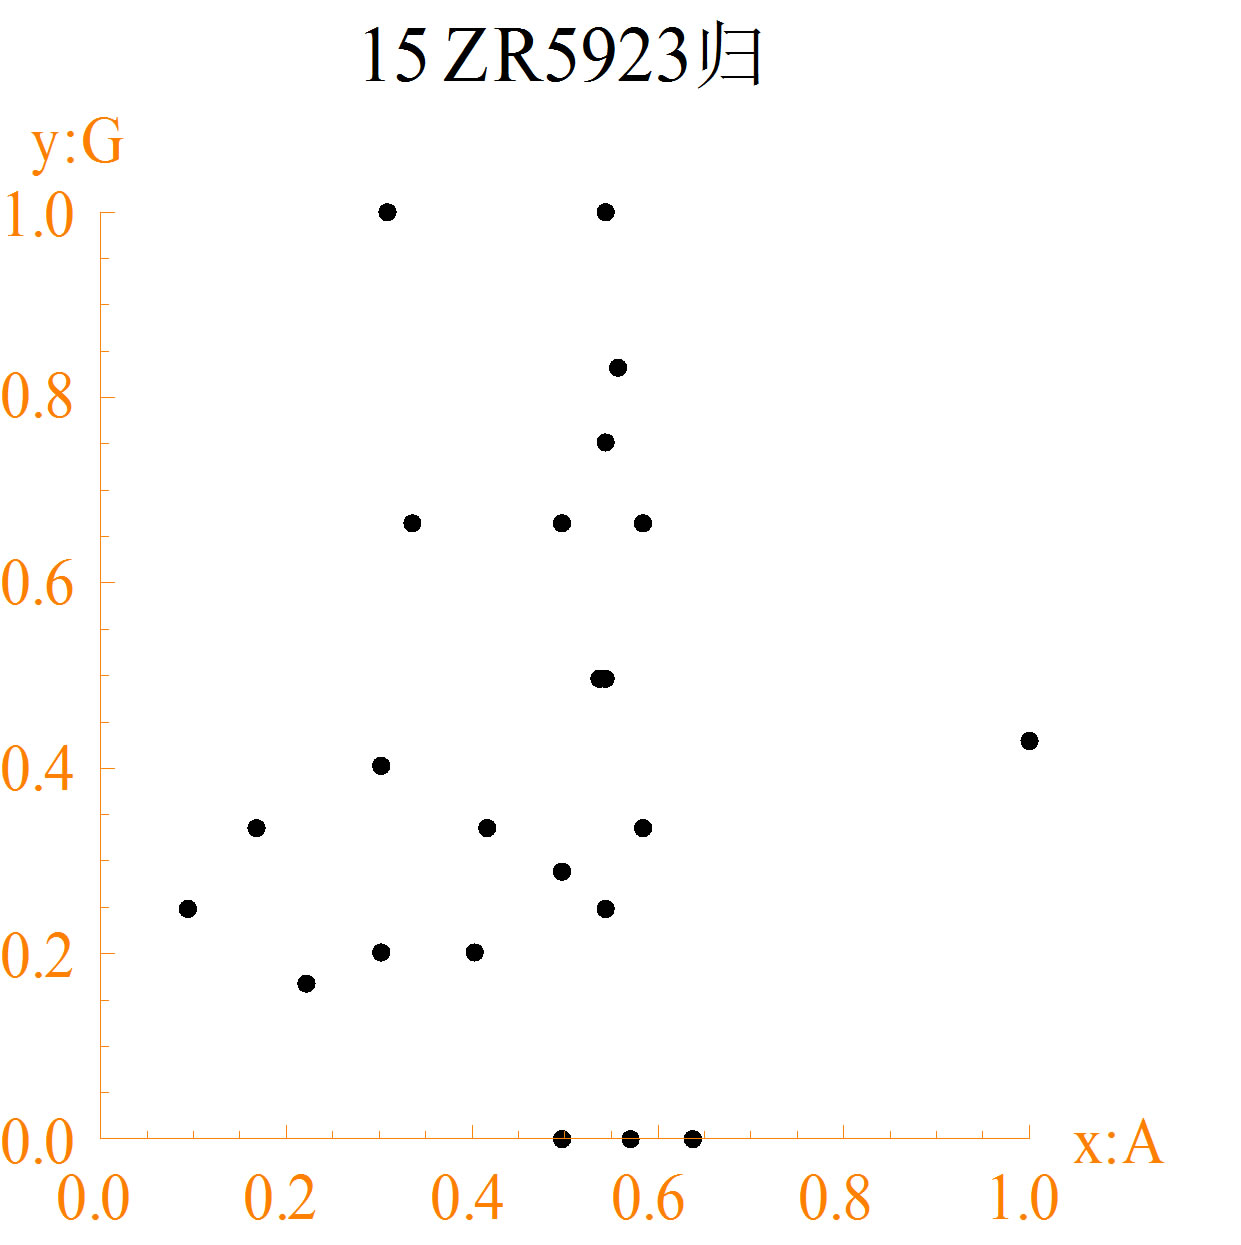
The diagrams of different DNA sequences and random sequences are shown in Figure 2. The character “15” of map title in each DNA sequence diagram represents the number of bases of each group, and the Chinese character represents the normalized method to calculate the measuring values.
4. Analysis and Discussions
From Figure 2, results are shown as followings.
1) In diagrams (a1) to (a3), maps of different DNA sequences are different. Some points formed spatial arrangements are immobility. The distance is equal between points. These results represent some structure information. Further spatial relationship needs to be analyzed by different cases.
2) In the diagrams of (b1)-(b3), the point spatial distribution of CA random sequences is different from (a1)- (a3). Different CA functions own their characteristics of random distributions.
3) DNA sequences are random naturally, but it is different from 0 - 1 random number sequences. Compared with DNA sequences and CA random sequences, spatial
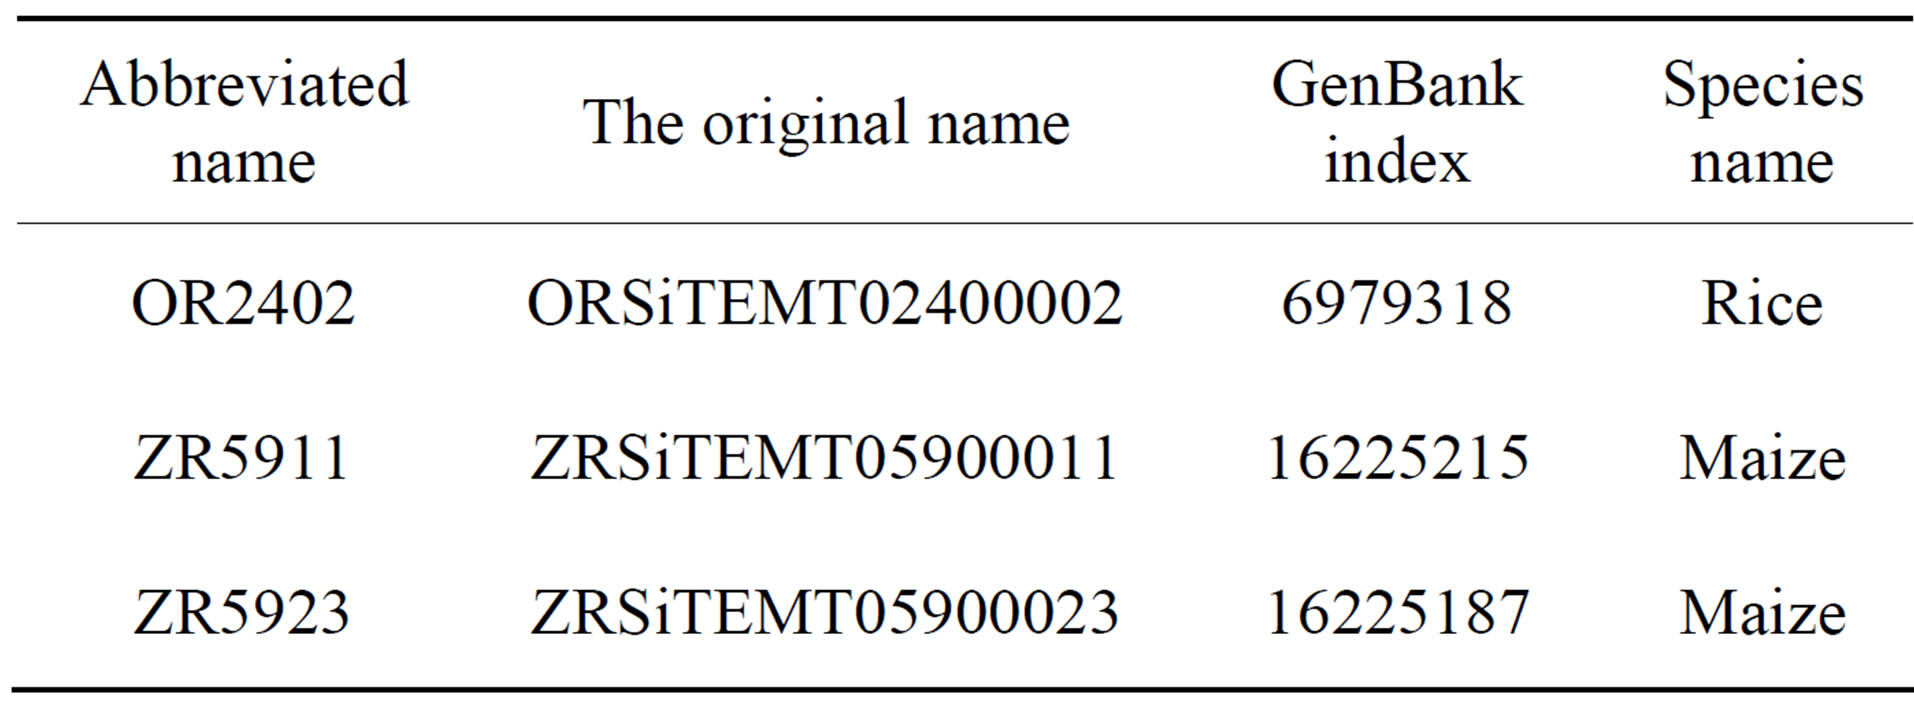
Table 3. The information of DNA sequences.
 (a1)
(a1) 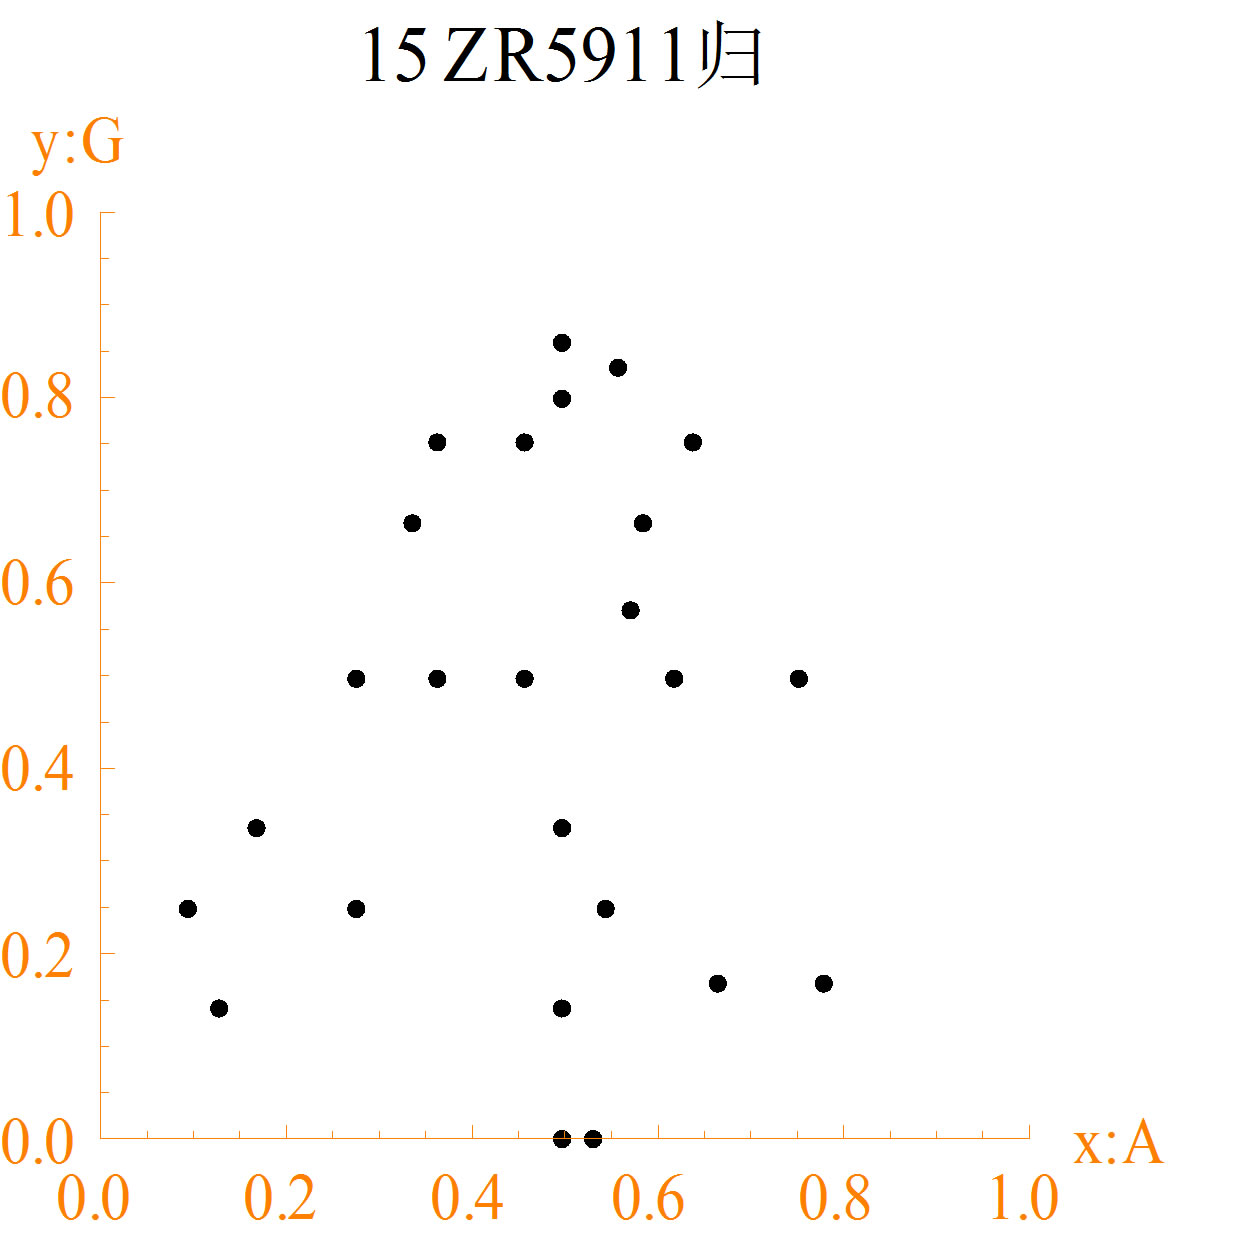 (a2)
(a2) 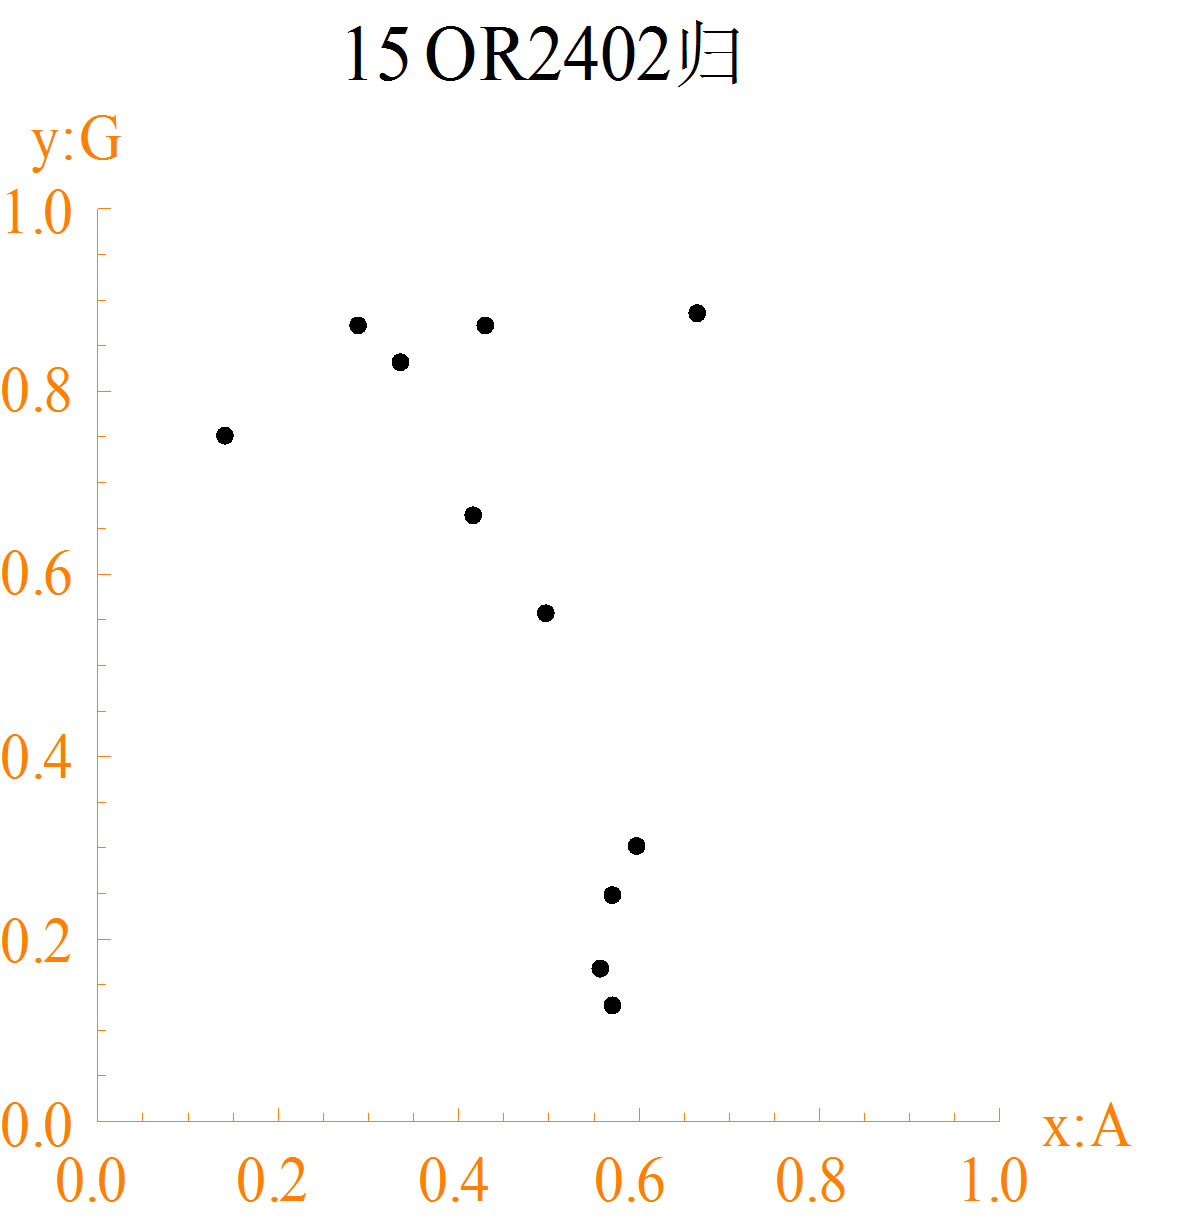 (a3)
(a3) 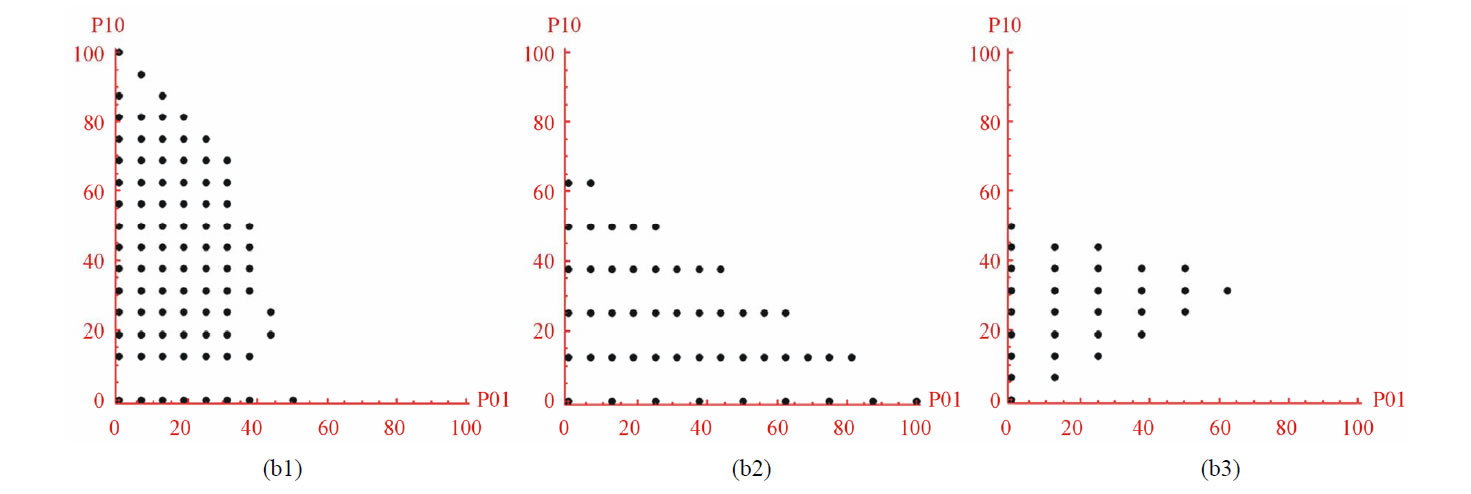
Figure 2. The spatial distribution diagrams of DNA sequences (a1-a3) and CA random sequences (b1-b3): (a1) DNA1; (a2) DNA2; (a3) DNA3; (b1) NO. 36 function; (b2) NO. 55 function; (b3) NO. 210 function.
distributions of random sequences are more regular than DNA sequences. Random sequences are almost in traingles. More missing points of DNA sequences are in maps than random sequences.
5. Conclusion
The analysis of DNA sequences is the most important part in modern molecular biology. Conjugate maps can help us to identify significant characteristics of DNA sequences directly. Since the distribution of different DNA sequences is different, the maps can be used as the basis to compare differences of two DNA sequences. The method is easy to understand and study, thus, one of the most important points of the work mentioned in paper is to analyze the differences among DNA sequences directly. This new map provides more spatial information of DNA sequences for future exploration. The method can be an assisted mean to extend CA random sequences’ visualization study.
6. Acknowledgements
Thanks to Mr. Yao Zhou for providing data, to Mr. Jie Wan for help with the English edition.
Thanks to the Key Laboratory of Yunnan Software Engineering for financial supports to the information security research projects (2010EI02, 2010KS06) and subCDIO projects.
REFERENCES
- F. Liang and X. L. Zhang, “Using the Method of Random Test to Classify and Evaluate the Characteristics of Distribution Icons,” Proceedings of Asia-Pacific Youth Conference on Communication (APYCC) (ISTP), 2010.
- S. L. Chen, W. Q. Yang and Q. R. Dong, “The Application and Simulation of M-Sequences Used in the Scrambling Code of Mobile Communications,” Modern Electronic Technology, No. 3, 2002, pp. 27-29.
- B. Schneier, “Secrets & Lies: Digital Security in Networked World,” John Wiley & Sons, Hoboken, 2000, pp. 85-101.
- R. Yang, “Research and Application of Pseudo-Random Sequence,” Journal of Shenyang Institute of Engineering, Vol. 5, No. 2, 2009, pp. 166-168.
- L. Shi, “On 2D Graphical Representation of DNA Sequences,” Science & Technology Information, No. 1, 2009, pp. 480-483.
- Jeffrey Z.-J. Zheng and Y. Zhou, “Variant Measure Visualization Model Using Cyclic Distributions of Complex 0-1 Sequences,” Proceedings of Asia-Pacific Youth Conference on Communication (APYCC) (ISTP), 2010.
- Z.-J. Jeffrey and Q. P. Li, “Testing the Characteristics of Spatial Distribution of Time Sequences Using Two-Dimensional Graphics,” Proceedings of Asia-Pacific Youth Conference on Communication (APYCC) (ISTP), 2010.
- http://www.ncbi.nlm.nih.gov
- R. Tarchini, P. Biddle, R. Wineland, S. Tingey and A. Rafalski, “The Complete Sequence of 340 kb of DNA around the Rice Adh1-adh2 Region Reveals Interrupted Colinearity with Maize Chromosome 4,” Plant Cell, Vol. 12, No. 3, 2000, pp. 381-391.
- X. Zhang, C. Feschotte, Q. Zhang, N. Jiang, W. B. Eggleston and S. R. P. Wessler, “Instability Factor: An Active Maize Transposon System Associated with the Amplification of Tourist-Like MITEs and A New Super Family of Transposases,” Proceedings of the National Academy of Sciences of the United States of America, Vol. 98, No. 22, 2011, pp. 12572-12577. http://dx.doi.org/10.1073/pnas.211442198