Journal of Signal and Information Processing
Vol. 4 No. 1 (2013) , Article ID: 28264 , 9 pages DOI:10.4236/jsip.2013.41001
Emergency Gesture Communication by Patients, Elderly and Differently Abled with Care Takers Using Wearable Data Gloves
![]()
1School of Computing Science and Engineering, Vellore Institute of Technology University, Vellore, India; 2Department of Information Technology, Mahendra Engineering College, Namakkal, India.
Email: kalvina.r2011@vit.ac.in, andrewsmalacca@gmail.com, maheswari.n@vit.ac.in
Received November 5th, 2012; revised December 14th, 2012; accepted December 23rd, 2012
Keywords: Wearable Computing; Bio-Signal Processing; Robotic Interface; Affective-Gesture Computing
ABSTRACT
The Healthcare monitoring on a clinical base involves many implicit communication between the patient and the care takers. Any misinterpretation leads to adverse effects. A simple wearable system can precisely interpret the implicit communication to the care takers or to an automated support device. Simple and obvious hand movements can be used for the above purpose. The proposed system suggests a novel methodology simpler than the existing sign language interpretations for such implicit communication. The experimental results show a well-distinguished realization of different hand movement activities using a wearable sensor medium and the interpretation results always show significant thresholds.
1. Introduction
The demand for care takers for elderly and the disabled has increased in great ratio. At the same time the population of the elderly in hospitals and care homes has also started increasing. The high cost involved in this expertise makes it always an unachievable target for the healthcare organizations. To overcome these issues of care givers, the automated care taking and/or a robotic assistance would be the precise and appropriate solution. Hence in the proposed system, an electrodes-embedded wearable data glove is used to capture the hand movements of a subject. The aim of this proposal is to enhance the utility of precise communication to the care taker, including passing information to automated care taking system or a robotic assistance in modern healthcare, by reading the gesture signals made by the patients or elderly as symbolic.
The usage of such digital conversions from the hand movements can go beyond human comprehension and mere communication interfaces. The proposed system consists of a small electrode sensor glove which captures the dimensions of the fingers and their movements. This system can overcome the limitations of human’s aid due to tiredness and lack of timely service. This can also break the barrier of the elderly and disabled towards operating the robotic system for assistance. The glove is worn to the right hand of the subjects and the data are transmitted through the wireless transmission.
2. Methodology
2.1. Data Gloves and Experiments
Data glove, a device similar to the conventional glove worn on hands, facilitates in sensing and fine-motion control in robotics. The typical data glove along with its electrode positions is shown in Figure 1. It is a new dimension in the field of medicine and healthcare [1]. Most input devices offer limited degrees of freedom; whereas the data glove is unique in that by offering multiple degrees of freedom for each finger and hand as well. This permits the user to communicate to the computer to greater extent than most other input devices.
The 5DT data glove is designed to satisfy the requirements of modern motion capture and animation professsionals. The specifications of the glove are: Material: black stretch lycra; flexure resolution: 12 bit A/D; flexure sensors: fiber optics based 14 sensors in total, 2 sensors per finger, 1 sensor for knuckle, 1 for first joint abduction and sensors between fingers; interface: full speed USB 1.1, RS232 (via optional serial interface kit); software: kaydara MOCAP, Discreet 3D studio Max, Alias Maya, SofImage XSI, SDK and Glove Manager Utility; sampling rate: minimum 75 Hz [2]. The system connec-
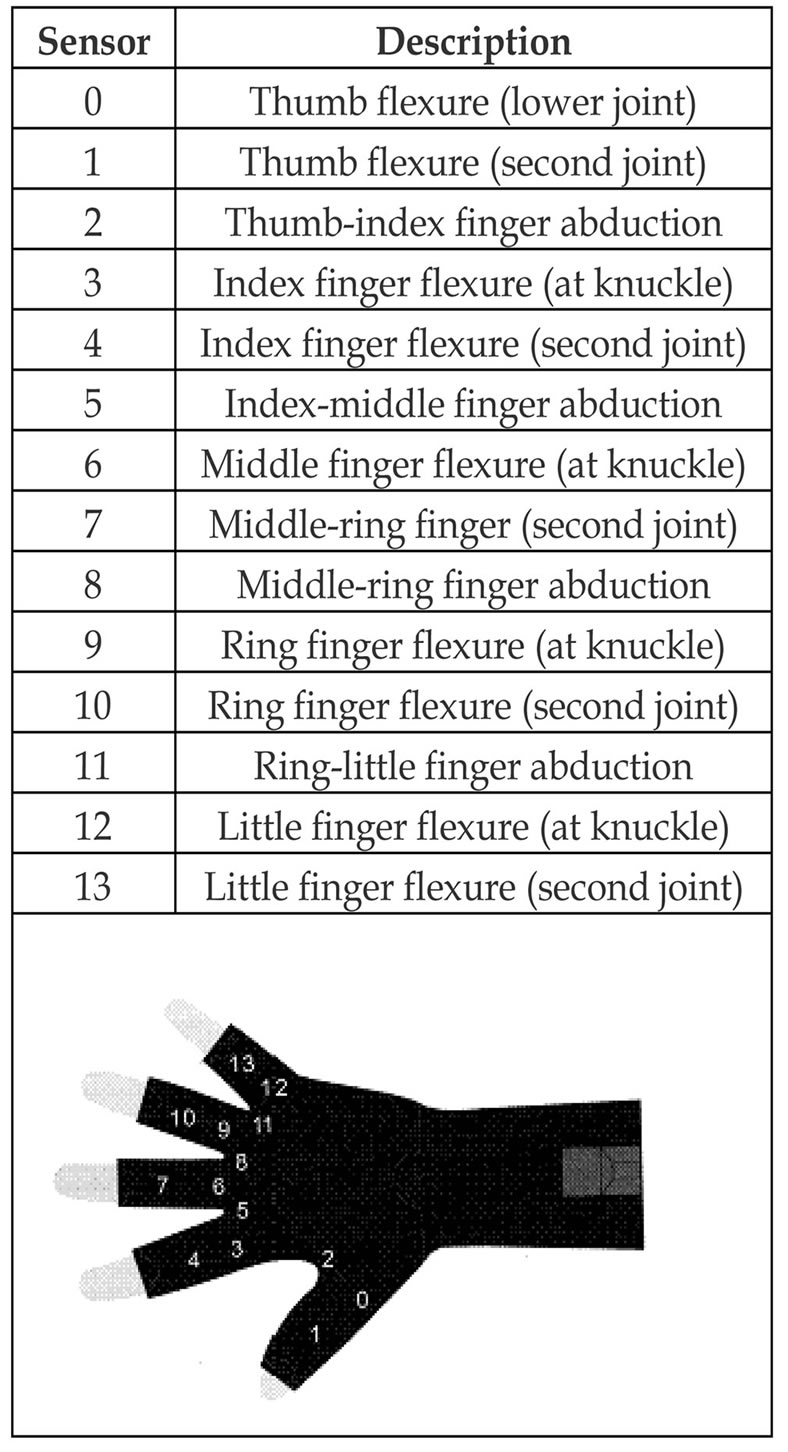
Figure 1. Position of the sensors embedded in hand glove.
tivity specifications of the data glove are shown in Figure 2 The interaction between the human and computer technologies increasingly provides natural ways to operate and communicate with machines. Ranging from speech to vision, all the standalone to wearable interacttion technologies help to change the way how people operate computers. With all these interaction methods, gesture recognition takes an important and unique role in human communication with Machines [3]. A cyber glove is used in such communication systems and the movements of hand are traced by a Flock of Birds 3-D motion tracker to extract the gesture features. The usage of these motion trackers is expensive and ASL should be taught prior to the elderly and the disabled which is difficult [4]. Moreover such functions are difficult during unbearable pain and emergency.
In this research work a sponge, an iron material and a coin-the objects available in conventional daily life environments were used to show the contrast in the texture

Figure 2. A wearable data glove connected to the system.
of the objects that may cause varieties of response while using to produce simple holds using data gloves. Data from five healthy subjects, including two female subjects, have been taken into consideration, whose average age is 19.5 years. The glove is worn in the right hand since it is the dominant hand of all five subjects involved.
In all experimental paradigms, an electrode-embedded wearable data glove is used to capture the hand movements of five subjects. The hand movements are categorized by capturing the signals from the glove while the subjects are allowed to soft hold and hard hold: 1) a soft material (sponge); 2) a hard material (iron) and 3) a coin. Ten samples of each hold were captured under six paradigms as sponge light hold (SL); sponge hard hold (SH); iron material light hold (HL); iron material tight hold (HT); coin light hold (CL); coin tight hold (CT), for all five subjects. The row size of each sample matrix is either 265 or 266, and the column size is 14. In uniform the row size is taken as 265. The feature extraction is done using two methods from all the captured signal samples by Singular Value Decomposition (SVD) and Fractal Dimension (FD). The data signals are voluminous in nature due to the sampling rate and the use of 14- electrode glove; hence to reduce the dimensionality of the data signals while estimating the feature vector, SVD and FD are being used. In both estimation methods the Euclidean Distance is calculated among the set thresholds and features for linear classification of classes. The thresholds were selected based on the experimental simulation trials.
2.2. Singular Value Decomposition (SVD)
A data glove of m (number of electrodes) sensors each generating n number of samples with respect to time is taken into consideration and produces an output matrix Amxn . The matrix A represents the feature contents and the Singular Value Decomposition has been calculated as,
 (1)
(1)
where, U and V are real orthogonal matrices, S is a real pseudo diagonal matrix with non-negative diagonal element [5,6].
It has been found in many signal processing applications and control systems that the Singular Value Decomposition of matrix formed from observed data can be used to improve methods of signal parameter estimation and system identification [7].
2.3. Fractal Dimension (FD)
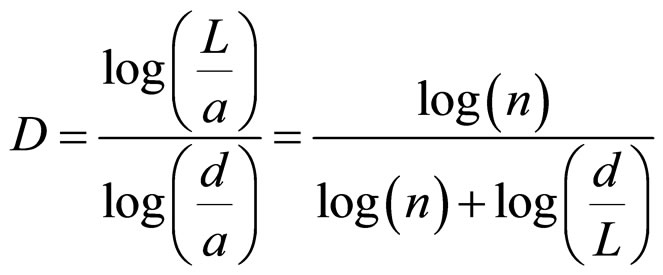
The Fractal Dimension of the sample is done using the Katz’s method of estimating the fractal dimension.
The sum and average of the Euclidean Distance between the successive points of the sample (L-sum of Euclidean Distance between successive points of samples and a-average of Euclidean Distance between successive points of samples) are calculated as well as the maximum distance between the first point and any other point of sample (D) [8]. The fractal dimension of the sample (D) then becomes [9]
 (2)
(2)
where n is L divided by a.
3. Experimental Results
The SVD features were calculated and tabulated using tables from Tables 1-6 for each ten samples of five subjects. In the feature vector, the first “n” (few) values give significant differentiation to various paradigms. So the figures provided here are represented for “n” feature values.
The SVD and FD features of all signal samples of five
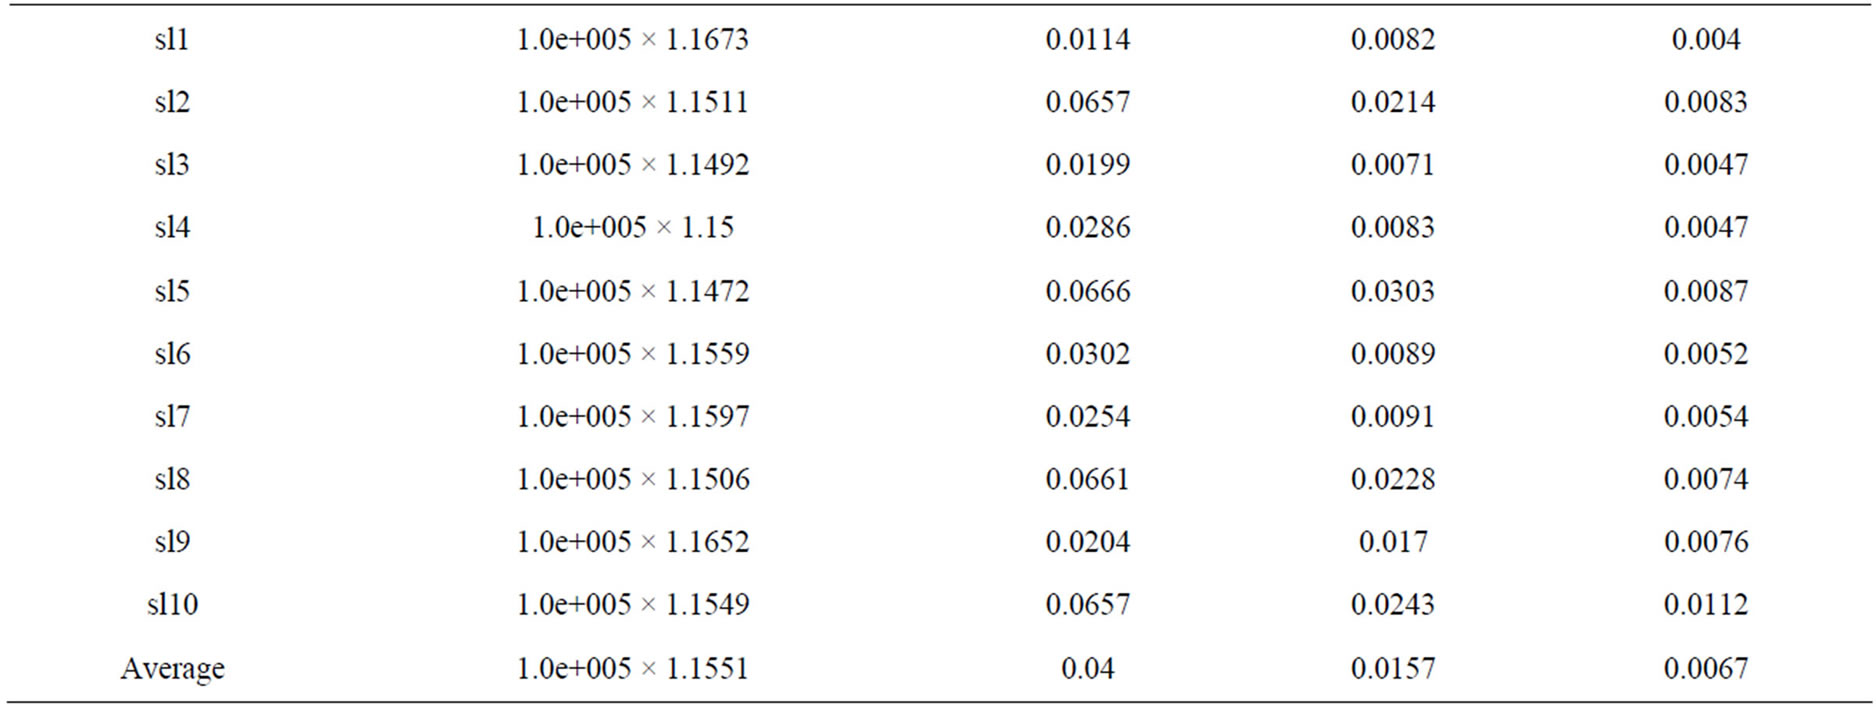
Table 1. SVD values of sponge with light hold (SL) of Sub-3.
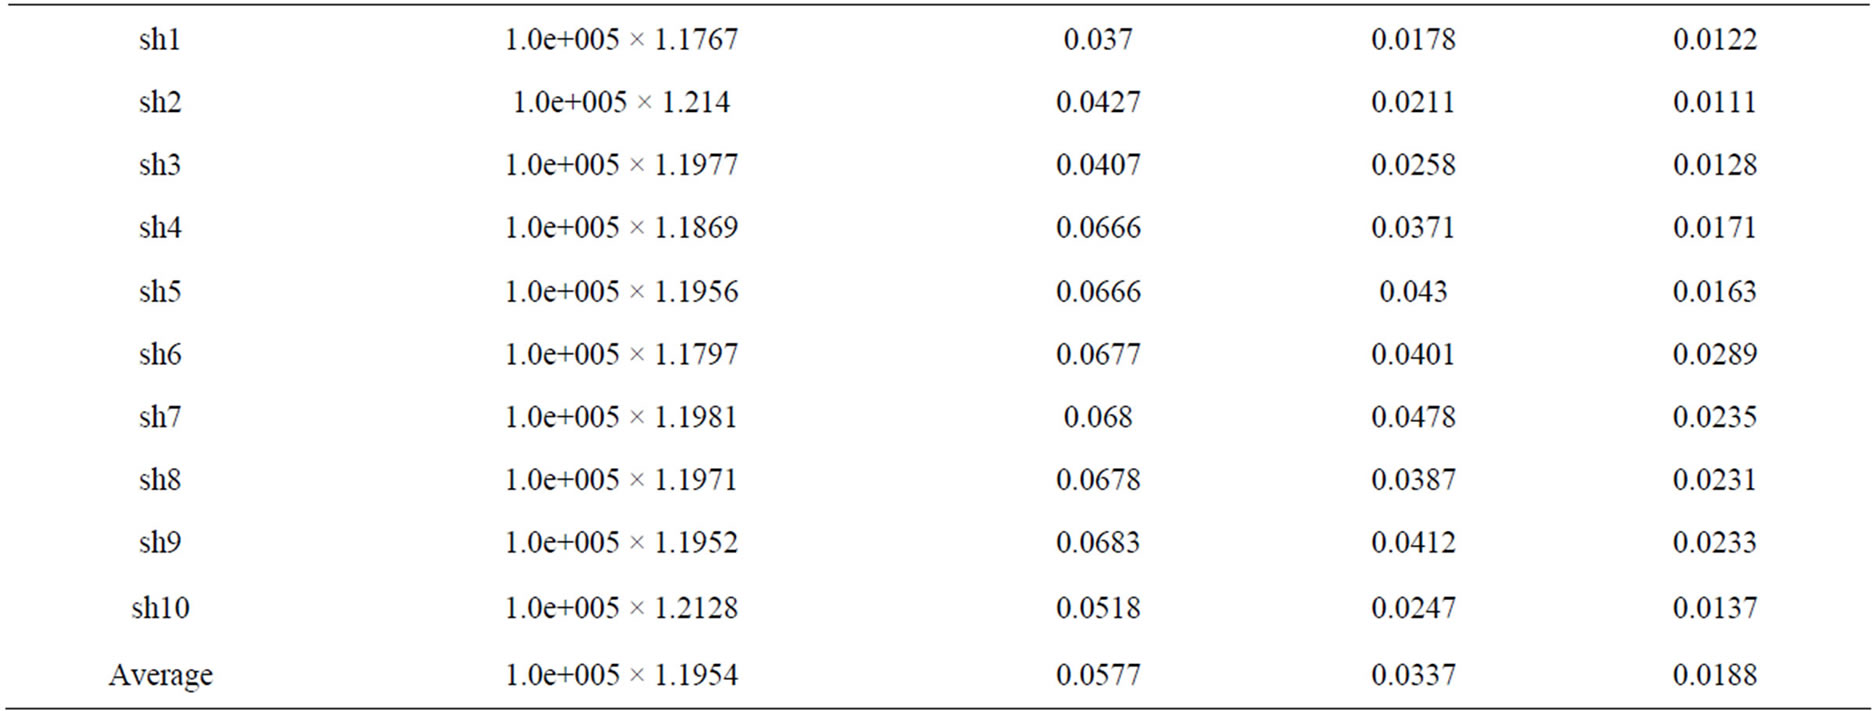
Table 2. SVD values of sponge with hard hold (SL) of Sub-3.
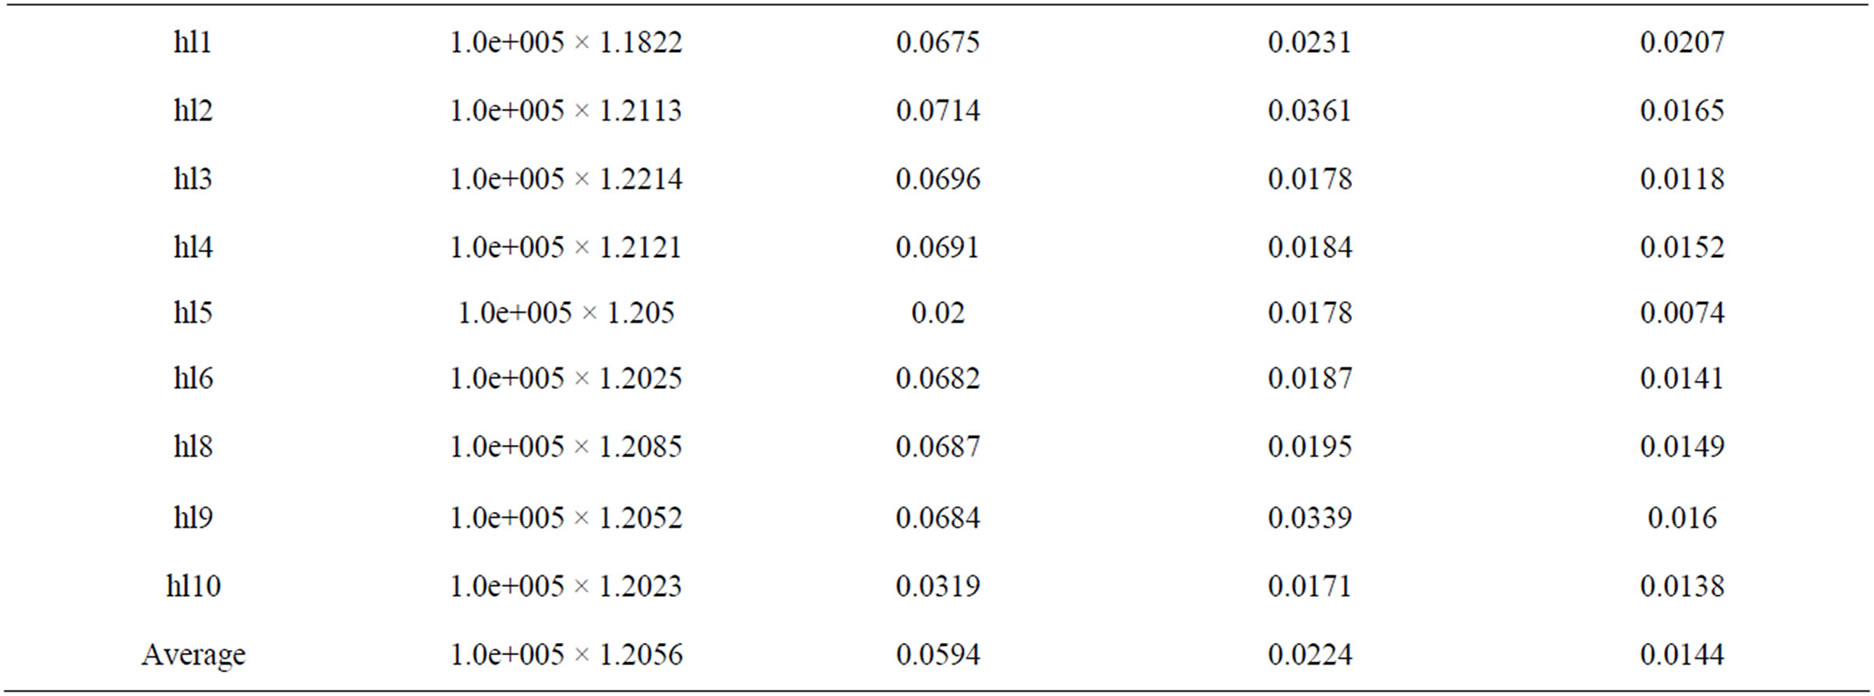
Table 3. SVD values of iron material with light hold (HL) of Sub-3.
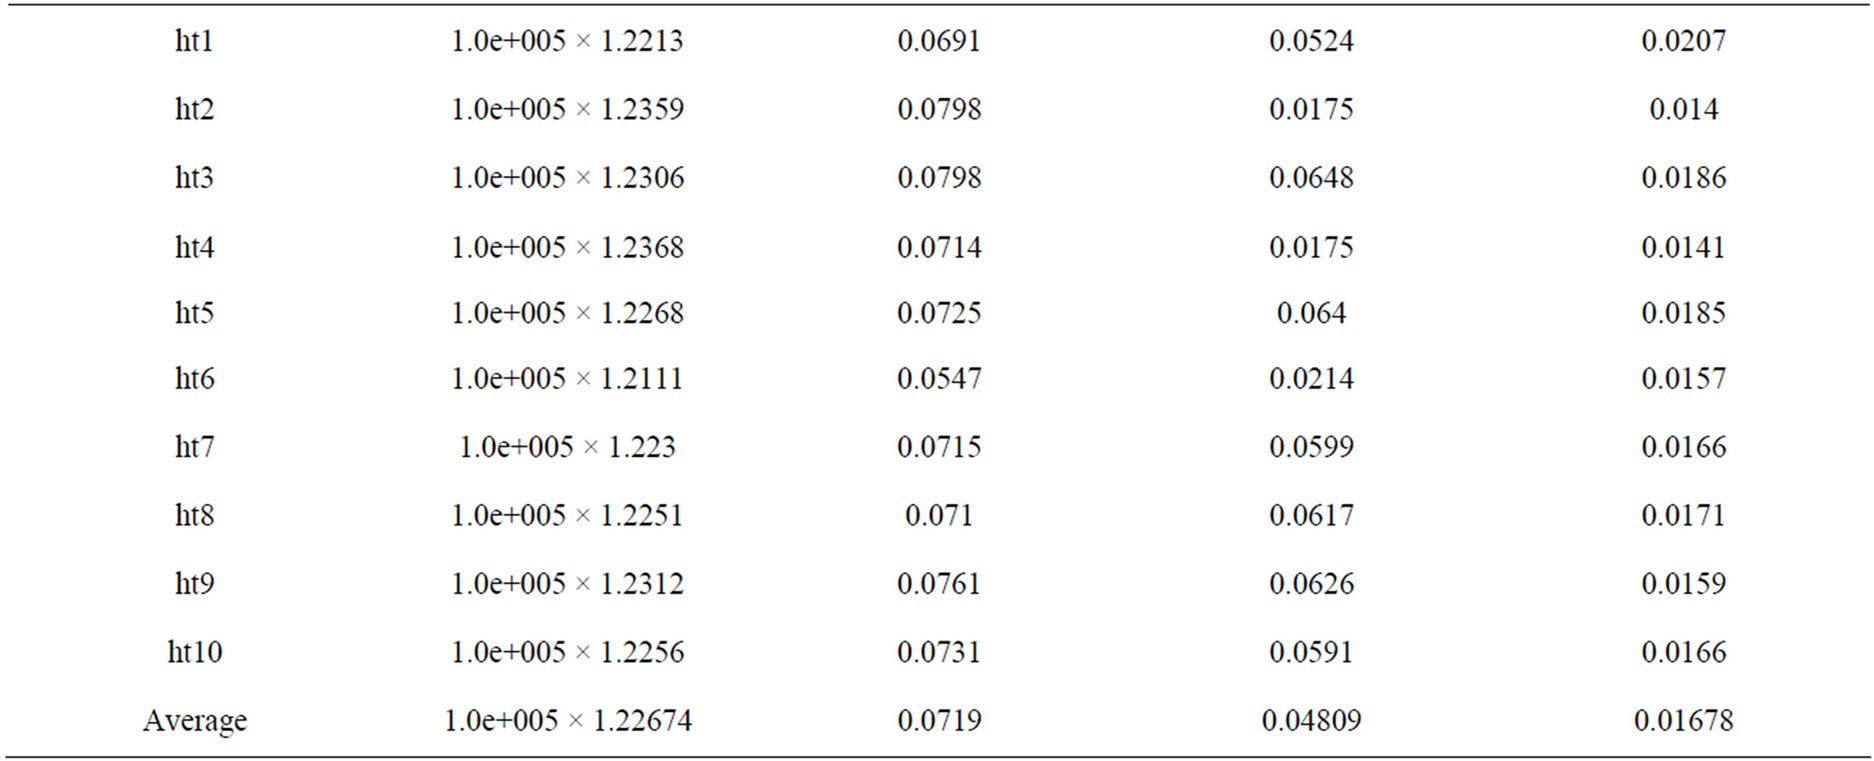
Table 4. SVD values of iron material with hard hold (HT) of Sub-3.
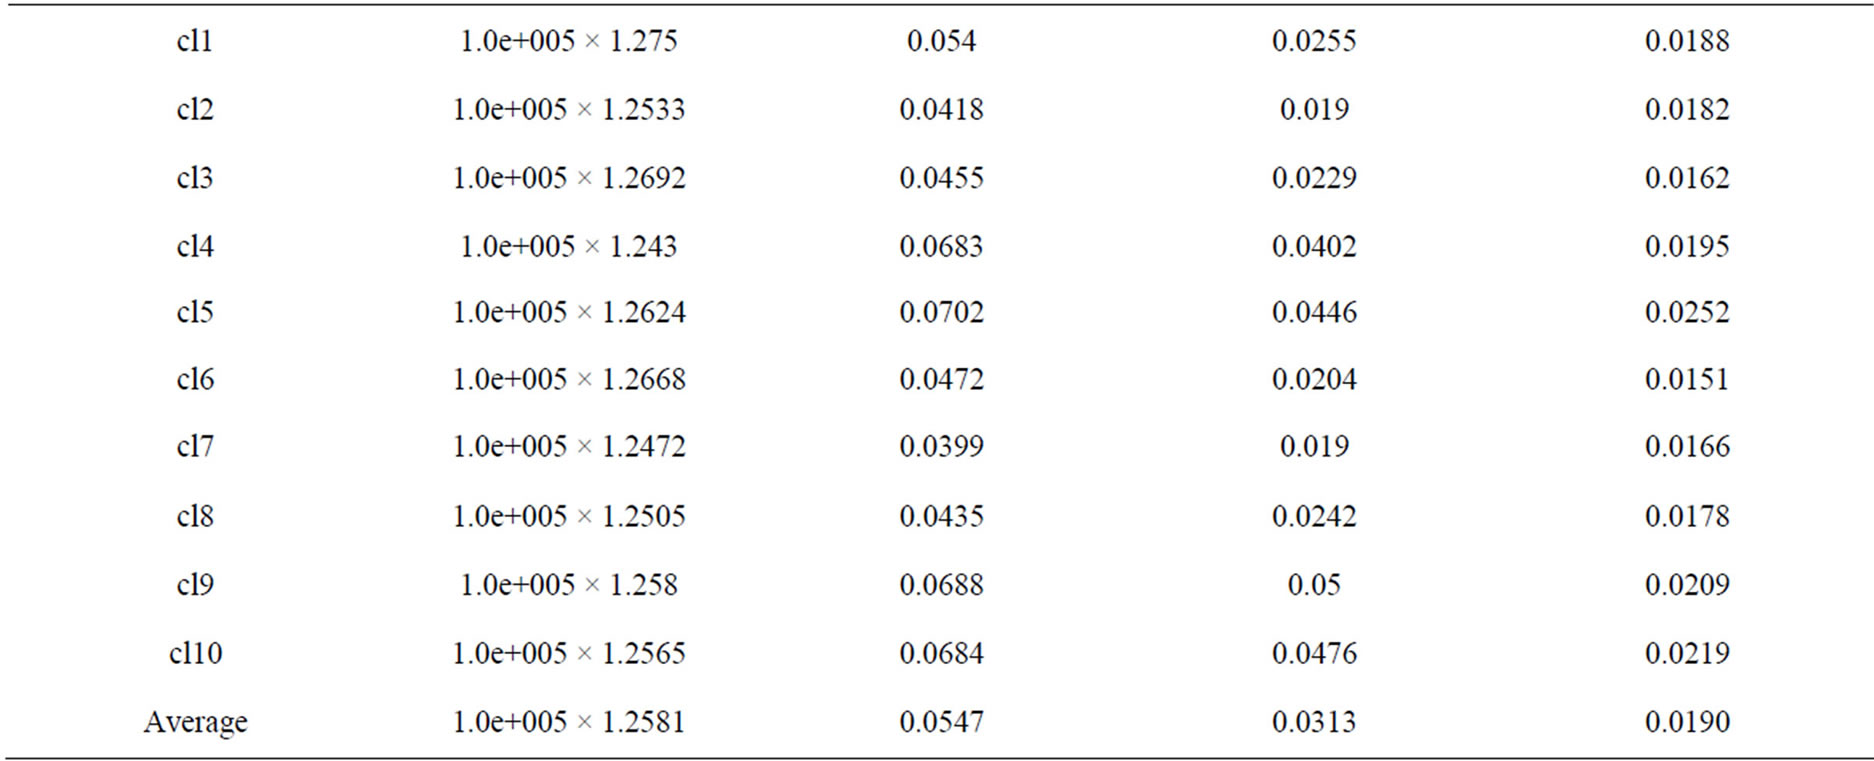
Table 5. SVD values of coin with light hold (CL) of Sub-3.

Table 6. SVD values of coin with tight hold (CT) of Sub-3.
subjects were calculated and the graphs were plotted as the classification by the distance based classification technique using the Euclidean Distance.
The analysis for match or overlap possibilities were ardently observed by comparing the classification distance among various paradigms of intra as well as inter subjects.
Euclidean Distance is used to measure the distance between each set of singular values or FD values. In general, the distance between points x and y in Euclidean space is given as [5,6,10].
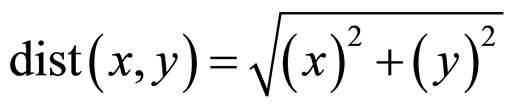 (3)
(3)
Here the points x and y represents the set of SVD values or FD values extracted using the signals during the experimental calculations. Euclidean Distance is calculated for the reference and the other SVD values using the Equation (3).
Figure 3 shows the average Euclidean distance between the SVD features of SH and SL belongs to Subject 3 including all experimental trials.
In Figure 4 the average Euclidean distance between the SVD features of HL and HT belongs to Subjects 3 in all experimental trials is given.
In Figure 5 the average Euclidean distance between the SVD features of CL and CT belongs to Subject 3 in all experimental trials is given.
The fractal dimension is calculated from ten samples of all five subjects. The variation in the fractal dimension of each category is given in bar charts.
The fractal dimension is calculated when fs = 35, for six paradigms as sponge with light hold (SL), hard hold (SH); iron material with light hold (HL), tight hold (HT); coin with light hold (CL), tight hold (CT).
In Figure 6 the difference in average Euclidean dis-
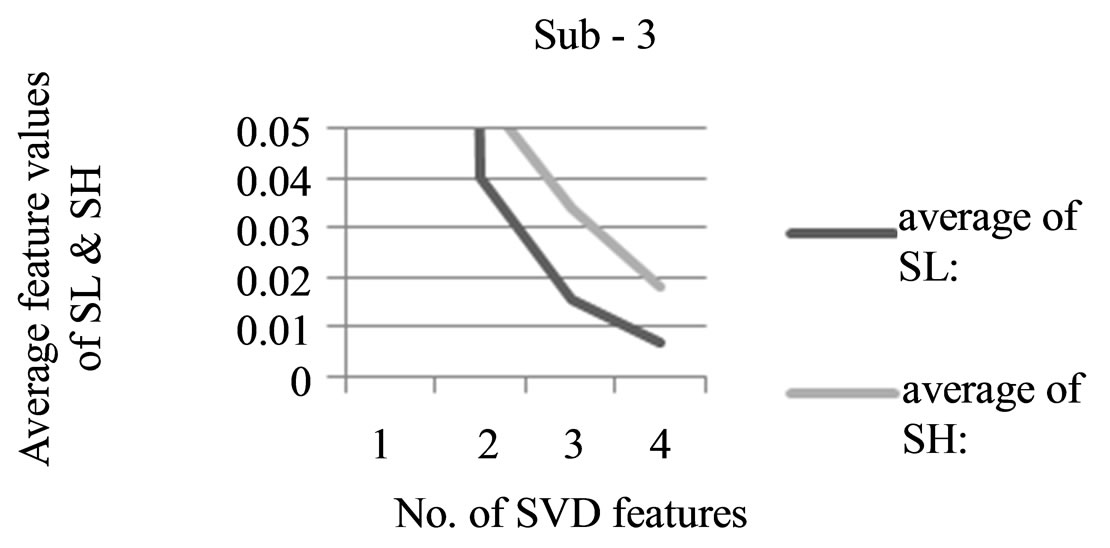
Figure 3. Comparision of average SVD features of SL and SH of Sub-3.
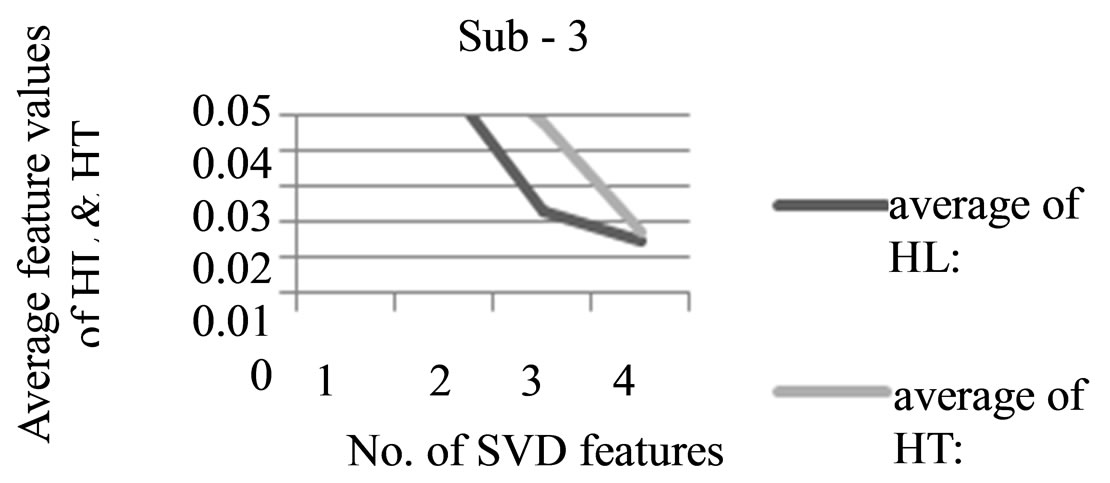
Figure 4. Comparision of average SVD features of HL and HT of Sub-3.
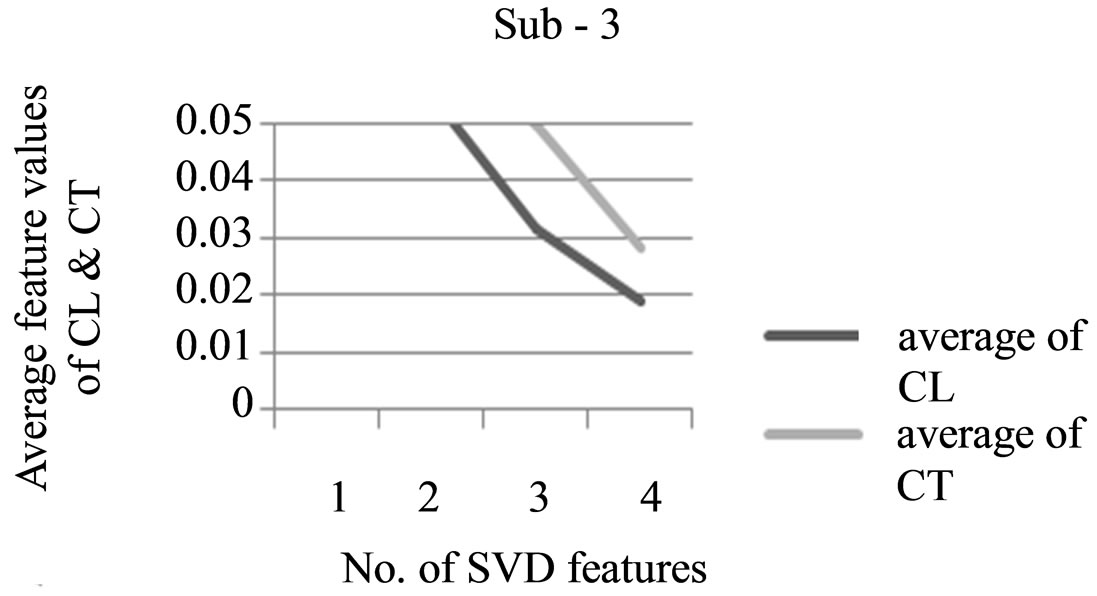
Figure 5. Comparision of average SVD features of CL and CT of Sub-3.
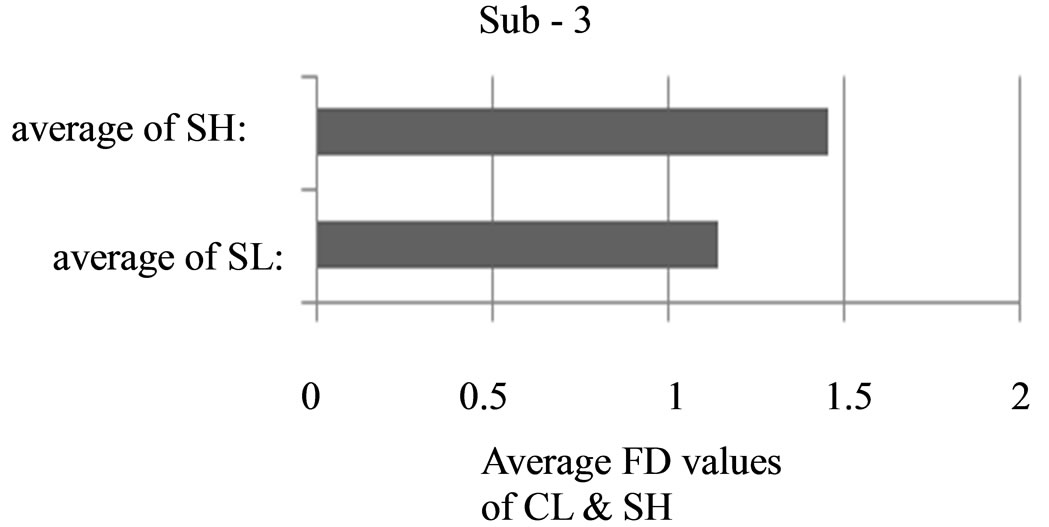
Figure 6. Comparision of average FD features of SL and SH of Sub-3.
tance between the FD features of SL and SH belongs to Subject 3 in all experimental trials is given.
In Figure 6 the difference in average Euclidean distance between the FD features of HL and HT belongs to Subject 3 in all experimental trials is given. In Figure 7 the same FD features of HT and HL belong to Subject 3 in all experimental trials is given. In Figure 7 the Euclidean distance of same FD features of CT and CL belong to Subject 3 in all experimental trials is given.
In Figure 8 the difference in average Euclidean distance between the FD features of CL and CT belongs to Subject 3 in all experimental trials is given.
The graph in Figure 9 represents the average Euclidean distance of SVD values of the average SL and SH belongs to all five subjects.
The graph in Figure 10 represents the average Euclidean Distance of SVD values of the average HL and HT belongs to all five subjects.
The graph in Figure 11 represents the average Euclidean distance of SVD values of the average CL and CT belongs to all five subjects.
The average of FD features of each subject is calculated and then the average of all five subjects is taken and graphs are drawn. In Figure 12 the difference in average Euclidean distance between the FD features of SL and SH belongs to all subjects taken from all experimental trials is given.
In Figure 13 the difference in average Euclidean Distance between the FD features of HT and HL belongs to all subjects taken from all experimental trials is given.
In Figure 14 the difference in average Euclidean Distance between the FD features of CT and CL belongs to all subjects taken from all experimental trials is given.
The results are again compared in various cross combinations and selected results are stated from Figure 15 to Figure 16. In Figure 15, the Euclidean Distance between the average SL of subject1 with the average SH of Subject 2 is shown for the identification of difference.
In Figure 17, the Euclidean Distance between the average SL of Subject 2 with the average CT of Subject 3 is shown for the identification of difference.
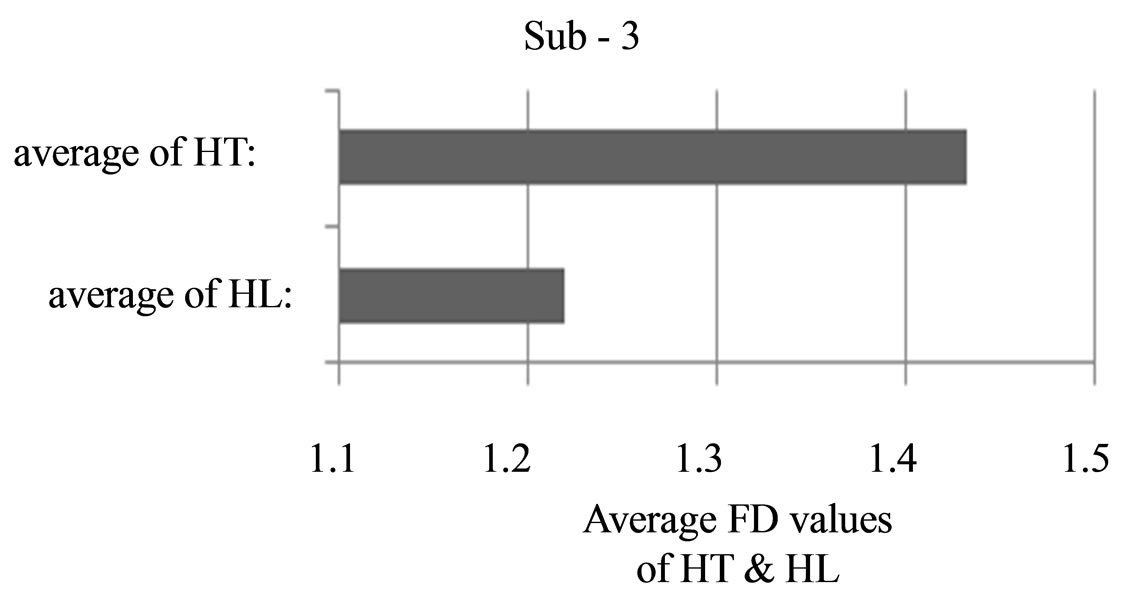
Figure 7. Comparision of average FD features of HL and HT of Sub-3.

Figure 8. Comparision of average FD features of CL and CT of Sub-3.
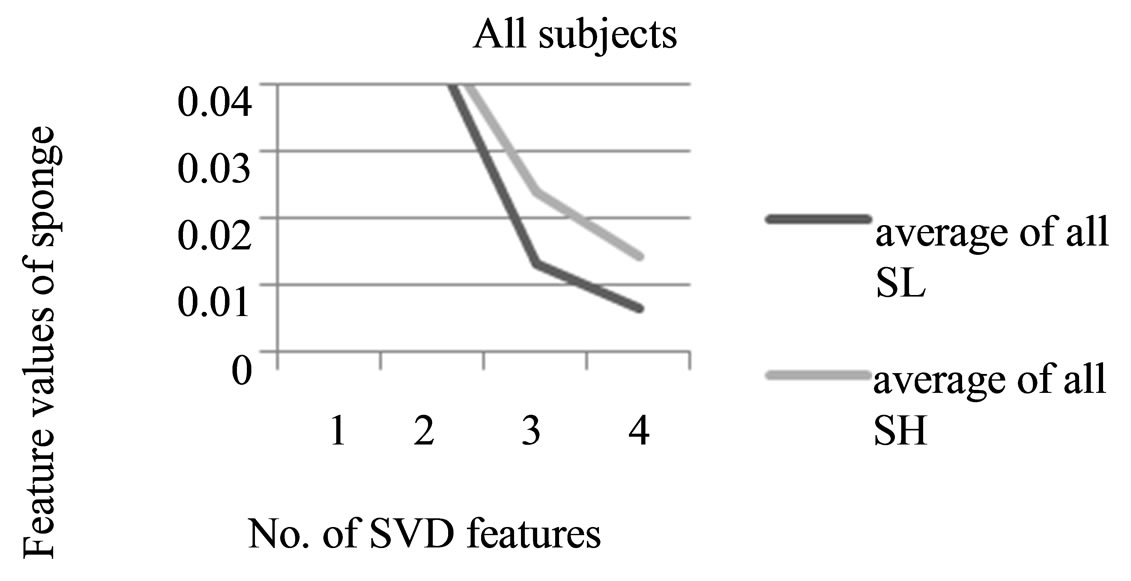
Figure 9. Average of SVD features of sponge of all five subjects.

Figure 10. Average of SVD features of iron material of all five subjects.
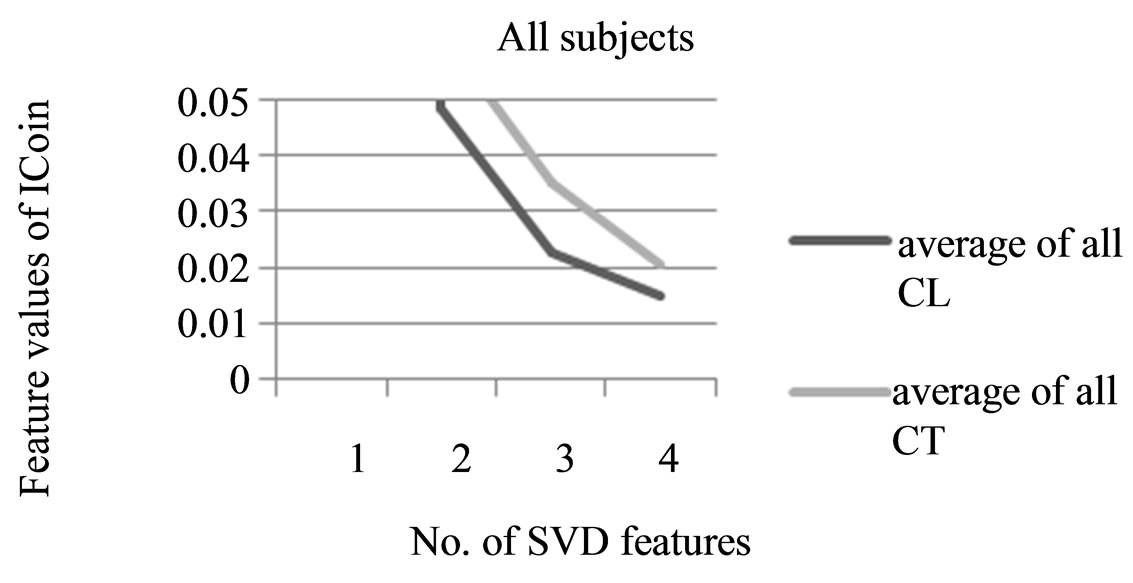
Figure 11. Average of SVD features of coin of all five subjects.

Figure 12. Average of FD features of sponge of all five subjects.
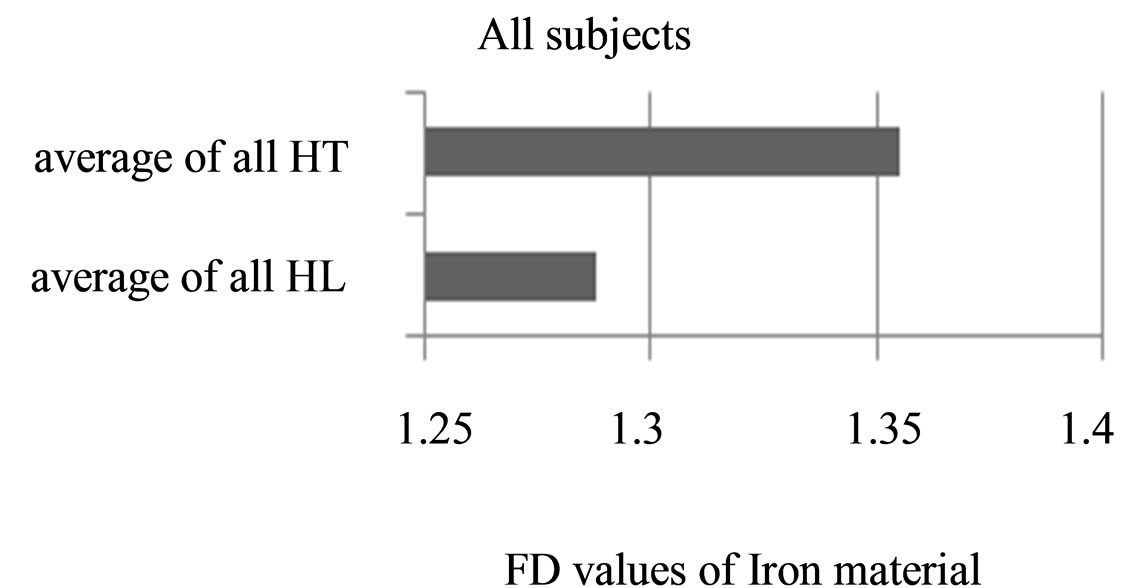
Figure 13. Average of FD features of iron material of all five subjects.
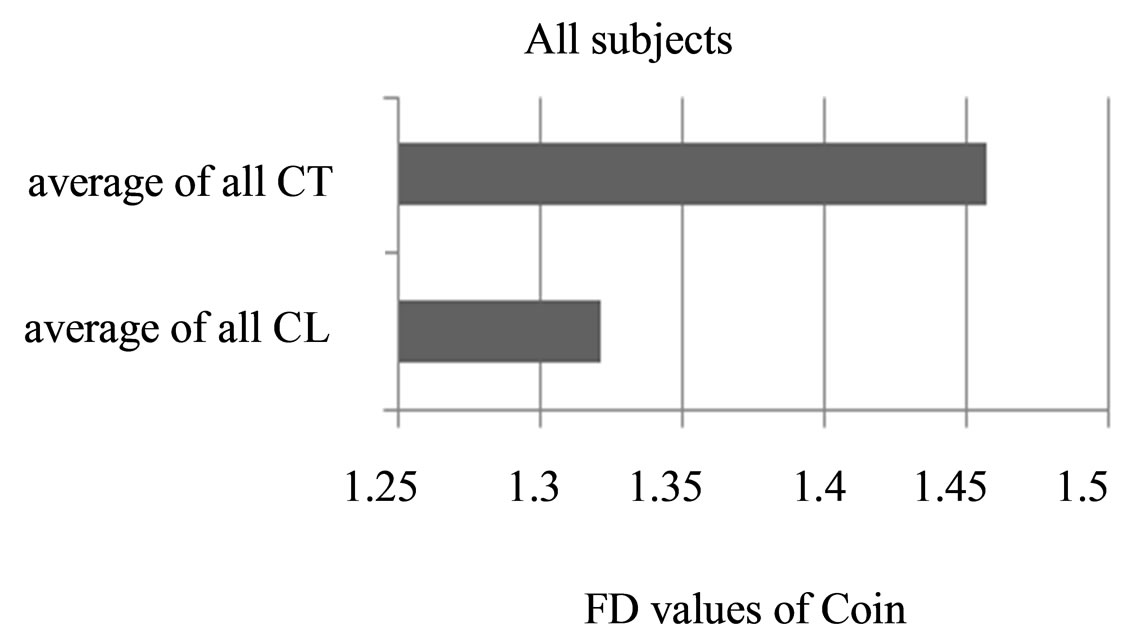
Figure 14. Average of FD features of coin of all five subjects.
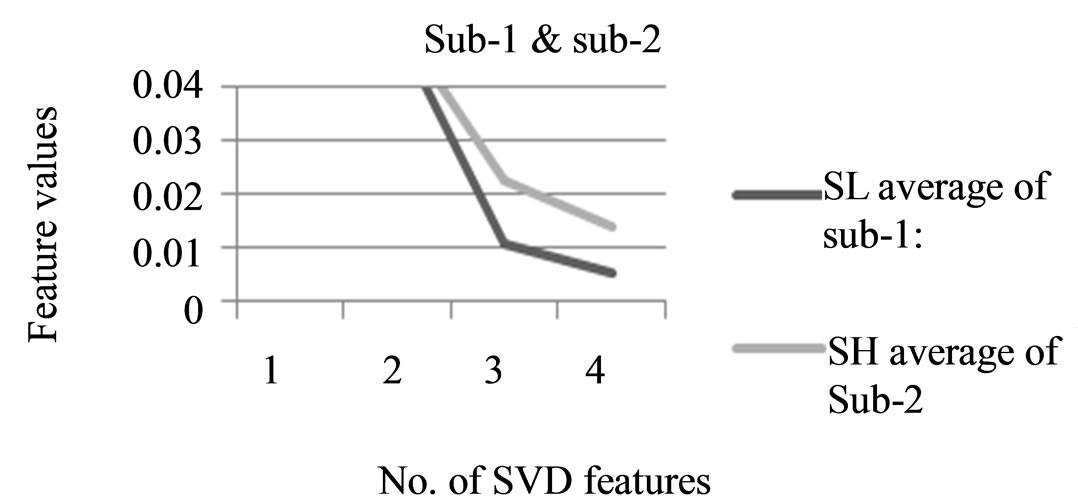
Figure 15. Average of SVD features of sponge Light Hold (SL) & Hard Hold (SH).

Figure 16. Average of SVD features of Coin tight hold (HT) & Sponge Hard hold (CL).
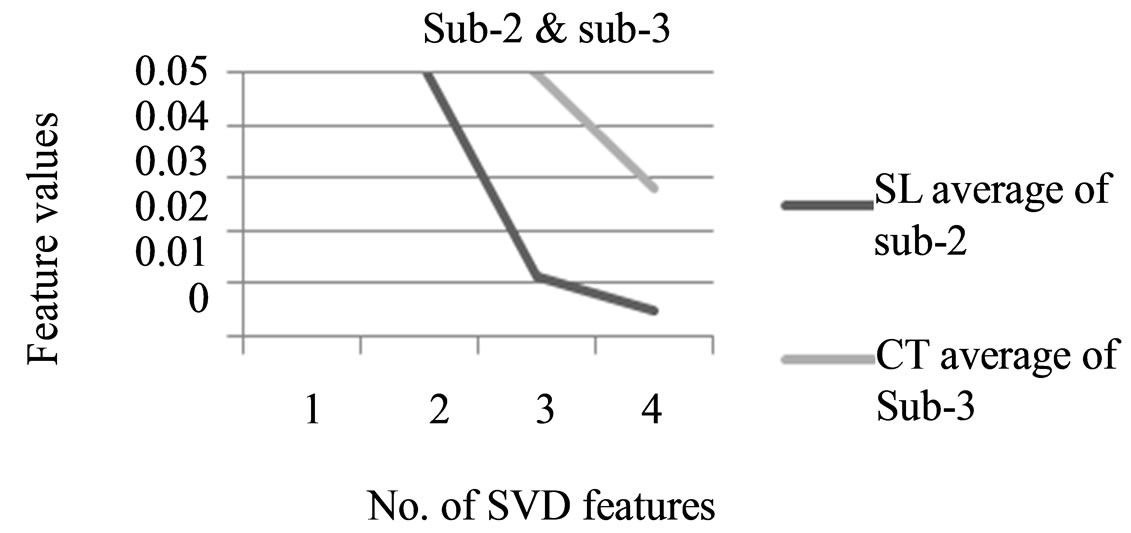
Figure 17. Average of SVD features of Sponge Light Hold (SL) & Coin Tight hold (CT).
In Figure 18, the Euclidean Distance between the average HT of Subject 3 with the average CL of Subject 4 is shown for the identification of difference.
In Figure 16, the Euclidean Distance between the average CT of Subject 4 with the average SH of Subject 5 is shown for the identification of difference.
In Figure 19, the difference in Euclidean Distance between the FD values of average SH of Subject 2 with the average SL of Subject 1 is shown for the identification of difference.
In Figure 20, the difference in Euclidean Distance between the FD values of average CT of Subject 2 with the average SL of Subject 3 is shown for the identification of difference.
In Figure 21, the difference in Euclidean Distance between the FD values of average CL of Subject 3 with the average HT of Subject 4 is shown for the identification of difference.
In Figure 22, the difference in Euclidean Distance
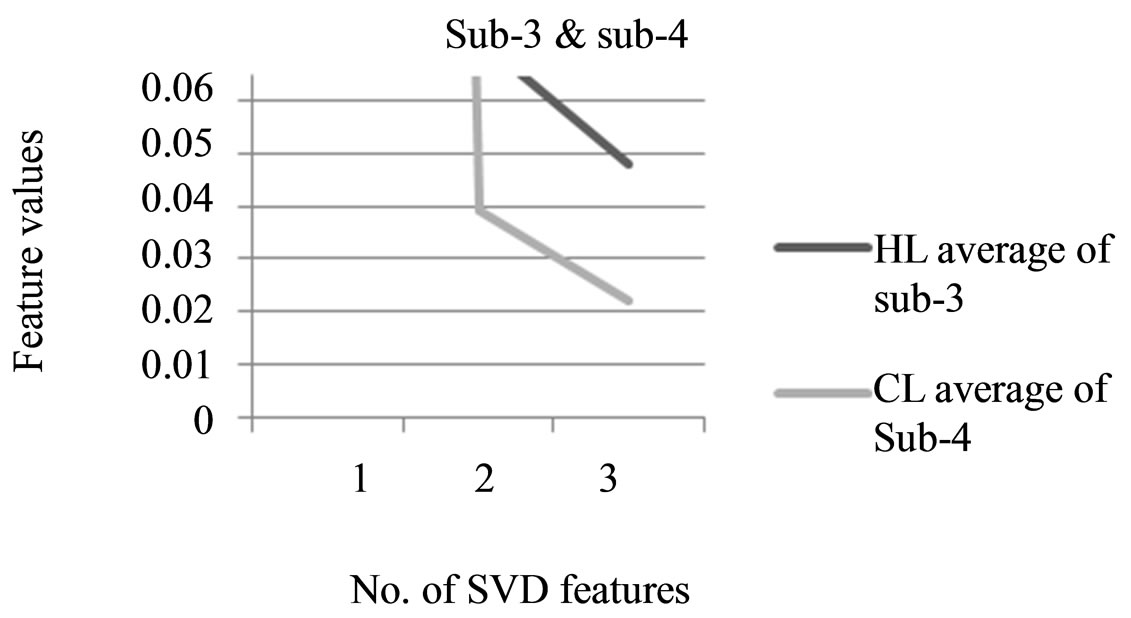
Figure 18. Average of SVD features of Iron Material tight hold (HT) & Coin Light hold (CL).

Figure 19. Average FD features of Sponge Hard hold (SH) & Sponge Light hold (SL).
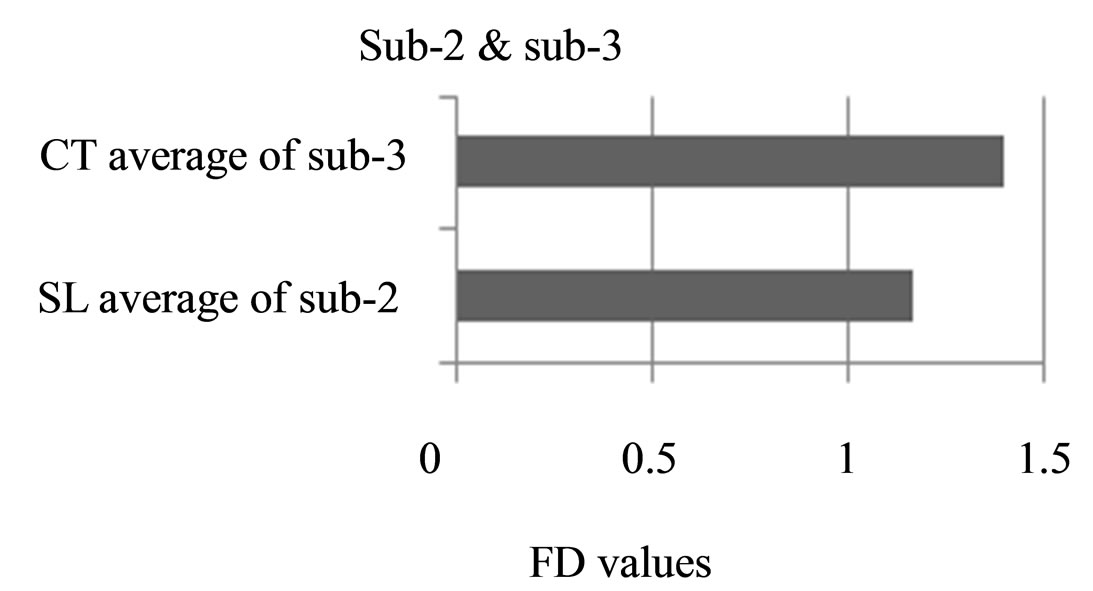
Figure 20. Average FD features of Sponge Light hold (SL) & Coin Tight hold (CT).
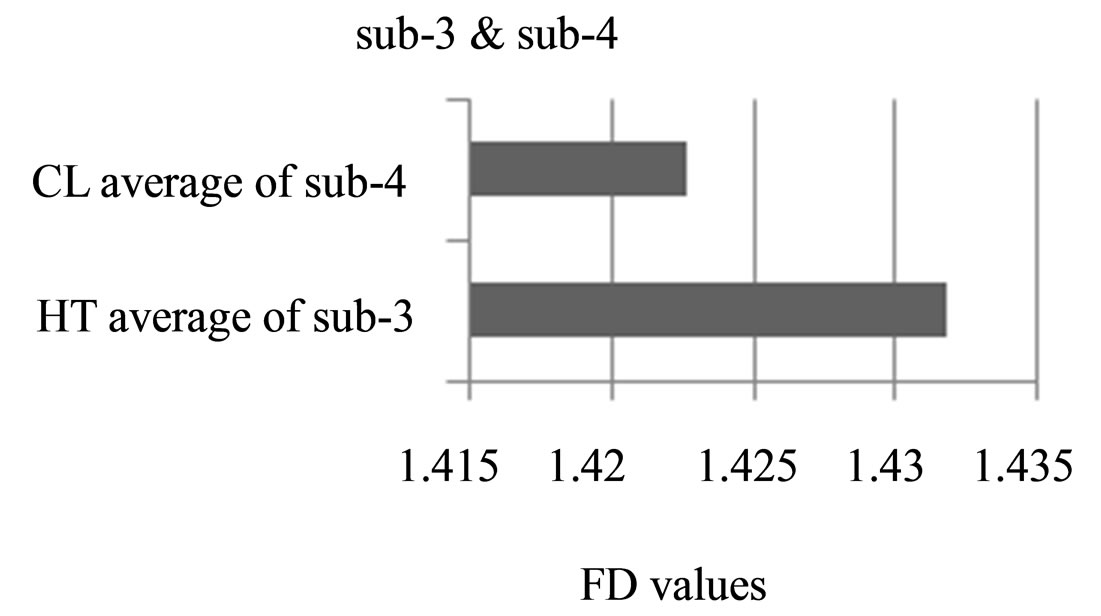
Figure 21. Average FD features of Coin Light hold (CL) & Iron Material Tight hold (HT).
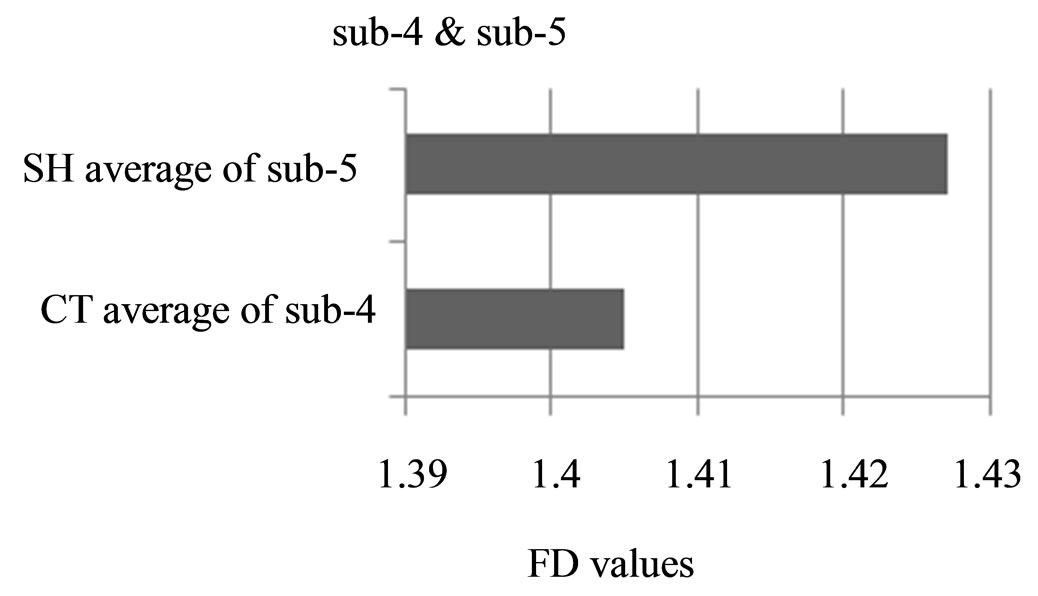
Figure 22. Average FD features of Coin Tight hold (CT) & Sponge Hard hold (SH).
between the FD values of average SH of Subject 5 with the average CT of Subject 4 is shown for the identification of difference.
In Figure 23, the difference in Euclidean Distance between the SVD features of all four different paradigms of Subject 5 is shown for the identification of difference among the paradigms .
4. Discussions
The American Sign Language (ASL) recognition system developed by many researchers has been the only remedy for emergency communications by differently abled people, elderly and those who were sick so far. But the proposed work simplifies the total framework by making minimal efforts free from any formal language semantics. The research idea of this work is to find the best suitable gestures for such emergency communication system which clearly specifies the intention of the used without overlapping with other gestures. In other words, the para- - digm gesture activities which result in a large Euclidean distance are found to be suitable for the emergency communication system in order to well distinguish the gestures from each other to initiate crucial responses by an automated care taking system or a robotic assistance.
The SVD and FD features of single user (say Sub-3) are calculated for all six paradigms and the results are produced. The average SVD and FD are calculated for all the five subjects under all six paradigms and individually represented in graphs. For in depth study, and verification, the produced results are further compared in various combinations with all subjects inter relatively and the results ensure a clear diversification of features between different gestures.
More over the maximum diversification in Euclidean distance by means of non overlapping features of different gestures were identified to select gesture that are suitable to be adopted for an error free automated care taking and/or robotic assistance system developments.
It is evidently shown for Subject 5 in Figure 23 that
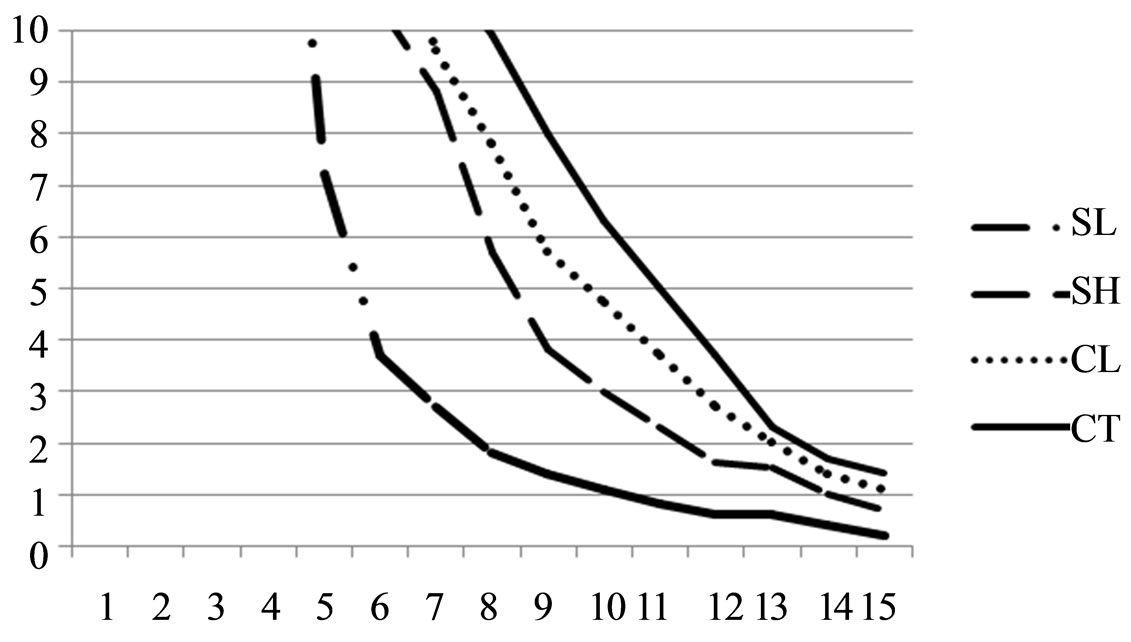
Figure 23. Intra Euclidean Distance of SVD features of Sub -5 on various paradigms.
the CT and SL are set apart in a wide range of distances, the same trend continued to all other subjects and is important to note here. The reason for cross comparison done between different paradigms of different subjects is to ensure the uniformity of gesture variations irrespective of subjects.
Another important point to note is the FD and SVD features behave in the same direction when used in calculating the Euclidean distance for classification and provide the same end result. This is to encourage the researchers and system developers a freedom of choice to select their convenient feature extraction algorithm while designing and enhancing the proposed system development.
5. Conclusion
The affective gesture movements suggested in this paper for the interaction of the elderly and the disabled with care takers are found to be a successful way of communication by the obtained experimental results. The proposed method is free from complex functions providing simple natural gestures for the people to adopt. Hence a wearable data glove is much useful for the emergency communication of the people under challenged conditions as it captures the signals that are generated by the mere finger and hand movements. The results obtained by the proposed system show the significant variation among the signals when different objects are held in different applied pressure. This system can be enhanced as a people-friendly, moderate cost and easy accessible robotic control system in healthcare, for replacing mankind from monotonous works.
REFERENCES
- R. Gentner and J. Classen “Development and Evaluation of a Low-Cost Sensor Glove for Assessment of Human Finger Movements in Neurophysiologic Settings,” Journal of Neuroscience Methods, Vol. 178, No. 1, 2009, pp. 138-147. doi:10.1016/j.jneumeth.2008.11.005
- www.5dt.com
- A. Ibarguren, I. Maurtua and B. Sierra, “Layered Architecture for Real Time Sign Recognition: Hand Gesture and Movement,” Engineering Applications of Artificial Intelligence, Vol. 23 , No. 7, 2010, pp. 1216-1228. doi:10.1016/j.engappai.2010.06.001
- C. Oz and M. C. Leu, “American Sign Language Word Recognition with a Sensory Glove Using Artificial Neural Networks,” Engineering Applications of Artificial Intelligence, Vol. 24, No. 7, 2011, pp. 1204-1213. doi:10.1016/j.engappai.2011.06.015
- S. Sayeed, R. Besar and N. S. Kamel, “Dynamic Signature Verification Using Sensor Based Data Glove,” ICSP 2006 Proceedings, Beijing, 16-20 November 2006, pp. 2387-2390.
- S. Sayeed, N. S. Kamel and R. Besar, “A Novel Approach to Dynamic Signature Verification Using Sensor-Based Data Glove,” American Journal of Applied Sciences, Vol. 6, No. 2, 2009, pp. 233-240.
- N. S. Kamel, S. Sayeed and G. A. Ellis, “Glove-Based Approach to Online Signature Verification,” IEEE Transactions on Pattern Analysis and Machine Intelligence, Vol. 30, No. 6, 2008, pp. 1109-1113. doi:10.1109/TPAMI.2008.32
- C. K. Loo, A. Samraj and G. C. Lee, “Evaluation of Methods for Estimating Fractal Dimension in Motor Imagery Based Brain Computer Interface,” Discrete Dynamics in Nature and Society, Vol. 2011, 2011, Article ID: 724697.
- U. Güçlü, Y. Güçlütürk and C. K. Loo “Evaluation of Fractal Dimension Estimation Methods for Feature Extraction in Motor Imagery Based Brain Computer Interface,” Procedia Computer Science, Vol. 3, 2011, pp. 589-594. doi:10.1016/j.procs.2010.12.098
- S. Sayeed, S. Andrews, R. Besar and L. C. Kiong “Forgery Detection in Dynamic Signature Verification by Entailing Principal Component Analysis”, Discrete Dynamics in Nature and Society, Vol. 2007, 2007, Article ID: 70756. doi:10.1155/2007/70756