Materials Sciences and Applications
Vol.08 No.13(2017), Article ID:80937,15 pages
10.4236/msa.2017.813068
Visualizing the Effect of Extrusion Velocity on the Spatial Variation of Porosity in a Titanium Dioxide/Binder System
Mustafa Kanaan Alazzawi, Sukanya Murali, Richard A. Haber
Department of Materials Science and Engineering, Rutgers University, Piscataway, NJ, USA

Copyright © 2017 by authors and Scientific Research Publishing Inc.
This work is licensed under the Creative Commons Attribution International License (CC BY 4.0).
http://creativecommons.org/licenses/by/4.0/


Received: October 18, 2017; Accepted: December 5, 2017; Published: December 8, 2017
ABSTRACT
Extrusion is a common process technique used to fabricate porous materials such as catalysts and membranes. The performance and efficiency of such materials are governed by porosity and pore distribution. The spatial variation of porosity within the catalyst structure can be linked to process variables in the extrusion processes such as extrusion velocity. A change in extrusion velocity can lead to a change in extrusion pressure. The extrusion pressure effect is a combination of die entry deformation and frictional die land shear. In this work, the effect of extrusion velocity on the spatial variation of porosity in a titania-binder extrudate has been studied. Capillary rheometer analysis was done to investigate the effect of extrusion velocity. A segmentation approach was developed to study the spatial variation of porosity at the die wall (sheared region) compared to the unsheared (center) region of the extrudate. The results show that the extrusion pressure effect increases as the velocity increases. The extrusion conditions affect the spatial variation of porosity.
Keywords:
Porosity Distribution, Extrusion Velocity, Image Analysis, Catalyst Support

1. Introduction
Environmental pollution has been a major concern for the past few decades. Air pollution has posed environmental issues since the industrial revolution. On a daily basis, there are dozens of harmful gases contributing to climate change and global warming [1] [2] . The harmful emissions can be mitigated using catalytic converters and membranes [3] [4] . Extrusion processes are used to produce honeycomb catalytic converters to support an active component [3] [4] [5] . Titanium dioxide (TiO2) is used as a catalyst support because of its desirable properties such as high catalytic activity, and excellent thermal and chemical stability [6] .
Extrusion processes can cause inhomogeneity and microstructural variations in a material. High quality extrusion products depend on many factors such as extrusion velocity [7] . The selectivity and activity of the catalysts are highly dependent on porosity and pore size distribution in the catalysts [8] . Additionally, species diffusivity in catalyst materials is influenced by many factors such as pore volume and distribution [8] [9] [10] [11] .
In the extrusion process, the paste flows through a varying die geometry and extrusion can be performed at varying extrusion velocities. The capillary rheometer is used to analyze the flow behavior in the extrusion process. The extrusion pressure-time/displacement profiles represent the flow behavior as described in the experimental section. During extrusion, the solid and liquid phase movement occurs due to the driving force for solid deformation and liquid movement respectively [7] [12] [13] . The liquid phase mobility is higher than the solid phase under an extrusion force. The liquid tends to fill the pores and redistribute [7] [12] [13] [14] [15] . The redistribution is controlled by the permeability of the paste and its viscosity [7] [12] [13] . The permeability of the solid phase is determined by the stress that is generated during the extrusion process [7] [12] [14] . However, the driving force for solid deformation is impeded by the frictional force between the particles, at the die, and barrel wall [12] . The paste is subjected to a shear along the die, barrel wall, and deformation at the die entry as shown in Figure 1 [13] . The shear along the die land is a function of extrusion velocity. The deformation of the materials in the die entry is inhomogeneous [16] .
The extrusion pressure is a contribution of die entry pressure (die entry deformation) and die land pressure (wall shear) [5] [17] . In general, the pressure at a high extrusion velocity increases rapidly. The increase in pressure is because of

Figure 1. A capillary rheometer with shear effect and die entry deformation.
high deformation at the die entry and high frictional shear along the die land [13] [18] . There is a maximal liquid migration at a lower extrusion velocity as result of a high relative velocity of water within the paste [7] [12] [13] [19] . A thin film of the liquid is formed along the die land due to liquid migration at low extrusion velocities which provides a lubrication effect [7] [16] [17] [18] . This layer reduces the wall frictional shear at low velocity, but has no effect on the paste deformation at the die entry [16] , although, in some instances, the lubrication effect could cause extrusion failure as suggested in [17] [20] .
The shear effect has been investigated in many studies without considering its effect on the microstructural, pore distribution, and pore interconnectivity. Non-uniform surface and macro defects in the extrudate can be linked to the extrusion velocity. Surface fracture happens at low and high velocities depending on the paste rheology [5] .
A lack of understanding of pore spatial distribution in extrudate would lead to a poor modeling of tortuosity and the diffusion path of reactants. A proper evaluation of pore distribution would provide a better understanding of diffusion in catalysts.
The conventional approach to investigating porosity in extruded materials is performed either by mercury or helium porosimetry, but this technique does not provide a quantitative analysis of the pore spatial distribution. It can quite often lead to an underestimation of porosity because the fluid does not intrude the isolated pores [21] [22] .
In addition to porosimetry, imaging followed by image analysis techniques can be used to analyze a sequence of images and provide quantitative information on particle shape, porosity, and pore size distribution. The accuracy of the image analysis depends on image resolution, brightness/ contrast, and type of segmentation approach followed [22] . There are several image analysis software available for 2 dimensional analysis, ImageJ (National Institutes of Health, USA) being one of them. It is an open platform Java based software compatible with most of the image formats and operating systems. ImageJ has widely been used in a variety of applications to provide a quantitative analysis [22] [23] [24] [25] .
A number of segmentation approaches have been developed for image analysis [21] [22] [25] [26] [27] [28] [29] . One such segmentation tool is thresholding. Thresholding an image is based on identifying individual pixels based on its intensity [30] . The pixel intensity is represented by a histogram. Phases, features, and points can be differentiated from each other based on the pixel intensity. The drawbacks of ImageJ thresholding are the lack of trustworthy auto-assessment and errors caused by human interpretation [21] [25] [30] .
In this work, to quantify the porosity distribution, a number of images acquired through scanning electron microscopy were extensively analyzed using a segmentation approach developed using ImageJ and Adobe Photoshop CC (Adobe Systems Inc., USA). This research aims to understand the effect of extrusion velocity on the microstructural variations in the sheared region (i.e. at the die wall) compared to the unsheared region (radial center of the extrudate).
2. Experimental
The optimal composition of paste was determined based on the ease of forming a paste-like material and extrudability of the paste. These criteria were used to determine the experimental parameters.
2.1. Mixing Conditions and Paste Formulation
G2 TiO2 powder (Cristal Global, France) was pre-mixed with 2.4% Hydroxypropyl Methylcellulose (HPMC) binder (The Dow Chemical Company, USA) in a dry state using Resodyn Acoustic mixer (Resodyn Acoustic Mixers Inc., USA) at 100% intensity for 2.5 mins to obtain a well-mixed binder-powder distribution. Resodyn Acoustic mixer induces micro mixing zones. The mixer generates a mechanical resonance through the entire materials [31] . Then, the blended powder is pre- mixed with 56.4% H2O using a container with a spatula to form a wet mixture. The weight %noted here is based on G2 powder weight.
The wet mixture was loaded into Rheomix 600 (Haake Buchler Instruments Inc., USA) with a sigma blades mixer. The mixing behavior was monitored by a Haake Rheocord 9000 Torque Rheometer (Haake Buchler Instruments Inc., USA) [32] . Sigma blades shear and disperse the materials between the blades to form an extrudable paste. The mixing speed and time were set to 100.0 RPM for 35.0 min to deagglomerate and homogenize the mixture to achieve better mixedness [32] . The paste was aged and sealed in a container at room temperature for 2 hr. to allow for water equilibration within the paste [13] . The moisture content of pre-mixing, post-mixing, and post-aging materials was monitored using a Computrac Moisture Analyzer (Arizona Instrument LLC, USA).
2.2. Extrusion Conditions and Paste Flow
The extrusion experiments were conducted on the paste at varying piston velocities (shear rates) (1.0, 5.0, 10.0, 20.0, 30.0) mm/min. They were extruded through a cylindrical die with an 8.0 mm length, a 2.0 mm diameter, and an 180˚ die entry. In this work, an RH2000 Capillary Rheometer (Malvern Instruments Ltd., UK) was used to study the rheology of the paste.
The barrel was filled with the paste. The paste was tamped using a rod to remove the trapped air and compact the paste in the barrel. The ram was slowly lowered until it comes in direct contact with the top surface of the paste in the barrel pre-performing the test.
Figure 2 shows a typical extrusion profile. At the outset of the extrusion, the pressure increases rapidly as the paste is compacted in the barrel under an extrusion velocity and pushed along the die wall. The pressure decreases at a point where the barrel wall shear is at a minimum. Extrusion pressure then increases rapidly due to a high shear and extensive phase movement [5] . The extrusion pressure was calculated as the average of the data that were collected for 150.0 seconds for a given velocity prior the rapid increase in pressure. The extrudates were collected prior to the rapid increase in pressure to minimize the influence of other high shear based factors on the microstructure. As suggested in this paper [33] ,

Figure 2. A typical extrusion profile of all the pastes used in this study.
the extrusion pressure was calculated as the average value from the data that were collected at a given velocity over a piston displacement of at least 5.0 mm.
2.3. Sample Preparation and 2D Image Quantitative Analysis
2.3.1. Sample Preparation
To remove the binder, the extrudate was heat treated to 650.0˚C in air, prior to the sintering onset. The temperature of binder degradation was determined using thermogravimetric analysis (TGA) as described in this study [32] . The results of TGA showed that the temperature of degradation is 650.0˚C with a residual ~4.0 wt% for HPMC.
A heat treated extrudate was embedded using a metallurgical epoxy, the Spurr’s kit (Electron Microscopy Sciences, USA), to prepare samples for cross sectional polishing followed by imaging with Field Emission Scanning Electron Microscope (FESEM). The metallurgical epoxy provides a contrast with the other phases in the extrudate for 2D quantitative image analysis. Prior to infiltration, the viscosity of epoxy was lowered by heating it at 60.0˚C for 15.0 min. The extrudate and epoxy were kept under vacuum for 45.0 min to fill the pores. The infiltrated extrudate was cured at 70.0˚C [32] .
The samples were mechanically polished. Then, the samples were ion milled for (3.5 - 4.0) hrs using a Hitachi IM 4000 ion mill (Hitachi High Technologies America Inc, USA). Surface imperfections such as pullouts and scratches can pose inaccuracies with image analysis. They increase human error and user bias. The quality of surface can improve image analysis and provide more reliable data. We have found that the mechanical polishing technique can lead to inaccuracies with image analysis; however, ion milling post-polishing provides a high quality surface improving our image analysis.
The samples were fixed on FESEM stubs with carbon tape and sputter coated with 15.0 nm of gold to prevent any charging issue. This enabled high resolution FESEM images at high magnification.
2.3.2. Image Acquisition and Analysis
Images were acquired using FESEM (Zeiss, USA). The backscatter electron
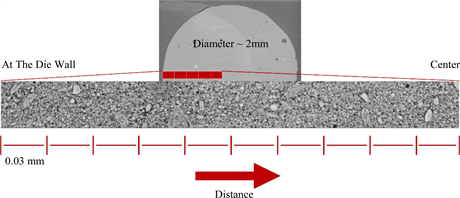
Figure 3. Extrudate cross section shows scanning direction and imaging step.
detector was used to provide a high contrast between different phases in the sample. Images were in indexed color mode (uses up to 256 colors) with 1024 × 768 pixels and 8-bit channel. Images were obtained sequentially for each extrudate from the die wall (sheared region) to the center of the cross section with a 0.03 mm step using the stage navigator in the FESEM. This is shown in Figure 3. For the sake of simplicity, we assumed that the pore distribution is axisymmetric because an axisymmetric die geometry was used.
Imaging was conducted at the same magnification, brightness, and contrast for each sample. A higher magnification FESEM (10.0 K) was used to enable imaging of the smaller pores but still allowing us to work with a reasonable number of images.
The intensity of pixels is between the low intensity dark pixel and high intensity bright pixel. The intensity values are between 0 (completely black) and 255 (completely white). Each pixel holds information that describes the image content. The intensity is affected by the brightness and contrast of the image [30] . During image analysis, the brightness and contrast were adjusted using Adobe Photoshop CC to improve the user’s acuity, segmentation accuracy, lower the uncertainty, and reduce the over-segmentation [22] [34] . The brightness and contrast adjustment was visually kept the same between the images.
Images can be parted into two classes: a solid class (TiO2) and a pore/crack/ epoxy class. The darker pixels (low intensity) belong to the pore/crack/epoxy class and are distinctly different from the brighter pixels (high intensity) that belong to the solid class. “Intermediate shades of gray represent the transition in brightness that occurs as the solid component terminates into pores” [22] [34] . In agreement with [22] [34] , the assumption was that the pixel color of pore/ crack/epoxy has a certain range of the gray scale. The color table uses up to 16 × 16 colors. We have assumed that 6 × 16 colors are pore/crack/epoxy as indicate in Figure 4. The pore, crack, and epoxy pixel were assigned a single color. This was applied for all images to maintain consistency and lower the user bias.
The steps employed in segmentation of the images are as follows:
1) Crop the image to remove the information bar of the FESEM image using Adobe Photoshop CC. The image pixel will be 1024 × 692.
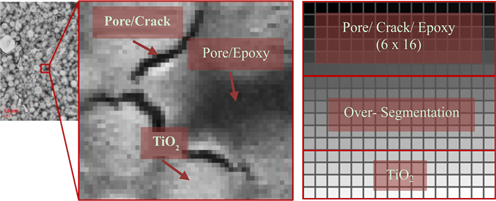
Figure 4. Typical phases of extrudate with distinguishable pixels (left) and the gray scale of the images as shown in Adobe Photoshop CC (right) where the pore/crack/epoxy phase are black and near black pixels, near brighter gray pixels cause an over segmentation, and TiO2 phase is the brighter pixels.
2) The image must be converted to grayscale mode in Adobe Photoshop CC (Image > mode> grayscale) with 256 colors as shown in Figure 5 for editing purpose in step 3. This can be automated as well.
3) The brightness and contrast of gray level images can be adjusted in Adobe Photoshop CC (Image > Adjustments > Brightness/Contrast). It must be kept the same among all the images. It can be edited to enhance the segmentation and to match brightness and contrast visually. This step also can be automated in Adobe Photoshop CC.
4) The images must convert back to the indexed color mode in Adobe Photoshop CC (Image > mode > Indexed Color). The indexed color images allow having a table of all the colors that are seen in an image. This step can be recorded using Adobe Photoshop CC to automate it.
5) As we assumed above and shown in Figure 4 that the pore/crack/epoxy pixel color range is black to darker gray color which is 6 × 16 colors. Using Adobe Photoshop CC (Image > Mode> Color Table) allows changing the color of these pixels. In this work, the pixels were colored with a blue color (#0000ff). The idea is to color certain pixels with a distinguishable color and to show that on the intensity of ImageJ histogram as shown in Figure 5. This can be automated using Adobe Photoshop CC. This must be applied to all images. The only factor that will play a role here is the amount of pore, crack, and epoxy areas seen in an image. This minimizes user bias.
6) To determine the porosity in ImageJ (Image > Adjust > Threshold), the colored pixel then can be easily distinguished and thresholded. It based on the colored intensity as shown in Figure 5. The percentage of the pixel can be input and used for other purposes.
This method could help reduce the user bias in segmentation by defining the pore/epoxy pixel color. This helped to quantify the pores in each image; however, there are challenges to be addressed here. First, a lack of a system to automate the FESEM stage for acquiring numerous images easily. Secondly, the FESEM

Figure 5. Segmentation details.
conditions affect the brightness and contrast value. It was a challenge to keep the same conditions for a sequence of images in some cases. Thirdly, the big challenge is to keep the brightness and contrast the same between different sets of images; however, it can be edited using image software to have the same brightness and contrast visually.
Lastly, there is a limitation in acquiring the porosity using a different method such as porosimetry technique. The porosimetry technique provides a bulk porosity compared to this method which provides a “2-D porosity”. So, it is impossible to compare this method data with porosimetry data.
The method developed in this work aims to mitigate the challenges in image analysis related to user bias and segmentation and attempts to quantify the spatial variation of porosity in the microstructure due to the changes in processing conditions.
3. Results and Discussion
The following results show the extrusion velocity effect on the spatial variation of porosity. Our observations on paste quality and extrudability will be mentioned briefly.
3.1. Capillary Rheometer Analysis
In the extrusion experiment, the transducer pressure increases rapidly prior the yield point at high extrusion velocity. As the extrusion velocity decreases, the yield point delays. The yield point is not clear for samples that were extruded at very low extrusion velocity as shown in Figure 6. For Figure 7, data were obtained from three batches of the same formulation and under controlled environment for each extrusion velocity.
To describe the extrusion behavior versus velocity, a Bagley plot was used and is shown in Figure 7. Each data point was obtained by averaging the data that were collected for 150.0 sec to ensure that the increase in pressure prior the yield point is included in our calculation. The error bars are a standard deviation error of three batches for each data point.
The increase in extrusion pressure may be due to the die entry deformation and/or frictional die wall shear. The delay in yield point may be because of

Figure 6. Typical extrusion profiles of most represented behavior for data at varying extrusion velocities.

Figure 7. Extrusion pressure of paste as a function of extrusion velocity.
sufficient particle packing, low die entry deformation, and/or die wall shear. In Götz and Buggisch’s work [19] who studied and visualized the extrusion flow using NMR (Nuclear Magnetic Resonance). It showed that the paste is not sheared, but it is subjected to compression and displacement pre reaching the die entry. Following the displacement and compression stage, the center region of the paste flows at a higher velocity compared to the surrounding region of the paste. The shear deformations are examined at the walls. The shear at the walls is higher compared to the center region of the paste [19] .
A lubricating layer forms at low extrusion velocity which helps to reduce the friction effect at the die wall [7] [16] [17] [18] . As suggested in [19] , the moisture distribution is higher at the walls compared to the center of the paste in the capillary rheometer.
There are varying types of surface imperfections such as cavities and shark skin were observed in this study. This could be caused by either shear or pressure flow of water.
3.2. Microstructural Spatial Variations
Figure 8 shows a histogram of porosity distribution from the die wall (distance is around 0 mm) toward the center of the extrudate cross section (distance is around 0.9 mm). The spatial variation is an average of two samples for each extrusion velocity. Both samples were of the same formulation and extruded at same extrusion velocity under a controlled environment.
As seen from Figure 8 and Figure 9, samples that were extruded at a velocity of (1.0, 5.0, and 20.0) mm/min show a low porosity at the die wall when compared to the center region of extrudate cross section (unsheared region).
On the contrary, samples that were extruded at a velocity of (10.0 and 30.0) mm/min show a high porosity at the die wall compared to the center region of extrudate cross section (unsheared region) as shown in Figure 8 and Figure 10. Samples that were extruded at 20.0 mm/min do not show a high porosity at the die wall as was expected, this could be due to the processing conditions.
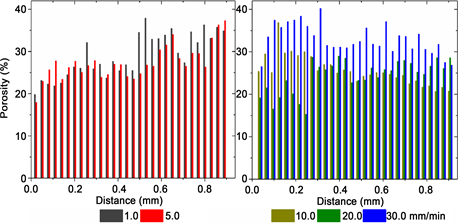
Figure 8. Spatial variations of porosity at the die wall (distance is around 0 mm) toward the center of extrudate cross section (distance is around 0.9 mm).

Figure 9. Typical extrudate cross section images of at die wall region (left) and the center region (right) for (1.0, 5.0, and 20.0) mm/min velocities.
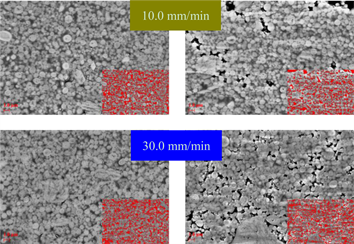
Figure 10. Typical extrudate cross section images of at die wall region (left) and the center region (right) for (10.0 and 30.0) mm/min velocities.
The spatial variation of porosity could be traced back to varying factors such as frictional die wall shear, die entry deformation, and/ or liquid migration. The capillary rheometer was used to extrude the paste at constant extrusion velocity or shear rate. The paste is subjected to a shear along the die and barrel wall as mentioned above. The shear influence is a function of extrusion velocity (shear rate). The shear influences the porosity at the die wall of extrudate. To understand this phenomenon of the shear influence, Götz and Zimehl [35] used a shear device which consists of two parallel plates. It showed an increase in the porosity because of a high shear stress. The shear stress increases due to the increase in the shear deformation. The shear deformation caused by the plates of the shear device. The increase in porosity also could be because of forming isolated particles in the sheared region [35] .
There is a possibility for liquid movement within the paste in the capillary rheometer. The liquid movement alters the microstructure. Götz et al. showed that there is a relationship between the local porosity, liquid flow, and solid/liquid concentration [15] . The cellulose binder (HPMC) that was used in this research helped to immobilize the water within the paste.
At this point, it is difficult to state any significant trend because of the challenges that were described in the experimental section. However, it is clear that the extrusion velocity could cause the spatial variation of porosity. The spatial variation of porosity is not consistent due to the extrusion conditions.
4. Conclusion
The relationship between the extrusion velocity and spatial variations of porosity of extrudate is presented. The extrusion pressure is a combination of die entry deformation and frictional die wall shear. The extrusion pressure increases as the extrusion velocity increases. A segmentation approach was developed to quantify the spatial variation of extrudate porosity. This approach could be developed and used to visualize extrusion applications. The extrusion velocity can cause a spatial variation of porosity. The spatial variation of porosity is not consistent and it is affected by extrusion conditions. It is difficult to state any particular pattern that the porosity distribution would follow due to the extrusion velocity effect. In the next step, wide range of extrusion velocities will be tested. The image analysis method will be refined. The die wall shear and die entry deformation effect will be investigated separately to understand these phenomena.
Acknowledgements
This research was sponsored by the National Science Foundation I/UCRC Award No.1540027. The views and conclusions contained in this document are those of the authors and should not be interpreted as representing the official policies, either expressed or implied, of the National Science Foundation or the U.S. Government. The U.S. Government is authorized to reproduce and distribute reprints for Government purposes notwithstanding any copyright notation herein.
Thank you for everyone who helped in this research: Ian Maher, Joe Prati, Frank Maniaci, Priya Shah, and Kaavya Krishna- Kumar (Rutgers University); Eric Bennett, John Casola, and Chuck Rohn (Malvern Instruments Ltd.).
Cite this paper
Alazzawi, M.K., Murali, S. and Haber, R.A. (2017) Visualizing the Effect of Extrusion Velocity on the Spatial Variation of Porosity in a Titanium Dioxide/Binder System. Materials Sciences and Applications, 8, 933-947. https://doi.org/10.4236/msa.2017.813068
References
- 1. Matyssek, R., Clarke, N., Cudlín, P., Mikkelsen, T.N., Tuovinen, J.-P., Wieser, G. and Paoletti, E. (2013) Climate Change, Air Pollution and Global Challenges: Understanding and Perspectives from Forest Research. Developments in Environmental Science, 13, 3-16. https://doi.org/10.1016/B978-0-08-098349-3.00001-3
- 2. Karl, T.R. and Trenberth, K.E. (2003) Modern Global Climate Change. Science, 302, 1719-1723. https://doi.org/10.1126/science.1090228
- 3. Japan, T.C.S.O. and Kyōkai, N.S. (2012) Advanced Ceramic Technologies & Products. Springer Science & Business Media, Tokyo.
- 4. Heck, R.M., Farrauto, R.J. and Gulati, S.T. (2009) Catalytic Air Pollution Control: Commercial Technology. John Wiley & Sons, Hoboken. https://doi.org/10.1002/9781118397749
- 5. Benbow, J. and Bridgwater, J. (1993) Paste Flow and Extrusion. Oxford University Press, UK.
- 6. Bagheri, S., Muhd Julkapli, N. and Bee Abd Hamid, S. (2014) Titanium Dioxide as a Catalyst Support in Heterogeneous Catalysis. The Scientific World Journal, 2014, Article ID: 727496. https://doi.org/10.1155/2014/727496
- 7. Yu, A., Bridgwater, J., Burbidge, A. and Saracevic, Z. (1999) Liquid Maldistribution in Particulate Paste Extrusion. Powder Technology, 103, 103-109. https://doi.org/10.1016/S0032-5910(98)00212-5
- 8. Lapszewicz, J.A., Loeh, H.J. and Chipperfield, J.R. (1993) The Effect of Catalyst Porosity on Methane Selectivity in the Fischer–Tropsch Reaction. Journal of the Chemical Society, Chemical Communications, Issue 11, 913-914. https://doi.org/10.1039/C39930000913
- 9. Vannice, M.A. and Joyce, W.H. (2005) Kinetics of Catalytic Reactions. Springer. https://doi.org/10.1007/b136380
- 10. Lee, Y., Kim, T. and Choi, Y. (2013) Effect of Porosity in Catalyst Layers on Direct Methanol Fuel Cell Performances. Fuel Cells, 13, 173-180. https://doi.org/10.1002/fuce.201200014
- 11. Fischer, A., Jindra, J. and Wendt, H. (1998) Porosity and Catalyst Utilization of Thin Layer Cathodes in Air Operated PEM-Fuel Cells. Journal of Applied Electrochemistry, 28, 277-282. https://doi.org/10.1023/A:1003259531775
- 12. Rough, S., Wilson, D. and Bridgwater, J. (2002) A Model Describing Liquid Phase Migration within an Extruding Microcrystalline Cellulose Paste. Chemical Engineering Research and Design, 80, 701-714. https://doi.org/10.1205/026387602320776786
- 13. Rough, S., Bridgwater, J. and Wilson, D. (2000) Effects of liquid phase migration on extrusion of microcrystalline cellulose pastes. International journal of pharmaceutics, 204, 117-126. https://doi.org/10.1016/S0378-5173(00)00478-6
- 14. Gotz, J., Müller, D., Buggisch, H. and Tasche-Lara, C. (1994) NMR Flow Imaging of Pastes in Steady-State Flows. Chemical Engineering and Processing: Process Intensification, 33, 385-392. https://doi.org/10.1016/0255-2701(94)02010-8
- 15. Gotz, J., Kreibich, W. and Peciar, M. (2002) Extrusion of Pastes with a Piston Extruder for the Determination of the Local Solid and Fluid Concentration, the Local Porosity and Saturation and Displacement Profiles by Means of NMR Imaging. Rheologica Acta, 41, 134-143. https://doi.org/10.1007/s003970200012
- 16. Horrobin, D. and Nedderman, R. (1998) Die Entry Pressure Drops in Paste Extrusion. Chemical Engineering Science, 53, 3215-3225. https://doi.org/10.1016/S0009-2509(98)00105-5
- 17. Das, R.N., Madhusoodana, C. and Okada, K. (2002) Rheological Studies on Cordierite Honeycomb Extrusion. Journal of the European Ceramic Society, 22, 2893-2900. https://doi.org/10.1016/S0955-2219(02)00045-6
- 18. Benbow, J., Blackburn, S. and Mills, H. (1998) The Effects of Liquid-Phase Rheology on the Extrusion Behaviour of Paste. Journal of Materials Science, 33, 5827-5833. https://doi.org/10.1023/A:1004458217898
- 19. Gotz, J., Buggisch, H. and Peciar, M. (1993) NMR Imaging of Pastes in a Ram Extruder. Journal of Non-Newtonian Fluid Mechanics, 49, 251-275. https://doi.org/10.1016/0377-0257(93)85004-T
- 20. Chen, Y., Burbidge, A. and Bridgwater, J. (1997) Effect of Carbohydrate on the Rheological Parameters of Paste Extrusion. Journal of the American Ceramic Society, 80, 1841-1850. https://doi.org/10.1111/j.1151-2916.1997.tb03059.x
- 21. Rajagopalan, S., Lu, L., Yaszemski, M.J. and Robb, R.A. (2005) Optimal Segmentation of Microcomputed Tomographic Images of Porous Tissue-Engineering Scaffolds. Journal of Biomedical Materials Research Part A, 75A, 877-887. https://doi.org/10.1002/jbm.a.30498
- 22. Guarino, V., Guaccio, A., Netti, P.A. and Ambrosio, L. (2010) Image Processing and Fractal Box Counting: User-Assisted Method for Multi-Scale Porous Scaffold Characterization. Journal of Materials Science: Materials in Medicine, 21, 3109-3118. https://doi.org/10.1007/s10856-010-4163-9
- 23. Jensen, E.C. (2013) Quantitative Analysis of Histological Staining and Fluorescence Using ImageJ. The Anatomical Record, 296, 378-381. https://doi.org/10.1002/ar.22641
- 24. Ku, N. (2015) Evaluation of the Behavior of Ceramic Powders under Mechanical Vi-bration and Its Effect on the Mechanics of Auto-Granulation. Ph.D. Thesis, Rutgers University, New Brunswick.
- 25. Grove, C. and Jerram, D.A. (2011) jPOR: An ImageJ Macro to Quantify Total Optical Porosity from Blue-Stained Thin Sections. Computers & Geosciences, 37, 1850-1859. https://doi.org/10.1016/j.cageo.2011.03.002
- 26. Li, C.-T. (2003) Multiresolution Image Segmentation Integrating Gibbs Sampler and Region Merging Algorithm. Signal Processing, 83, 67-78. https://doi.org/10.1016/S0165-1684(02)00377-8
- 27. Andriani, G. and Walsh, N. (2002) Physical Properties and Textural Parameters of Calcarenitic Rocks: Qualitative and Quantitative Evaluations. Engineering Geology, 67, 5-15. https://doi.org/10.1016/S0013-7952(02)00106-0
- 28. Martin, W.D., Putman, B.J. and Kaye, N.B. (2013) Using Image Analysis to Measure the Porosity Distribution of a Porous Pavement. Construction and Building Materials, 48, 210-217. https://doi.org/10.1016/j.conbuildmat.2013.06.093
- 29. (2014) Standard Test Methods for Determining Area Percentage Porosity in Thermal Sprayed Coatings. ASTM International.
- 30. Pérez, J.M.M. and Pascau, J. (2013) Image Processing with ImageJ. Packt Publishing Ltd., Birmingham.
- 31. Osorio, J.G. and Muzzio, F.J. (2015) Evaluation of Resonant Acoustic Mixing Performance. Powder Technology, 278, 46-56. https://doi.org/10.1016/j.powtec.2015.02.033
- 32. Alazzawi, M. and Haber, R. (2017) The Effect of Paste Water Content on the Green Microstructure of Extruded Titanium Dioxide. Processing, Properties, and Design of Advanced Ceramics and Composites: Ceramic Transactions, 261, 3-13.
- 33. Powell, J., Assabumrungrat, S. and Blackburn, S. (2013) Design of Ceramic Paste Formulations for Co-Extrusion. Powder Technology, 245, 21-27. https://doi.org/10.1016/j.powtec.2013.04.017
- 34. (2012) Standard Guide for Interpreting Images of Polymeric Tissue Scaffolds. ASTM International.
- 35. Gotz, J. and Zimehl, R. (2002) Shear and NMR Experiments of Materials with Flow Behaviour Depending on the Deformation History. Colloid and Polymer Science, 280, 389-397. https://doi.org/10.1007/s00396-001-0623-6