Materials Sciences and Applications
Vol.08 No.08(2017), Article ID:78227,11 pages
10.4236/msa.2017.88042
Fractal Characteristics of Microporous Adsorbents
Vladimir V. Kutarov1, Eva Schieferstein2, Yuriy Leonidovych Zub3, Erich Robens4
1Research Institute of Physics, I. I. Mechnikov National University, Odesa, Ukraine
2Fraunhofer Institute UMSICHT, Oberhausen, Germany
3Chujko Institute of Surface Chemistry, National Academy of Sciences of Ukraine, Kiev, Ukraine
4Battelle-Institut e.V., Frankfurt am Main, Germany (formerly), Schlesierstr. 5, Friedrichsdorf, Germany

Copyright © 2017 by authors and Scientific Research Publishing Inc.
This work is licensed under the Creative Commons Attribution International License (CC BY 4.0).
http://creativecommons.org/licenses/by/4.0/


Received: February 14, 2017; Accepted: August 5, 2017; Published: August 8, 2017
ABSTRACT
The traditional version of the theory of volume filling of micropores was used for the estimation of the fractal dimension of microporous solids. For this purpose, the Dubinin’s integral equation was solved for infinite and limited integration limits. The results were applied to the adsorption of nitrogen (T = 78 K) on coal samples and Davisil F silica and to the adsorption of water (Т = 293 К) on lunar soil sample and on rice starch.
Keywords:
Pore Structure, Micropores, Fractal Dimension, Dubinin’s Equation, Mathematical Analysis

1. Introduction
The description of microporous adsorbents is a complicated problem in physical chemistry. One can distinguish two methods for the description of microporous adsorbents: macroscopic and microscopic.
The macroscopic method considers the macro-level (macroscopic thermodynamic), using the experimentally measured parameters and generalizing the obtained results. Their deficiency consists in the assumption of a size (or energy) distribution (fractal function) of micropores. Therefore, the distribution of micropores plays a dominating role. The most widespread macroscopic method is the theory of volume filling of micropores (TVFM). The simplest description by TVFM is given by the Dubinin-Radushkevich (DR) approach assuming a Gaussian or generalized Gaussian size distribution of micropores [1] [2] .
Stoeckli proposed a VFM-model taking into account heterogeneous properties of materials. He assumed that a real material contains elements which can be separately described by the general equations of VFM. However, the parameters of equations for separate elements depend on the heterogeneous material (complex structures) changes [3] .
The microscopic description considers the molecular level: this allows obtaining the molecular comprehension of the measured parameters. This feature makes it possible to calculate the pore size distribution. One describes the adsorbate-pore interaction based on several models of the solid structure. The most interesting microscopic methods are the Horvath-Kawazoe (HK) method [4] and the density functional method [5] .
Another way for the description of complex structures, beside the macro- and microscopic approach, is fractal geometry. The fractal geometry approach is applied successfully in heterogeneous chemistry. The geometry of the interface is a key parameter that affects the molecule-surface interaction. Surface irregularity affects all aspects of the physical and chemical properties of surfaces, including the adsorbed molecule conformation [6] .
The aim of this paper is to obtain the relationship for calculation of the fractal dimension D for adsorption of gases and vapors on fractal surfaces of microporous materials. To achieve the goal, we shall solve the Dubinin’s integral equation [1] .
2. Theory
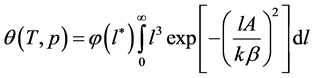
As mentioned in the introduction, Dubinin’s integral equation [2] assumes to represent  in the form:
 (1)
(1)
Here  is the micropore size distribution function; l is the typical size (the characteristic width of slit-like micropores, or the radius of cylinder-like micropores); lmin and lmax denote the minimum and maximum values of l; k is an empirical constant and β is the similarity coefficient that characterizes the adsorbate. Equation (1) also contains the adsorption potential
  , where ΔG is the Gibbs potential, p0 and p denote the saturation and equilibrium pressure of the gaseous adsorbate, respectively, R is the universal gas constant, T is the absolute temperature. The relative adsorption θ is defined as the ratio of the amount a of the adsorbate in the micropores at the equilibrium pressure p to the maximum amount a0 of the adsorbate in these micropores. The micropore adsorption capacity may be converted to the micropore volume.
To determine the function  various methods for solution of the integral Equation (1) have been proposed. The most common solution can be obtained by the method of integral transformations-Fourier transform. However, this method of calculation is for the practical use very difficult.
Two further methods are applicable:
1. Method: Preset distribution function 
The study of Equation (1) is carried out based on two approximations:
1) Preliminary assignment of the distribution function:
 (2)
(2)
where the fractal representation of the distribution function , is used [6] . In formula (2) m is the similarity coefficient and D is the fractal dimension.
2) TVFM is based on the assumption that the values are  and
and . However, no rigorous physically sound evidence for this assumption has been provided [1, 2]. In what follows, we will carry out a study of Equation (1) taking into account both assumptions. Then Equation (1) should be rewritten as:
 (3)
(3)
which can be rewritten as follows:
 (4)
(4)
For analytical solutions of Equation (4) we make the following additional assumptions:
1) The quantity  is an additive function [1, 2];
2) In Equation (4), the integrand has a sharp maximum. This determines the maximum value of  corresponding to a certain
  (
( ) for a given value of A;
3) The function of density distribution  is a continuous and slowly varying function;
4) In the neighborhood of  the function
  has a constant value equal to the value
 .
.
Therefore, to solve Equation (4) one can apply the method of steepest descent, named also the “saddle point” method [7] . Assuming that for the maximum of the integrand, in the vicinity of , the function
  takes a constant value
 , Equation (4) can be rewritten as follows:
 (5)
(5)
Equating the derivative of the integrand to zero, one can determine the value .
.
 (6)
(6)
After this, integrating (5), we obtain:
 (7)
(7)
From Equation (7) we find out the formula for determining the distribution function :
:
 (8)
(8)
As stated above, the distribution function is defined as . Thus, on the basis of formulas (4b) and (8) and with the experimental values
  and A one can determine the fractal dimension D as follows:
 (9)
(9)
3. Method of Tangents
However, as mentioned above, the replacement of finite limits of integration in Equation (1) is not properly justified. Equation (3) is written for an infinite range of the characteristic pore size. Therefore, Equation (8) is obtained based on the assumption of an infinite range of specific pore size. However, adsorbents contain pore sizes which vary over a finite range. Typically, the range of variation of the characteristic size of micropores is smaller than 2 × 10⁻⁹ m. It would therefore be advisable to check the adequacy of formula (8) in an independent manner.
Let us rewrite (1) as follows:
 (10)
(10)
For the representation of the experimental values  only one characteristic micropore size ln is taken.
 (11)
(11)
In the coordinates , Equation (11) will be represented by a smooth continuous convex line. The bulge of the curve, determined by the condition of the characteristic size of micropores, decreases with increasing A.
To obtain the dependence  for the set of experimental data determining the function (11), the tangential method is employed. The equation of the tangent to the curve
  in coordinates
  can be re- presented as [8] :
 (12)
(12)
where the subscript “0” indicates the nodes of the function.
Comparing Equations (11) and (12) one can find the parameters of the tangent function at the nodes (9):
 (13)
(13)
 (14)
(14)
Next, using formula (2) and the values obtained from formulae (13) and (14), one can determine the value of the fractal dimension D as follows:
 (15)
(15)
4. Results and Discussion
As examples, we consider: 1) the adsorption of nitrogen (T = 78 K) on coal samples ZC6 [9] ; 2) the adsorption of nitrogen (T = 78 K) on Davisil F silica [10] ; 3) adsorption of water (Т = 293 K) on lunar soil sample [11] [12] ; 4) adsorption of water (Т = 293 K) on rice starch [13] . Further information to the samples and measurements are described in [9] [10] [11] [12] [13] . Coal samples, lunar soil and rice starch are layered structures. For such adsorbents micropores have a slit-like shape [1] [14] . Samples of the Davisil F silica are treated as adsorbents with pores of spherical or cylindrical shapes [10] [14] . In the analysis of the adsorption process it is convenient to use the proportion of pore width l to the Van-der-Waals diameter of the adsorptive molecule σ. For slit-shaped pores volume filling in the pores occurs in the interval  and in the case of cylindrical pores in the interval
  [14] .
Now we have to study the adsorption of nitrogen on coal sample ZC6 (Figure 1).
An analysis of the adsorption isotherm is conveniently carried out on basis of the t-plot. On the basis of the t-plot the adsorbed amount is shown on the ordinate axis and the thickness (t) of the adsorption film on the abscissa axis [14] . Figure 2 shows a t-plot of the adsorption isotherm. In a range of the value of the adsorbate relative pressure 0.6 < x < 0.95 (t > 1.5) the adsorption film is stable and t-plot is accordingly linear.
To differentiate the regions of multilayer formation and capillary condensation in greater pores we describe the isotherm by the equation considered by

Figure 1. Adsorption isotherm of nitrogen on coal sample ZC6.
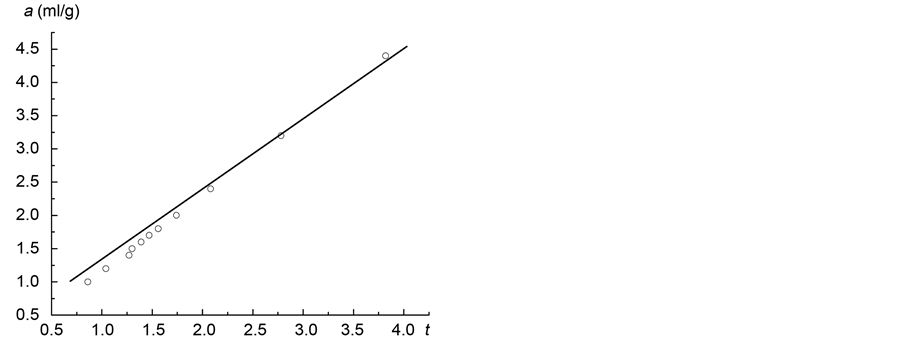
Figure 2. t-plot for the adsorption isotherm of nitrogen on coal sample ZC6.
Frenkel-Halsey-Hill (FHH) [14] :
 (16)
(16)
In Equation (16) b and α are the parameters of the FHH theory. In the FHH theory α has a value of 1/3 [15] for Euclidean surfaces. For a fractal surface α ≠ 1/3 [16] .
In the analysis of the experimental data, isotherm Equation (16) is converted to the form:
 (17)
(17)
Figure 3 shows the adsorption isotherm of nitrogen on the coal sample in the coordinates of Equation (17). By analyzing Figure 3 one can determine the parameters of Equation (16) for the adsorption of nitrogen on the coal sample: am = 1.15 ml/g; b = 1.53; α = 0.58. The film of condensate preserves its stability up to the saturation pressure. Such a mechanism of adsorption is characteristic for slit-shaped pores.
Now consider the determination of the fractal dimension of the carbon sample by nitrogen adsorption (Figure 1). BET value was determined as aT = 1.15 ml/g. The adsorption in micropores takes place in the interval 1.15 ml/g < a ≤ 1.84 ml/g, which corresponds to a pressure range of 0.1 < x < 0.6, with x = p/p0.
To determine the value of the fractal dimension from (9), a segment of the experimental isotherm for 0.07 < x < 0.6 is represented in the coordinates:
 with:
with: (18)
(18)
in Figure 4. Here am and a0 are the adsorption values on the left and right boundary, respectively, in the micropore region. The maximum amount of adsorbate in micropores corresponds to the adsorption value on the right boundary in the micropore region.
Having analysed Figure 1, one should pay attention to the following singular
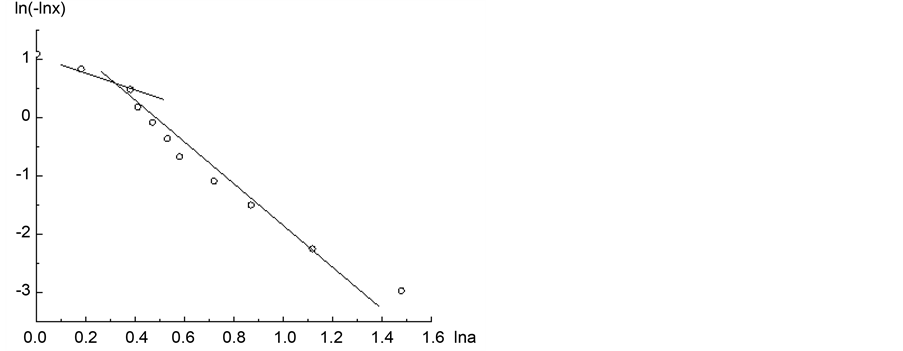
Figure 3. Adsorption isotherm of nitrogen on coal sample ZC6 in the coordinates of Equation (17).
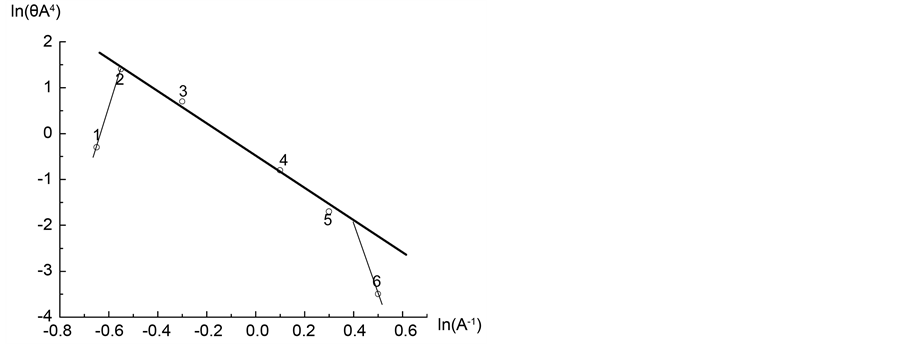
Figure 4. Adsorption isotherm of nitrogen on coal sample ZC6 in the coordinates of Equation (18).
behaviour of the adsorption system with x = 0.1 (the leftmost point (1) in Figure 4) and x = 0.6 (the rightmost point (6) in Figure 4). A straight line is found for the region of 0.1 < x < 0.6, which corresponds to 0.072 < θ ≤ 0.94. The point (θ = 0.072; x = 0.1) is not a point of the straight line, built by Equation (18). Therefore, near x = 0.1, the quantity D takes a negative value, since in a close vicinity of x = 0.1, θ = 0.072 cannot be considered on the basis of the fundamental theory VFM. In this area there is a logarithmic divergent behavior of the adsorption potential energy of the system [14] . For the region (θ > 0.94; x < 0.6) of the isotherm in coordinates of (18) the slope of the straight line is much greater than of the isotherm with a plot interval 0.072 < θ ≤ 0.94. In the vicinity of this point the value of D is greater than 3. Therefore, calculations of the fractal dimension D in the vicinity of θ = 0.07 and θ = 0.94, based on the formalism of TVFM, is incorrect. Thus, the proposed method for calculation of the fractal dimension D, based on the solution of the integral (3) is strictly valid for 0.1 ≤ θ ≤ 0.9. Using formula (9), the value of D is calculated to 2.47.
Now consider the procedure for calculating the value of fractal dimension D from Equation (11). Figure 5 is a plot of the isotherm in the coordinates  . Figure 5 clearly shows that the point with coordinates A2 = 5.26; −lnθ = 2.65 is singular. In the coordinates of the adsorption isotherm, the singular point is defined as θ = 0.07; x = 0.1. For further calculations represent the adsorption isotherm of nitrogen in coal sample ZC6 on microporous region as
 .
.
The line in Figure 6 can well be approximated by the following formula:
 (19)
(19)
Then, using Equations (14) (19), one obtains the following formula for calculating the value l0
 (20)
(20)
It should be noted that formula (6) to determine the value of l* and the formula (14) to determine l0 coincide up to a constant factor.
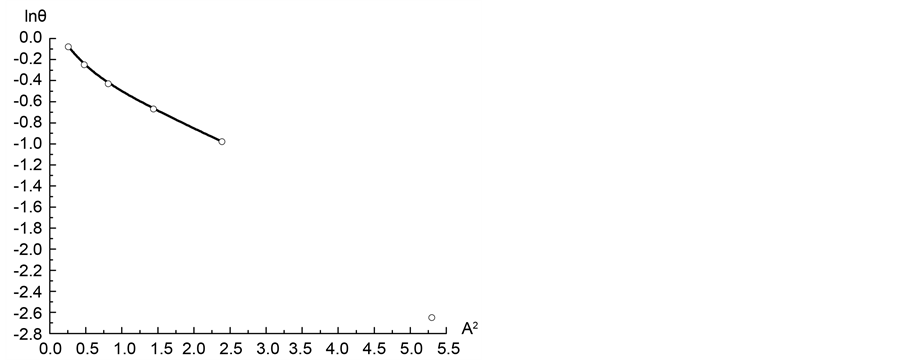
Figure 5. Adsorption isotherm of nitrogen on coal sample ZC6 in the coordinates of Equation (12).
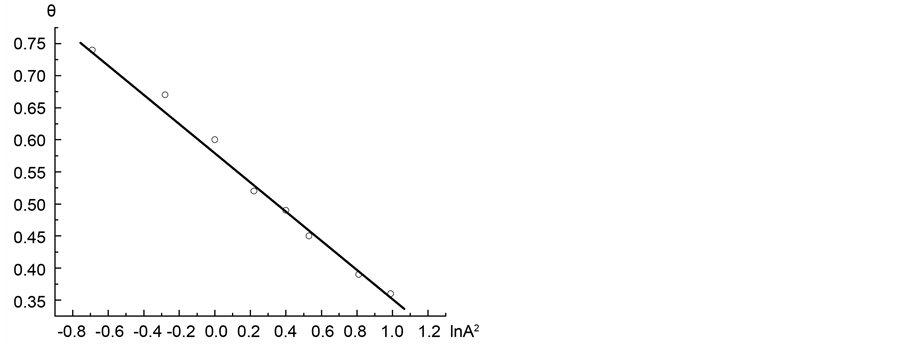
Figure 6. Adsorption isotherm of nitrogen on coal sample ZC6 as microporous θ visa lnA2.
Figure 7 shows a segment of the micropore adsorption isotherm in the coordinates lnθ vs ln(A−1). Then formula 14 determines the value of the fractal dimension to D = 2.37. Likewise, we calculated the value of the fractal dimension D for the remaining three isotherms. Table 1 shows the values of fractal dimensions for the four considered isotherms.
The values of D were derived by two methods: 1) in the framework of a rigorous theory (TVFM), which involves the use of infinite limits in the integral (3); 2) as part of the integral equation for the adsorption isotherm with finite limits of integration. The table shows that the results for the fractal dimension D, calculated by both methods, differ insignificantly. At the same time, the value of the fractal dimension D, calculated by the first method for all four cases is greater than D calculated by the second method. This can be explained by the fact that changes in the limits of integration extend the range of the distribution function , as it was shown by Gauden [17] , too It is important to stress that both methods, proposed in the article, equally determine the behavior of the distribution function and the singular points.
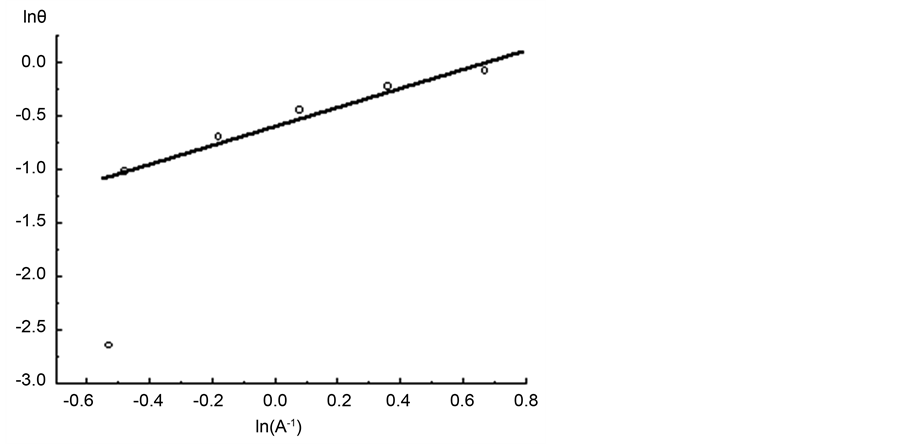
Figure 7. Adsorption isotherm of nitrogen on coal sample ZC6 in the coordinates of Equation (13).

Table 1. Fractal dimensions of the different adsorbents calculated with Equations (9) and (15).
5. Conclusion
Equations derived in this paper permit the estimation of fractal dimension for gas adsorption on microporous solids. These experimental results are interpreted in terms of the filling of micropores and fractal micropore-size distribution. That means that the fractal dimension in this case describes the space filling behavior of the fractal structure or rather the fractal dimension of the pore network. Values for the fractal dimension usually are between 2 and 3 and here mean values are received. Because these equations are obtained on the basis of the Dubinin’s integral equation (Equation (1)), which contains an empirical exponential expression, which describes adsorption in uniform micropores, the calculated quantities depend on the correctness of the Dubinin’s equation.
Cite this paper
Kutarov, V.V., Schieferstein, E., Zub, Y.L. and Robens, E. (2017) Fractal Characteristics of Microporous Adsorbents. Materials Sciences and Applications, 8, 603-613. https://doi.org/10.4236/msa.2017.88042
References
- 1. Dubinin, M.M. and Stoeckli, H.F. (1980) Homogeneous and Heterogeneous Micropore Structures in Carbonaceous Adsorbents. Journal of Colloid and Interface Science, 75, 34-42.
https://doi.org/10.1016/0021-9797(80)90346-X - 2. Dubinin, M.M. (1985) Generalization of the Theory of Volume Filling of Micropores to Nonhomogeneous Microporous Structures. Carbon, 23, 373-380.
https://doi.org/10.1016/0008-6223(85)90029-6 - 3. Stoeckli, H.F. (1977) A Generalization of the Dubin-in-Radushkevich Equation for the Filling of Heterogeneous Micropore Systems. Journal of Colloid and Interface Science, 50, 184-185.
https://doi.org/10.1016/0021-9797(77)90355-1 - 4. Horvath, G. and Kavazoe, K. (1983) Method for the Calculation of the Effective Pore Size Distribution in Molecular Sieve Carbon. Journal of Chemical Engineering of Japan, 16, 470-475.
https://doi.org/10.1252/jcej.16.470 - 5. Ustinov, E.A. and Do, D.D. (2004) Application of Density Functional Theory to Analysis of Energetic Heterogeneity and Pore Size Distribution of Activated Carbons. Langmuir, 20, 3791-3797.
https://doi.org/10.1021/la035936a - 6. Jaroniec, M., Lu, X., et al. (1990) Thermodynamics of Gas Adsorption on Fractal Surfaces of Heterogeneous Microporous Solids. The Journal of Chemical Physics, 92, 7589-7595.
https://doi.org/10.1063/1.458196 - 7. Kubo, R. (1965) Statistical Mechanics. North-Holland Physics Publishing, Amsterdam.
- 8. Korn, G.A. and Korn, T.M. (1961) Mathematical Handbook for Scientists and Engineers. Mc Gram-Hill Book Company, JWC, New York, 710.
- 9. Yao, Y.B., Liu, D.M., Tang, D.Z., Tang, S.H. and Huang, W.H. (2008) Fractal Characterization of Adsorption-Pores of Coals from North China: An Investigation on CH4 Adsorption Capacity of Coals. International Journal of Coal Geology, 73, 27-42.
https://doi.org/10.1016/j.coal.2007.07.003 - 10. Kuchma, O.V., Yu, L., Zub, A. and Dabrowski (2006) Theoretical and Experimental Studies of Interfacial Phenomena and Their Technological Applications. Proc. X Ukrainian-Polish Symposium, Lviv, 26-30 September 2006, 187.
- 11. Robens, E., Bischoff, A., Schreiber, A., Dabrowski, A. and Unger, K.K. (2207) Investigation of Surface Properties of Lunar Regolith: Part I. Applied Surface Science, 253, 5709-5714.
https://doi.org/10.1016/j.apsusc.2006.12.098 - 12. Robens, E., Bischoff, A., Schreiber, A. and Unger, K.K. (2008) Investigation of Surface Properties of Lunar Regolith: Part III. Journal of Thermal Analysis and Calorimetry, 94, 627-631.
https://doi.org/10.1007/s10973-008-9352-0 - 13. Kutarov, V.V., Robens, E. and Jayaweera, S.A.A. (2013) Characterization of the Microstructure of Rice Starch. Adsorption Science and Technology, 31, 859867.
https://doi.org/10.1260/0263-6174.31.10.859 - 14. Gregg, S. and Sing, K.S.W. (1982) Adsorption, Surface Area and Porosity. Academic Press, New York.
- 15. Hill, T.L. (1949) Physical Adsorption on Non-Uniform Surfaces. Journal of Chemical Physics, 17, 106.
https://doi.org/10.1063/1.1747042 - 16. Halsey, G. (1951) A New Multilayer Isotherm Equation with Reference to Surface Area. Journal of the American Chemistry Society, 73, 2693-2696.
https://doi.org/10.1021/ja01150a076 - 17. Gauden, P.A., Terzyk, A.P. and Rychlicki, G. (2001) The New Correlation between Microporosity of Strictly Microporous Activated Carbons and Fractal Dimension on the Basis of the Polanyi-Dubinin Theory of Adsorption. Carbon, 39, 267-278.
https://doi.org/10.1016/S0008-6223(00)00122-6