Materials Sciences and Applications
Vol.06 No.08(2015), Article ID:58555,10 pages
10.4236/msa.2015.68073
Effects of Mechanical Fibrillation on Cellulose Reinforced Poly(Ethylene Oxide)
Tshwafo E. Motaung*, Teboho C. Mokhena
CSIR Materials Science and Manufacturing, Polymers and Composites Competence Area, Nonwovens and Composites Research Group, Port Elizabeth, South Africa
Email: *temotaung@csir.co.za
Copyright © 2015 by authors and Scientific Research Publishing Inc.
This work is licensed under the Creative Commons Attribution International License (CC BY).
http://creativecommons.org/licenses/by/4.0/


Received 15 May 2015; accepted 31 July 2015; published 4 August 2015
ABSTRACT
The objective of this work was to extract sugar bagasse cellulose nanofibres by using three different processes, namely: mechanical fibrillation, bleaching and mild acid hydrolysis. Cellulose nano- fibres with diameters in the nano range and estimated lengths of several micrometers were obtained from SB. Fourier transform-infrared (FTIR) spectroscopy analysis confirmed the removal of hemicellulose and lignin components by alkali/bleaching and acid hydrolysis. XRD results showed an increase in crystalline which resulted from the removal of lignin and hemicellulose, especially after mercerization and mild acid hydrolysis. Moreover, the extracted cellulose nanofibres were used to reinforce poly(ethylene oxide) (PEO). PEO was dissolved in water and mixing with the cellulose nanofibres suspension followed by casting. The nanocomposites were characterized by using FTIR analysis, thermogravimetric analysis, X-Ray diffractometry and tensile tester. The thermal stability of the nanocomposites was enhanced depending on the treatment of the SB fibres.
Keywords:
Biomaterials, Biopolymers & Renewable Polymers, Cellulose and Other Wood Products, Biocompatibility

1. Introduction
In the past years, cellulose nanofibres (CNF) garnered much interest as one of the reinforcements of various polymeric materials. This resulted from their unique and attractive properties such as biodegradability, biocompatibility, renewability, abundance, high aspect ratio and light weight [1] . Cellulose nanofibers can be extracted from variety of cellulose-containing sources like jute, flax, ramie, and hemp and by-products of agricultural crops via various methods. It is web-like network of cellulose fibrils composed of the amorphous and crystalline domains [2] [3] . Generally, there are two processing routes adopted to extract cellulose nanofibres from various sources, namely: mechanical and chemical routes [4] [5] . These treatments may be used individually or in combination depending on the quality and dimensions of the product.
The focus of this work is to extract cellulose nanofibres from sugarcane bagasse and its application in the preparation of poly(ethylene oxide)-based nanocomposites films. PEO is the most used synthetic polymer owing to its biocompatibility, non-toxicity and biodegradability [6] . It has been extensively used as a coating material to generate surfaces that resist non-specific protein adsorption and medical applications. PEO was used in this study due to its versatile applications and solubility in water to aid in the dispersion of the cellulose nanofibres extracted using three different processing methods (SuperMassColloider, mercerization, and mild acid hydrolysis).
Very few studies have reported the cellulose nanofibre materials from sugar bagasse residues [7] [8] . Sugar bagasse fibres are sugarcane industry byproduct left after the juice extraction. In South Africa about 22 million tons of sugarcane per year is milled, producing a waste of about 3.3 million tons of dry sugar bagasse fibres [9] [10] . These dry fibres are usually used to produce furfural, pulp and paper with a quite significant amount remaining. The remaining amount is often dumped or burned. Nevertheless, sugar bagasse is one of the attractive cellulose nanofibre sources since it contains higher content of cellulose (44.9% - 45%). In this study, cellulose nanofibres are extracted from sugar bagasse by SuperMassColloider, mercerization, bleaching and mild acid hydrolysis, respectively. There are no studies based on the comparison of the SB nanofibres reinforced nanocomposites from different procedures.
Therefore, the main objective of this work was to extract cellulose nanofibres by using different processing procedures, namely: mechanical fibrillation, bleaching and acid hydrolysis, and to prepare PEO/SB cellulose nanofibres composite films. The extracted cellulose nanofibres were characterized by SEM, XRD, FTIR and thermogravimetric (TGA) analysis and the properties of the nanocomposites were established by FTIR analysis, thermogravimetric (TGA) analysis, X-Ray diffractometry (XRD) and tensile tester.
2. Experiments
2.1. Materials and Methods
99.9% NaOH pellets, 98% NaClO2, 85% KOH and 98% H2SO4 were obtained from Minema, South Africa. Sugar cane bagasse (SB) was supplied by a farm in Craddock near Port Elizabeth, South Africa. PEO in powder form with Mv of 2000 KDa was supplied by Sigma Aldrich, South Africa.
2.2. Mechanical Fibrillation
The SB fibre were ground into powder and passed through 1 mm sieve. Subsequently, the fibres were soaked in distilled water for 24 hours for hydration to ensure the swelling of the fibre cell wall. The soaked SB fibres were then passed continuously up to 500 times (SB500) through SuperMassColloider (SMC). The SMC consists of two stone grinding disks rotating at 2500 rpm and the gap disks were set at approximately 100 µm. A zero gap was determined right at the contact position before loading SB.
2.3. Bleaching of Fibres
The fibres were soaked in distilled water and followed by SMC treatment for 500 times. Meanwhile, the fibres were dried in oven for 24 hours at 50˚C and then treated with 2wt% NaOH, 2wt% NaClO2 and 2wt% KOH, respectively, for 1 hour at 80˚C. Each treatment was repeated two times with filtering and rinsing with distilled water until neutral pH was achieved. The fibres were then oven dried at 40˚C for 48 hrs before acid hydrolysis.
2.4. Acid Hydrolysis
The alkali treated SB fibres were further subjected to a mild acid hydrolysis. A diluted sulphuric acid (50%) was used for acid hydrolysis under strong mechanical stirring for 30 min at 40˚C. The reaction was stopped by adding distilled water into the suspension. Subsequent washing by successive centrifugation at 10˚C and 5000 rpm for 30 min, followed by dialysis against distilled water to achieve neutral pH.
2.5. Preparation of the PEO Composites
The composites of PEO (poly(ethylene oxide)) and fibres were prepared by adding the solution suspensions of fibres (5 wt%) to a PEO solution dissolved in distilled water under vigorous mechanical stirring for 4 hours at room temperature and subsequent sonication for 10 min for better dispersion. The mixture was then poured in a petri dish and dried in a desiccator for a week for complete water evaporation.
2.6. Characterization Techniques
Chemical compositions of the SB fibres were determined according TAPPI standards, Lignin and cellulose (TAPPI-T222 om-88), and hemicellulose (TAPPI T19m-54).
2.7. Scanning Electron Microscopy (SEM)
The micrographs of the SB fibres and PEO composites were taken by FESEM. The samples were fractured and sputter-coated with gold before the micrographs were taken. The SEM micrographs were taken using an FEI Quanta 200 (FEI Co., Eindhoven, the Netherlands) electron microscope operated at an accelerating voltage of 20 kV.
2.8. X-Ray Diffraction Technique (XRD)
X-Ray diffraction data was collected on a Phillips PW 1830 X-ray diffractometer, at scanning rate of 0.5 using CuKα radiation with a wavelength of 1.54 Armstrong. The diffraction intensities were recorded 2θ range between 2 and 80˚.
2.9. Fourier Transform-Infrared Spectroscopy (FTIR)
FTIR data of SB fibres, and PEO composite films was obtained using a Perkin Elmer Spectrum 100 FTIR spectrometer fitted with a PIKE MiracleTM ATR. A minimum of 32 scans were collected at a resolution of 4 cm−1.
2.10. Thermogravimetric Analysis (TGA)
TGA results were collected on Perkin Elmer Pyris 1 TGA thermogravimetricanalyzer at a heating rate of 10˚C min−1. Samples in the range of 5 and 10 mg were heated from 25˚C to 600˚C under nitrogen flow at 20 ml∙min−1.
2.11. Tensile Properties
Tensile testing was carried out using an Instron tensile tester at a crosshead speed of 10 mm∙min−1. The samples were prepared by cutting the rectangular strips from the films with the width of 0.5 mm. The total number of 5 samples was used with their average values reported.
3. Results and Discussion
3.1. Chemical Compositions of Sugar Cane Bagasse
The chemical composition of the SB fibres at different treatment stages obtained by TAPPI standard methods are depicted in Table 1. Cellulosic fibres consist of mostly cellulose, hemicelluloses and lignin. Hemicellulose and lignin serve as the cementing layer of cellulose microfibrils. The foremost step to obtain cellulose nanofibres is to remove both lignin and hemicelluloses. In Table 1, the untreated raw sugar cane bagasse (SB) displayed a high percentage of cellulose (~50%) and hemicellulose (~49%), with low content of lignin (~3%). The mechanical treatment with SMC for 500 times (SMC500) resulted in a slight decrease in lignin and hemicellulose, exposing more cellulose (54%). Upon bleaching, hemicellulose and lignin dissolve leaving behind highly crystalline cellulose. It is recognized that the alkali treatment solubilize hemicellulose and lignin, whereas bleaching removes mostly lignin. In general, the cellulose content increased following the order of treatments

Table 1. Fractions of principal constituents of sugar cane bagasse before and after treatments.
from SMC to the mild acid hydrolysis. Moreover the hemicellulose and lignin content decreased following these treatments. This can clearly be seen after acid hydrolysis, the cellulose content increased from 50% to 97%, and decreased in lignin content from 49% to 2%. It is clear that the mechanical treatment serves as useful mechanism for defibrillation of fibre bundles and as a result exposing most of the fibre constituents for other treatments.
3.2. Scanning Electron Microscopy (SEM)
The SEM micrographs of sugar cane bagasse (SB) and the 500 times treated SB with SMC (SB500) are shown in Figure 1. Figure 1(a) and Figure 1(b) revealed small lumps on the surface of the SB fibres which can be related to the presence non-cellulosic components (hemicellulose, lignin and extractives) [11] . The mechanical defibrillation of the fibres resulted in reduction of the fibres size (Figure 1(c) and Figure 1(d)). This is as a result of mechanical shears associated with SMC set at a minimum gallery breaking the cementing materials, primarily lignin and hemicelluloses, on the surface of the fibres. It can be seen that the defibrillation reduced the size of the fibres to the few thousands of nanometre, but the fibers were fibrillated only at the surface in Figure 1(d). The bleached fibres are represented in Figure 2. The alkali and bleaching treatments further reduced the size of the fibres with a considerable defibrillation of the fibres (Figure 2(a) and Figure 2(b)). The fibres appeared as agglomerated with a leaf like-shape due to the treatment partially removing the remaining non-cellulosic components. Acid hydrolysis is known to dissolve the amorphous regions of the fibres depending on the acid concentration, time and temperature [12] [13] . In this study, mild acid hydrolysis conditions were utilized to evaluate the impact of SMC to produce nanocellulose. After acid hydrolysis, there was a quite size reduction of fibres of the compared to the bleached and other treatments (Figure 2(c) and Figure 2(d)). The fibres appeared as agglomerated nanofibrils with the size ranging from few nanometers to several microns. This can be related to the partial removal of the amorphous regions by acid hydrolysis exposing more cellulosic regions as confirmed by chemical analysis [12] .
3.3. X-Ray Diffraction (XRD)
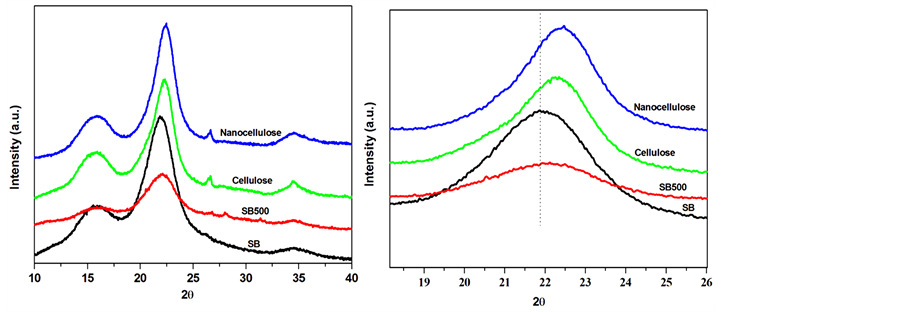
The XRD patterns of SB and treated sugar cane bagasse fibres are shown in Figure 3(a) and Figure 3(b). All investigated samples displayed two characteristic peaks of the natural fibres at about 2θ = 15˚, 23˚ attributed to the (110) and (002) reflections, respectively [14] [15] . There is no doublet at 2θ = 22.6˚ which confirms that the SB fibres belong to the cellulose type I [15] . The intensity of the peak at 2θ = 22.6˚ becomes more intense upon the chemical treatments whereas it decreased for the mechanical fibrillated fibres. This could be attributed to the effect of each treatment on the crystallinity of the material. To confirm this effect, two different methods were used to calculate the crystallinity index (CI) of the SB fibres [16] [17] . The first method is XRD peak height method where CI was calculated from the height of the maximum peak and the height of the minimum peak. The second method consists of crystallinity being determined using XRD deconvolution method. This is done by taking the amorphous and crystalline contribution to the diffraction intensity. It can be seen that the crystallinity was decreased after SMC treatment, whereas the bleaching and hydrolysis increased the crystallinity (Table 2). This underpinned the fact that the SMC breaks most of the amorphous regions leaving behind highly crystalline cellulose. To further evaluate the structural changes imposed by these treatments the mean size of the cellulose crystallite domains (D) was established by Scherer equation [18] :

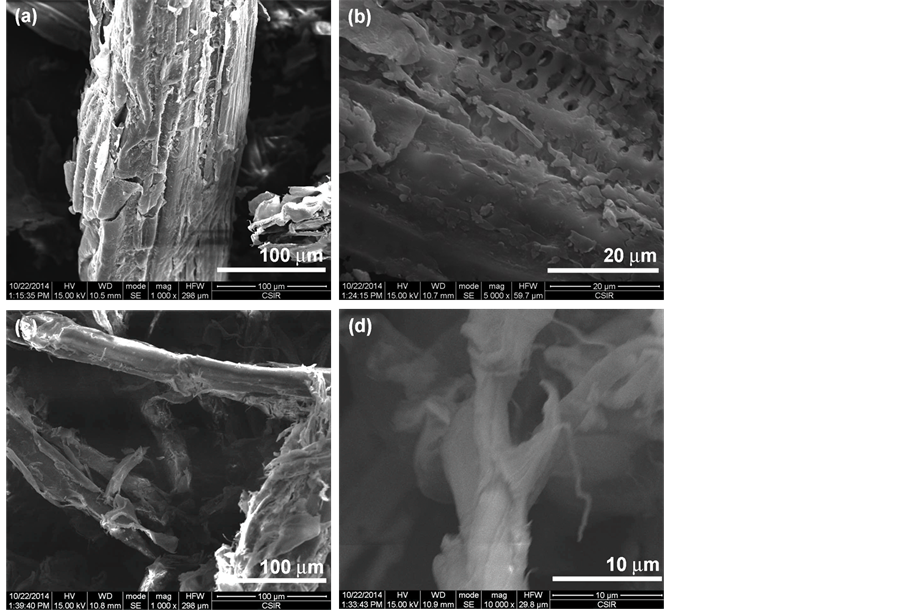
Figure 1. SEM images of untreated sugar bagasse (a) (b), and 500 times SMC treated SB (c) (d).
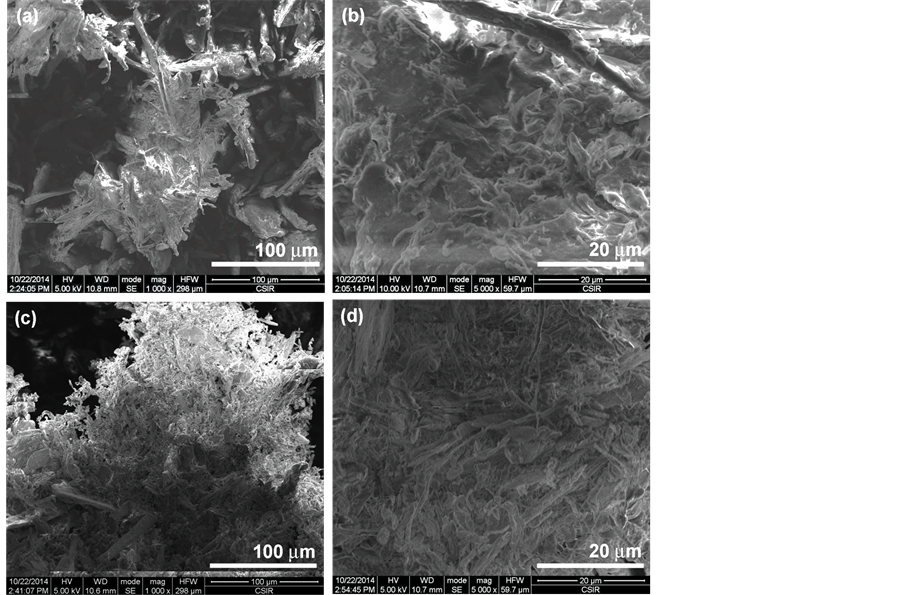
Figure 2. SEM images of bleached SB (a) (b) and hydrolyzed SB (c) (d).
 (a) (b)
Figure 3. XRD spectra of SB, SB500, cellulose and nanocellulose fibres.
Table 2. Crystallinity index (%) of raw, alkali and acid treated sugar cane bagasse.
aCrystallinity index determined by XRD deconvolution method; bCrystallinity index determined by XRD peak height method.
where k is the shape factor whose value can be approximated to be 0.89, β is the line width in radians at half maximum intensity of the reflection (002), 𝜆 is the wavelength of the radiation used 1.54 and θ is the Bragg angle of reflection (002). The crystallite sizes were 3.3, 3.1, 4.0 and 4.3 nm for the SB, SB 500, cellulose and nanocellulose, respectively. Similar results were reported by Zhao et al. [19] using ball milling on cellulose pulp. They, however, ascribed their observations to a reduction of long range order. Moreover, Avolio et al. [18] also found similar results after the ball milling treatment without a clear explanation. In Figure 3(b), the diffraction peak (002) at approximately 2θ = 22˚ shift to higher angles with an order of treatments, suggesting a decrease in lattice parameters attributed to the elimination of defects. It seems as if the SMC and removal of hemicellulose and lignin reduce long range order that led to a decrease in the lattice parameters [19] .
In all nanocomposites XRD profiles there is well-defined crystalline peaks around 2θ = 19˚, and 23˚ (Figure 4). These intense diffraction peaks around 19 and 23˚ can be assigned to characteristic (120) and (112/004) reflections of PEO (Zhou, Chu, Wu & Wu, 2011). The crystallinity indices of the composites calculated with similar methods as the SB fibres are illustrated in Table 3. In both methods, the crystallinity index values (CI) increased by addition of the SB fibres, except for the PEO/untreated SB based composite. Islam et al. [20] found the similar observation when studying the influence of alkali treatment on the interfacial and physico-mechanic- cal properties of industrial hemp fibre reinforced polylactic acid composites. The observation was attributed to the presence of a large content of lignin which negatively influenced the nucleating ability of the raw fibres. In the current study, it seems as though both lignin content and particles size played an important role on the crystallinity, hence PEO/SB SMC500 rendered an improved crystallinity compared to PEO/SB. In the case of bleached and hydrolysed nanofibres based composites the removal of lignin and hemicellulose obviously promoted trans-crystallization of the polymer chains [21] .
3.4. Fourier Transform Infrared Spectroscopy (FTIR)
In order to understand the changes in chemical structures of the SB at various stage of the treatments infrared spectra analysis were carried out (Figure 5(a) and Figure 5(b)). As discussed in XRD results, SB is composed of cellulose, hemicellulose and small content of lignin. The SB fibres displayed the characteristic bands at 3400,
![]()
Figure 4. X-ray diffraction spectra of PEO, PEO/SB, PEO/ SB500, PEO/cellulose and PEO/nanocellulose composites.
![]() (a) (b)
(a) (b)
Figure 5. FTIR spectra of untreated SB, SB500, cellulose and nanocellulose fibres.
Table 3. Crystallinity index (%) PEO and PEO composites.
aCrystallinity index determined by XRD deconvolution method. bCrystallinity index determined by XRD peak height method.
2920 cm−1 and 1051 cm−1 for O-H stretching, vibration of OCH3 and OH stretching of primary alcohol. The other bands at 1728, 1510, 1426 and 1252 cm−1 attributed to C=O stretching, phenyl vibrations, C-H aliphatic axial deformation and C-O stretching of phenols consecutively [22] . The peaks at 1252, 1510 and 1728 cm−1 corresponding to the phenyl vibrations and carbonyl group associated with the presence of lignin and hemicellulose in the SB fibres. After the mechanical treatment with SMC for 500 times (SB500) the intensities of these bands (similar to the untreated SB) were significantly increased. These can be related to the defibrillation of the fibres and perhaps an exposure of mainly cellulose. In the case of the alkali/bleached SB fibres, the bands related to the phenyl group disappeared confirming the removal of lignin and hemicellulose as depicted by chemical composition analysis. Acid hydrolysed fibres displayed similar bands as alkali/bleached fibres. This can be related to similar chemical compositions of the resulting fibres after these treatments. It can clearly be seen that the resulting crystalline cellulose fibrils (nanocellulose) band around 1000 and 3400 cm−1 due to the isolated cellulose component. These bands could be associated with glucose units (with three additional hydroxyl groups) exposed on the cellulose backbone structure.
PEO displayed the characteristic peaks at 2984, 1336, 1097, 958, and 840 cm−1 related to CH stretching, CH2 wagging, C-O-C stretching, CH2 rocking and twisting, and C-O-C bending, respectively (Figure 6) [23] . The OH stretching absorption was negligible due to high molecular weight PEO used in this study [23] . Similar peaks were depicted in the case of the all investigated composite samples. Because the content of the SB fibres was too small compared to the high molecular weight PEO, there was no clear peak absorptions related to the SB nanofibres from various treatment stages.
3.5. Thermogravimetric Analysis (TGA)
Thermogravimetric analysis and differential thermogravimetry curves (DTG) of the untreated SB, SB500, cellulose and nanocellulose are shown in Figure 7(a) and Figure 7(b), respectively. The SB and SB500 revealed two degradation steps around 380˚C and 470˚C as confirmed by DTG curves. These steps clearly indicate that the SB and SB treated by SMC 500 times composed of various components which degrade at different temperatures. The first degradation step is ascribed to a partial degradation of lignin and thermal depolymerisation of the
![]() (a) (b)
(a) (b)
Figure 6. FTIR spectra of PEO, 95/5 w/w of PEO/SB, PEO/SB500, PEO/cellulose and PEO/ nanocellulose composites.
![]() (a) (b)
(a) (b)
Figure 7. TGA and DTG profiles of untreated SB, SB500, cellulose and nanocellulose fibres.
hemicellulose, while the second step is attributed to the degradation of cellulose and the remaining lignin [24] . The alkali/bleached (cellulose) and hydrolysed fibres (nanocellulose) showed a single degradation step around 470˚C. The single degradation step of the bleached (cellulose) and hydrolysed (nanocellulose) SB fibres confirms the removal of cementing layer (lignin, hemicellulose and extractives), which agrees with FTIR and XRD results. The cellulose showed a significant increase in the thermal stability contrary to nanocellulose. The increase in thermal stability of cellulose could be related to the removal of lignin and hemicellulose while the decrease in thermal stability of nanocellulose could possibly be due to either catalysis introduced by sulphate groups or the size of the fibres [25] [26] . It is recognized that acid hydrolysis via sulphuric acid introduces large number of sulphates ions on the surface of the nanofibrils, and the removal of these ions requires less energy compared to the hydroxyl groups [7] . This results in a decrease in thermal stability of the hydrolysed nanofibres. Moreover, smaller particles result to a large number of free end chains where the decomposition easily occur [25] [26] .
All the treated SB fibres based composite samples showed a single degradation step at temperature around 400˚C, Figure 8(a), which is associated with the polymer segments volatilization due to chain scission of the backbone. The untreated SB based composites displayed low thermal stability than pure PEO and other composite samples. In the case of treated fibres (SMC, bleaching and acid hydrolysis), there is an increase in thermal stability (clearly seen in DTG curve Figure 8(b)) due to the thermally stable fibres reducing the chains mobility and inhibiting the chain scission during the degradation process. The fibres may inhibit the flow of the thermal labile free radicals during the propagation of the degradation processing protecting the polymer to degrade at higher temperatures. However, the low thermal stability of untreated SB fibres based composites may be due to the presence of a large content of thermally unstable hemicelluloses which catalysis the degradation processes of the polymer [7] .
3.6. Tensile Properties
The tensile properties of the composites depend on the orientation of the filler, content and size as well as the interaction between filler and polymer matrix (Fu, Feng, Lauke & Mai, 2008). The tensile properties of the PEO and PEO composites are shown in Table 4. The higher modulus of SB, SB500 and celluloses resulted in im
![]() (a) (b)
(a) (b)
Figure 8. TGA and DTG profiles of PEO, 95/5 w/w of PEO/SB, PEO/SB500, PEO/cellulose and PEO/nanocellulose composites.
Table 4. The tensile properties of PEO and PEO composite samples.
proved Young’s modulus (E) of composites than PEO. It can be seen that the tensile strength (δt) of the composites increased slightly compared to the pure PEO. As mentioned, the tensile properties of the composite depend on several factors such as the type, size, concentration, shape and orientation of the filler that cannot be singled out [27] [28] . These factors are further influenced by interaction between the polymer matrix and the filler as well as the dispersion and the amount of particle agglomeration [27] [28] . Tensile strength was increased whereas elongation at break (εb) decreased, which may be attributed to a better stress transfer between the matrix and the filler as a result of good interaction.
4. Conclusion
SMC successfully separated and exposed the fibres constituents making it easier for bleaching and hydrolysis treatments to remove lignin, hemicellulose and other extractives. Furthermore, SMC reduced crystallinity and partially increased the thermal stability. SEM indicated continuous decrease in particle sizes following an order of treatments. Bleaching increased both thermal stability and crystallinity while hydrolysis reduced thermally stability significantly. This was due to the introduction of the sulphates ions on the surface of the fibres which comprised the thermally stability of the fibres. It was clear that the modification of SB could render improvement in some properties of some polymer matrices given the current environmental crisis and economy. The SB fibres extracted through different treatments were successfully incorporated in PEO via solution casting. XRD confirmed that the fillers did affect the crystallization behaviour of PEO after the treatment of the fibres. The thermal stability of the PEO was improved depending on the treatment of the SB fibres. The tensile strength and Young’s modulus were improved regardless of the treatment of the SB fibres. This resulted from a good interaction between the polymer and filler as well as the stiffness of the filler.
Acknowledgements
This paper forms part of a research project, “Greener Cities in South Africa”, funded by the Green Fund, an environmental finance mechanism implemented by the Development Bank of Southern Africa (DBSA) on behalf of the Department of Environmental Affairs (DEA) and CSIR/YREF. Opinions expressed and conclusions arrived at, are those of the author and are not necessarily to be attributed to the Green Fund, DBSA or DEA.
Cite this paper
Tshwafo E.Motaung,Teboho C.Mokhena, (2015) Effects of Mechanical Fibrillation on Cellulose Reinforced Poly(Ethylene Oxide). Materials Sciences and Applications,06,713-723. doi: 10.4236/msa.2015.68073
References
- 1. Oun, A.A. and Rhim, J.-W. (2015) Preparation and Characterization of Sodium Carboxymethyl Cellulose/Cotton Linter Cellulose Nanofibril Composite Films. Carbohydrate Polymers, 127, 101-109.
http://dx.doi.org/10.1016/j.carbpol.2015.03.073 - 2. Azizi Samir, M.A.S., Alloinand, F. and Dufresne, A. (2005) Review of Recent Research into Cellulosic Whiskers, Their Properties and Their Application in Nanocomposite Field. Biomacromolecules, 6, 612-626.
http://dx.doi.org/10.1021/bm0493685 - 3. Tonoli, G.H.D., Teixeira, E.M., Corrêa, A.C., Marconcini, J.M., Caixeta, L.A., Pereira-da-Silvaand, M.A. and Mattoso, L.H.C. (2012) Cellulose Micro/Nanofibres from Eucalyptus Kraft Pulp: Preparation and Properties. Carbohydrate Polymers, 89, 80-88.
http://dx.doi.org/10.1016/j.carbpol.2012.02.052 - 4. Mtibe, A., Linganiso, L.Z., Mathew, A.P., Oksman, K., Johnand, M.J. and Anandjiwala, R.D. (2015) A Comparative Study on Properties of Micro and Nanopapers Produced from Cellulose and Cellulose Nanofibres. Carbohydrate Poly-mers, 118, 1-8.
http://dx.doi.org/10.1016/j.carbpol.2014.10.007 - 5. Spence, K.L., Venditti, R.A., Rojas, O.J., Habibi, Y. and Pawlak, J.J. (2011) A Comparative Study of Energy Consumption and Physical Properties of Microfibrillated Cellulose Produced by Different Processing Methods. Cellulose, 18, 1097-1111.
http://dx.doi.org/10.1007/s10570-011-9533-z - 6. Zhou, C.J., Chu, R., Wu, R. and Wu, Q.L. (2011) Electrospun Polyethylene Oxide/Cellulose Nanocrystal Composite Nanofibrous Mats with Homogeneous and Heterogeneous Microstructures. Biomacromolecules, 12, 2617-2625.
http://dx.doi.org/10.1021/bm200401p - 7. Mandaland, A. and Chakrabarty, D. (2011) Isolation of Nanocellulose from Waste Sugarcane Bagasse (SCB) and Its Characterization. Carbohydrate Polymers, 86, 1291-1299.
http://dx.doi.org/10.1016/j.carbpol.2011.06.030 - 8. Li, J., Wei, X., Wang, Q., Chen, J., Chang, G., Kong, L., Suand, J. and Liu, Y. (2012) Homogeneous Isolation of Nanocellulose from Sugarcane Bagasse by High Pressure Homogenization. Carbohydrate Polymers, 90, 1609-1613.
http://dx.doi.org/10.1016/j.carbpol.2012.07.038 - 9. Hugo, T.J. (2010) Pyrolysis of Sugarcane Bagasse. Thesis, University of Stellenbosch, Stellenbosch.
- 10. Devnarain, P., Arnold, D. and Davis, S. (2002) Production of Activated Carbon from South African Sugarcane Bagasse. Proceedings of South African Sugar Technology Association, Vol. 76, 477-489.
- 11. Cerqueira, E.F., Baptista, C.A.R.P. and Mulinari, D.R. (2011) Mechanical Behaviour of Polypropylene Reinforced Sugarcane Bagasse Fibers Composites. Procedia Engineering, 10, 2046-2051.
http://dx.doi.org/10.1016/j.proeng.2011.04.339 - 12. Habibi, Y., Lucia, L.A. and Rojas, O.J. (2010) Cellulose Nanocrystals: Chemistry, Self-Assembly, and Applications. Chemical reviews, 110, 3479-3500.
http://dx.doi.org/10.1021/cr900339w - 13. Chen, Y., Liu, C., Chang, P.R., Cao, X. and Anderson, D.P. (2009) Bionanocomposites Based on Pea Starch and Cellulose Nanowhiskers Hydrolyzed from Pea Hull Fibre: Effect of Hydrolysis Time. Carbohydrate Polymers, 75, 607-615.
http://dx.doi.org/10.1016/j.carbpol.2008.11.030 - 14. Ten, E., Bahr, D.F., Li, B., Jiang, L. and Wolcott, M.P. (2012) Effects of Cellulose Nanowhiskers on Mechanical, Dielectric, and Rheological Properties of Poly(3-hydroxybutyrate-co-3-hydroxyvalerate)/Cellulose Nanowhisker Composites. Industrial & Engineering Chemistry Research, 51, 2941-2951.
http://dx.doi.org/10.1021/ie2023367 - 15. Ten, E., Jiang, L. and Wolcott, M.P. (2012) Crystallization kinetics of poly(3-hydroxybutyrate-co-3-hydroxyvalerate)/ cellulose nanowhiskers composites. Carbohydrate Polymers, 90, 541-550.
http://dx.doi.org/10.1016/j.carbpol.2012.05.076 - 16. French, A.D. and Cintrón, M.S. (2013) Cellulose Polymorphy, Crystallite size, and the Segal Crystallinity Index. Cellulose, 20, 583-588.
http://dx.doi.org/10.1007/s10570-012-9833-y - 17. Park, S., Baker, J.O., Himmel, M.E., Parilla, P.A. and Johnson, D.K. (2010) Cellulose Crystallinity Index: Measurement Techniques and Their Impact on Interpreting Cellulase Performance. Biotechnology for Biofuels, 3, 10.
http://dx.doi.org/10.1186/1754-6834-3-10 - 18. Avolio, R., Bonadies, I., Capitani, D., Errico, M., Gentileand, G. and Avella, M. (2012) A Multitechnique Approach to Assess the Effect of Ball Milling on Cellulose. Carbohydrate Polymers, 87, 265-273.
http://dx.doi.org/10.1016/j.carbpol.2011.07.047 - 19. Zhao, H., Kwak, J.H., Wang, Y., Franz, J.A., White, J.M. and Holladay, J.E. (2006) Effects of Crystallinity on Dilute Acid Hydrolysis of Cellulose by Cellulose Ball-Milling Study. Energy & Fuels, 20, 807-811.
http://dx.doi.org/10.1021/ef050319a - 20. Islam, M.S., Pickering, K.L. and Foreman, N.J. (2010) Influence of Alkali Treatment on the Interfacial and Physico-Mechanical Properties of Industrial Hemp Fibre Reinforced Polylactic Acid Composites. Composites Part A: Applied Science and Manufacturing, 41, 596-603.
http://dx.doi.org/10.1016/j.compositesa.2010.01.006 - 21. Lezak, E., Kulinski, Z., Masirek, R., Piorkowska, E., Pracella M. and Gadzinowska, K. (2008) Mechanical and Thermal Properties of Green Polylactide Composites with Natural Fillers. Macromolecular Bioscience, 8, 1190-1200.
http://dx.doi.org/10.1002/mabi.200800040 - 22. Halász, K. and Csóka, L. (2013) Plasticized Biodegradable Poly(lactic acid) Based Composites Containing Cellulose in Micro- and Nanosize. Journal of Engineering, 2012, Article ID: 329379.
- 23. Pucić, I. and Jurkin, T. (2012) FTIR Assessment of Poly(ethylene oxide) Irradiated in Solid State, Melt and Aqeuous Solution. Radiation Physics and Chemistry, 81, 1426-1429.
http://dx.doi.org/10.1016/j.radphyschem.2011.12.005 - 24. Abraham, E., Deepa, B., Pothen, L.A., Cintil, J., Thomas, S., John, M.J., Anandjiwala, R. and Narine, S.S. (2013) Environmental Friendly Method for the Extraction of Coir Fibre and Isolation of Nanofibre. Carbohydrate Polymers, 92, 1477-1483.
http://dx.doi.org/10.1016/j.carbpol.2012.10.056 - 25. Kumar, A., Negi, Y.S., Choudhary, V. and Bhardwaj, N.K. (2014) Characterization of Cellulose Nanocrystals Produced by Acid-Hydrolysis from Sugarcane Bagasse as Agro-Waste. Journal of Materials Physics and Chemistry, 2, 1-8.
- 26. Wang, N., Ding, E. and Cheng, R. (2007) Thermal Degradation Behaviors of Spherical Cellulose Nanocrystals with Sulfate Groups. Polymer, 48, 3486-3493.
http://dx.doi.org/10.1016/j.polymer.2007.03.062 - 27. Fu, S.-Y. Feng, X.-Q., Lauke, B. and Mai, Y.-W. (2008) Effects of Particle Size, Particle/Matrix Interface Adhesion and Particle Loading on Mechanical Properties of Particulate-Polymer. Composites Part B: Engineering, 39, 933-961.
http://dx.doi.org/10.1016/j.compositesb.2008.01.002 - 28. Radford, K. (1971) The Mechanical Properties of an Epoxy Resin with a Second Phase Dispersion. Journal of Materials Science, 6, 1286-1291.
http://dx.doi.org/10.1007/BF00552042
NOTES

*Corresponding author.