Materials Sciences and Applications
Vol. 4 No. 3 (2013) , Article ID: 29521 , 8 pages DOI:10.4236/msa.2013.43020
On the Role of Copper and Cooling Rates on the Microstructure, Defect Formations and Mechanical Properties of Al-Si-Mg Alloys
![]()
Materials and Manufacturing-Casting, Department of Mechanical Engineering, School of Engineering, Jönköping University, Jönköping, Sweden.
Email: *Salem.Seifeddine@jth.hj.se
Received November 30th, 2012; revised January 2nd, 2013; accepted February 1st, 2013
Keywords: Aluminium-Silicon Alloys; Microstructure; Mechanical Properties; Gradient Solidification
ABSTRACT
This paper aims to assess the role of Cu on Al-Si-Mg alloys, in a range of 0 - 5 wt%, qualitatively on microstructure, defect formation, in terms of porosity, and strength in the as-cast conditions. The ternary system of Al-Si-Mg, using the A356 alloy as a base material, were cast using the gradient solidification technique; applying three different solidification rates to produce directional solidified samples with a variety of microstructure coarsenesses. Microstructural observations reveal that as the Cu levels in the alloys are increased, the amounts of intermetallic compounds as well as the Cu concentration in the α-Al matrix are increased. Furthermore, the level of porosity is unaffected and the tensile strength is improved at the expense of ductility.
1. Introduction
The alloy and cooling conditions govern to a large extent the mechanical properties of Al-Si cast alloys. The cooling rate determines the coarseness of the microstructure including the Secondary Dendrite Arm Spacing, SDAS, which is often used as measure of the coarseness of the microstructure, the fraction, size and distribution of intermetallic phases and the segregation profiles of solute in the α-Al phase. Si particles in the microstructure, acting as stress initiating sites, could be modified by employing proper amounts of Sr, altering their shape from needle-like into fibrous morphology; the outcome is a more ductile material. The strength of components is furthermore governed by proper additions of Cu and Mg, which will be done at the expense of ductility [1,2]. The plastic deformation behaviour will be depending upon factors such as whether the Cu and Mg are found as coarse intermetallic compounds, the level of Cu and Mg in solid solution, or if Cu and Mg are found as GP zones formed at room temperature and/or as precipitates due to a post solidification treatment. Cu and Mg present in Al-Si cast alloys lead also to the formation of bands of coarse Si particles as they also enlarge the solidification interval, leading to an increased risk in forming shrinkage porosity, leading to premature failures [3].
Many studies have been carried out in order to investigate the effect of single variables on the properties of cast Al-Si-Mg alloys and especially the Cu content. Some studies [4,5] emphasize that due to ternary eutectic reaction at about 525˚C, the Cu content in the eutectic melt is high which increases volumetric shrinkage during solidification and porosity and thus decreasing the strength of components. Other studies [6,7] reveal that the strength of these alloys are improved as Cu is added up to level of 5%.
Based on the design of castings used in these studies, the samples could be differently solidified and fed causing contradictory results. Therefore, this paper seeks to assess the solely influence of Cu and microstructure on the porosity level and mechanical properties of Al-Si-Mg alloys with Cu levels of 0% - 5% using well-fed gradient solidified samples. The study aims to impart knowledge and recommendations on selecting Al-Si-Mg alloys with proper Cu levels for attaining high strength components and casting qualities.
2. Experimental Procedure
2.1. Melt and Sample Preparations
Seven Al-7%Si-0.4%Mg alloys, based on A356 master alloy, modified with approximately 200 - 250 ppm Sr, were cast having Cu concentrations as shown in Table 1. Cylindrical rods (length 18 cm, diameter 1 cm) were cast in a 200˚C preheated permanent mould. The rods were remelted with the gradient solidification technique as shown in Figure 1. The rods were inserted into the furnace at 710˚C where they were remelted for 20 min. The furnace was then raised with a prescribed speed and the samples were draw from the furnace. The speed of the furnace determines the solidification rate of the samples; different microstructures can thereby be produced by changing the speed. Three different coarsenesses of the microstructure having SDAS of approximately 10, 25 and 50 μm, were produced for the present investigation. Water cooling beneath the furnace was used for high furnace speeds, 3 mm/s and 0.3 mm/s corresponding to SDAS of 10 and 25 µm respectively to cool the samples, whereas no water cooling was used for the 0.03 mm/s velocity that corresponds to SDAS of 50 µm.
Table 1. Alloys composition in wt%.
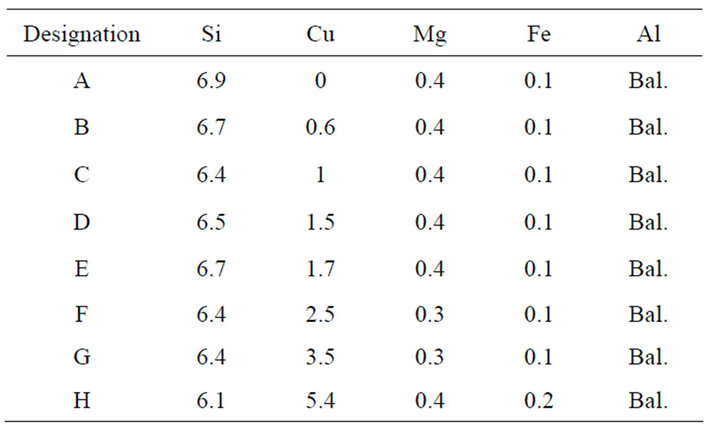
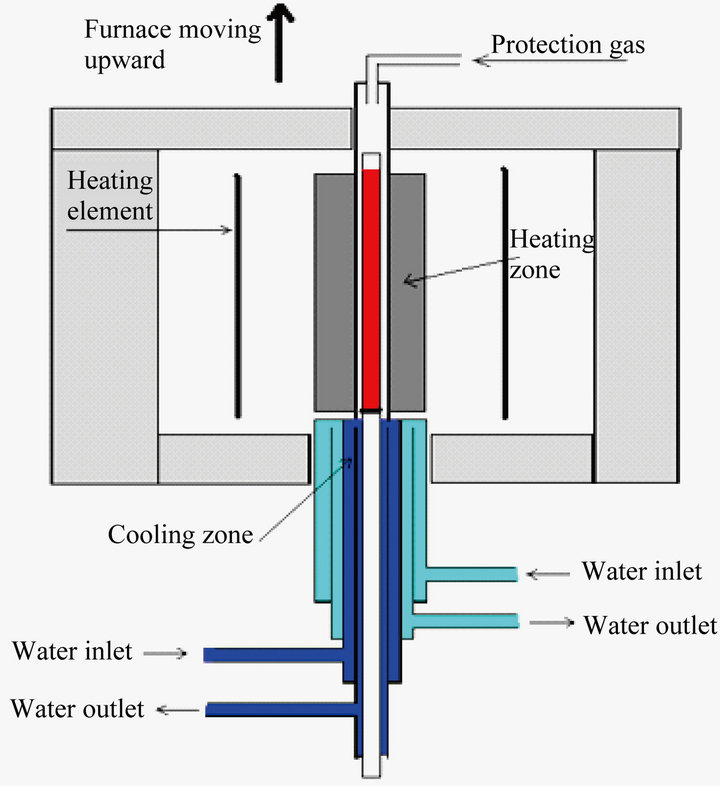
Figure 1. The gradient solidification equipment.
The samples produced using the gradient solidification technique have generally a low defect content. The solidification is directional giving a good feeding and gas and oxides are preferably pushed in front of the solidification front. Average SDAS (center-to-center distance between the dendrites) values from 10 measurements have been conducted to assure that the targeted microstructures are obtained.
2.2. Tensile Test Sample Preparation
Tensile test bars with a gauge length of 50 mm and a diameter of 7 mm were machined from the gradient solidified rods. Tensile tests were performed at a constant strain rate of 0.5 mm/min using a Zwick/Roell Z100 machine equipped with a 100 kN load cell and a clip-on 20 mm gauge length extensometer. Samples were tested until fracture, using three tensile test bars for each condition. Since the proposed gradient solidification technology has proven to deliver optimal tensile test results, revealing the potential of studied alloys, only the sample that performed the optimum quality is presented. Fracture surfaces and microstructures, including element segregation profiles, were studied using optical as well as scanning electron microscopy, SEM, equipped with energy and wavelength dispersive spectroscopy, EDS and WDS respectively. WDS measurements have been conducted on at least 3 dendrites, including centre and edge.
2.3. Density Measurements
Using the Archimedes’s principle, the density was calculated using the relation, Equation (1),
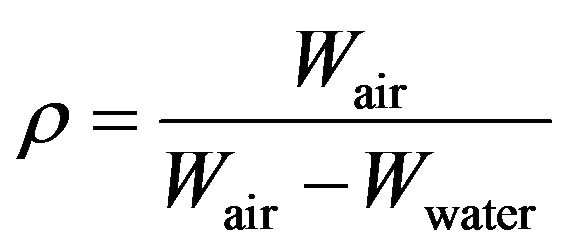 (1)
(1)
where Wair and Wwater are the weights of the sample, measured in air and distilled water respectively. The accuracy of the analytical balance was approximately 0.0001 g, and the temperature ranged from 20˚C to 22˚C. The size of samples was 9 mm in diameter and 5 mm in length; the values presented are an average based upon 4 samples/condition.
3. Results and Discussions
3.1. Microstructure Characterization
Solidification of these alloys begins with the development of primary aluminium dendrite that are directionally grown along with cooling direction as demonstrated in Figure 1. The relationship between the solidification rate and the coarseness of the microstructure, SDAS, is well studied, and is not the focus of the present study. An empirical equation, 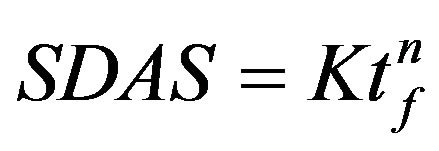 , is often used to describe the relation, where tf is the solidification time, n and K are alloy specific and n is between 0.3 - 0.5 and K is around 11.5 [8]. Being slightly depending on the chemical composition, a small impact of the amount of alloying elements on the SDAS can be observed in Figure 2. The Al-Si-Mg alloy have slightly higher SDAS compared to the alloy containing higher wt% Cu, which is in agreement with data reported by Shabestari et al. [4]. Mg2Si phases are hardly found in these Al-Si-Cu-Mg alloys, which is in agreement with observations of Samuel et al. [9,10] and Sjölander et al. [11] who found no Mg2Si phases when about 220 ppm Sr was added. As SDAS becomes smaller, porosity and second phase constituents such as the Si, Al2Cu and Q-Al5Mg8Si6Cu2 are dispersed more finely and evenly, see Figure 2. The reason why only three alloys are presented is due to the large number of alloys and thus large number of micrographs.
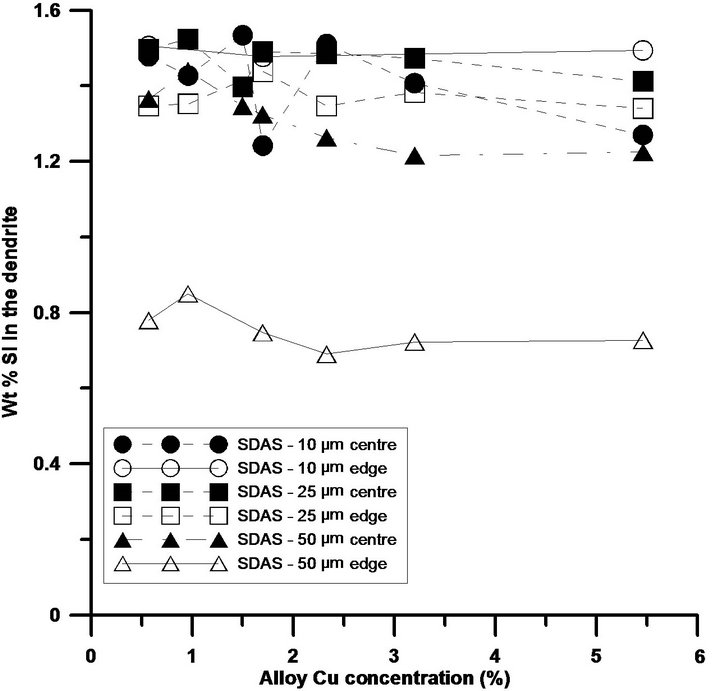
As the Cu levels are increased, area fractions and coarsenesses of phases such the Al2Cu phase, embedded in-between the dendrites, both as blocky and as eutectic, and the Q-Al5Mg8Si6Cu2 phase seem to be increased, see Figure 2. Numerous work has been performed on the distribution and location of these Cu-bearing intermetallics and the current study can only confirm these findings [9-11]. The reason for the increased fractions and coarsenesses of Cu-bearing intermetallics, along with increased Cu additions and cooling conditions, could be explained, besides the time available for growth, by the ability of the matrix to host elements, as clearly observed in Figure 3. In order to confirm the level of solutes hosted by the matrix, the influence of the solidification rate on the segregation profiles of Si, Mg and Cu in the α-Al matrix has been studied using WDS. The solid solution of Si in α-Al matrix is not influenced at all by the Cu additions and seems only to be governed by the cooling conditions. The current study reveals that an anomalous Si concentration profile is developed along with the cooling of solidification with higher Si concentration in the centre of the dendrite arm compared to the edge for the slowly solidified samples, see Figure 3(a). Higher levels of Si are observed at the edge of the dendrite compared to the centre for the samples with lower SDAS, which are also generally having higher overall Si concentrations compared to the two coarser microstructures. The result is in
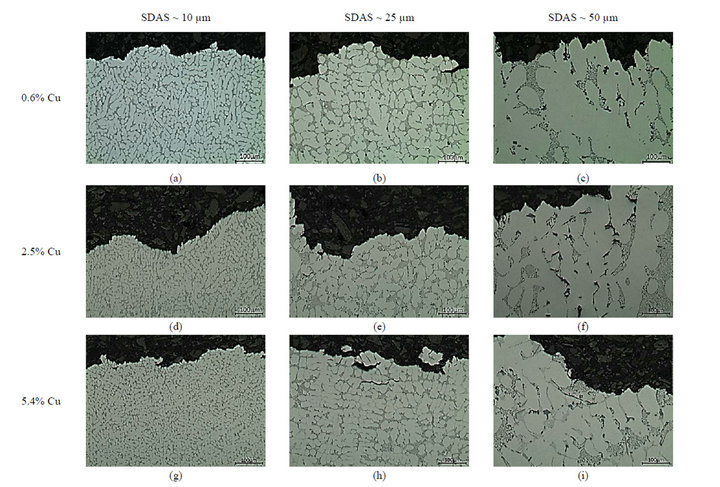
Figure 2. Illustration of the microstructure as a function of Cu additions and SDAS; (a)-(c) depict the microstructure of the 0.6% Cu alloy; (d)-(f) of the 2.5% Cu alloy and (g)-(i) of the 5.4% Cu alloy with SDAS ranging from 10 up ~50 µm.
 (a)
(a)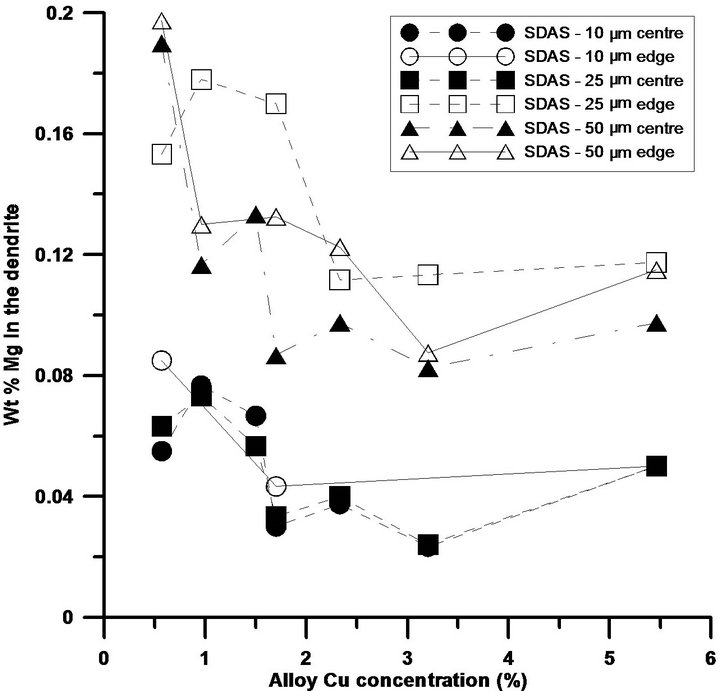 (b)
(b)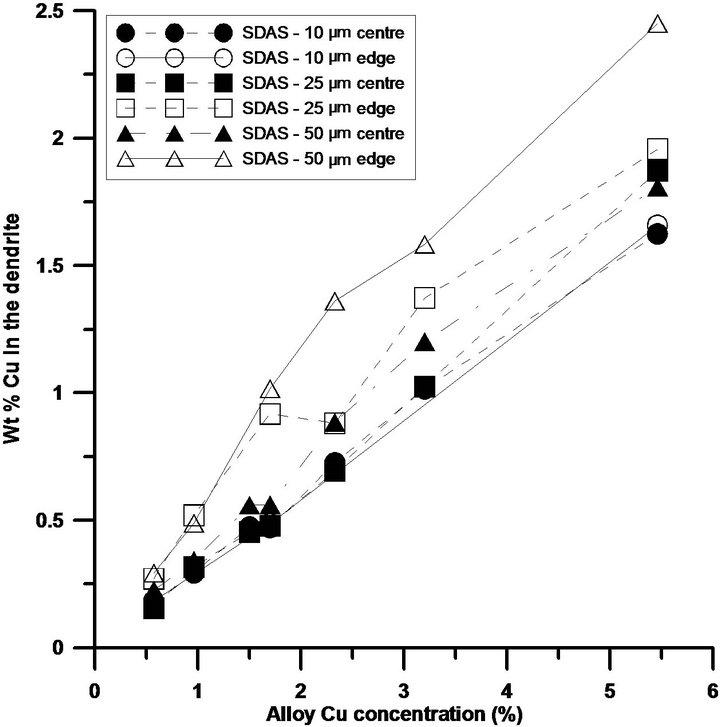 (c)
(c)
Figure 3. Si, Mg and Cu concentrations across a dendrite arm, edge and centre, with various sizes. While (a) illustrates the Si concentration across a dendrite arm of different sizes; (b) and (c) demonstrate the concentrations for Mg and Cu respectively.
agreement with Pedersen et al. [12] and Hons et al. [13] and lately confirmed by hardness measurement confirmed by Seifeddine et al. [14]. For the slowly solidified materials, Si could be diffused from the α-Al matrix to Si particles in the eutectic after solidification. This finding explains further the coarsening and formation of Si bands around the dendrites, especially for SDAS 50 µm, which furthermore is indicated by the low level of Si at the edge of the dendrite, due to shorter diffusion distances. The overall standard deviation for the Si measurements, is approximately 0.1, whereas for the alloys with 10 µm in SDAS and 5.4% Cu, the standard deviation of the edge measurements was approximately 0.3.
The segregation profiles for Mg and Cu are shown in Figures 3(b) and (c). The Mg concentration of the samples with larger SDAS are on a higher level than the finer ones, which probably is a result of back diffusion due to the longer solidification time. Similar concentrations of Mg in the centre of dendrites in the as-cast condition have been reported by Sjölander et al. [15]. It is also observed that the matrix are not able to host as high levels of Mg as the Cu levels are increased, reaching a plateau at around 2.5% Cu where no further changes in the Mg solid solubility is affected, and the trends are not influenced by the cooling conditions. Other explanations for the drop in Mg concentration in the matrix could be the Mg level in the alloys, which is slightly lower for some alloys, but also to formations of for instance the Q-phase.
The Cu concentrations in the dendrites seem to be slightly influenced by the solidification rate, with a higher Cu concentration at the dendrite centre and edge for coarser microstructures, which is also supposed to be a result of back diffusion due to the longer solidification time. Cu concentrations in the centre of the dendrites have been reported in the literature, but these results show some variations. Qian et al. [16] and Sjölander et al. [15,17] report around 0.7 wt% Cu in similar alloy with SDAS 10 - 19 µm while Han et al. [18] report 1.2 wt% Cu in an Al-7Si-3.5Cu alloy with SDAS around 40 µm, which is in better agreement with the present investigation. The overall standard deviation for the Mg measurements, is no more than 0.06 unaffected by cooling conditions, whereas for the alloys with Cu levels below 2% the standard deviation of the measurements was approximately 0.06 and around 0.15 for the alloys with higher Cu levels.
Possible reasons for deviations in the reported results and as compared to what is available in the literature are differences in measurement method used, EDS or WDS, and the difficulty of finding a dendrite that is cut through its centre. The spot size, being a larger part of the dendrite for the finest microstructure, influences the result by giving a too high concentration in the centre of the dendrite as a larger part of the dendrite is included in the measurement.
Second phase constituents such as Si and Cu-bearing particles are dispersed more finely and evenly as the cooling rate is increased, which in turn also has been observed to govern the length as well as the percentage area fraction of porosity. It is obvious that as the solidification time is short, small SDAS, less time will be available for the diffusion of the hydrogen into the interdendritic regions which results in small sizes of pores. Theories of oxide films [19] suggests that when an oxide film is approached by the solidification front, the particle experiences the hydrogen-rich environment produced by the rejection of gas from the advancing solid. Furthermore, the access of gas by diffusion into the air pocket in the gap of the oxide particles, the pore will starts to form and grow. As the freezing rate becomes slower, higher SDAS, and the particle is poorly wetted by the melt, time will therefore be available for more hydrogen to diffuse resulting in pore expansion and growth [19,20]. Reduction in SDAS, see Figures 4(a), (d) and (g), should therefore result in smaller average pore size and in area fraction of porosity and vice versa. But comparing the porosity formation, the samples with SDAS 25 µm are associated with largest percentage area fraction of porosity which might be due to the arrestment of premature pores as they become entrapped by the advancing solidification front; irrespective to the Cu content, see Figures 4(b), (e) and (h). A possible explanation for this behaviour could be due to engulfment of oxide films being enriched in hydrogen, and unfolded during the solidification. As illustrated in Figures 4(c), (f) and (i), the coarsest microstructure, SDAS 50 µm, did not result in larger pores nor larger area fractions and it is therefore reasonable to assume that due the slow cooling conditions many air pockets formed within the liquid or due to interaction with oxide particles have been driven in front of the solidified front without being engulfed, in the studied samples, and in that case not been detected in the gradient solidified specimens due to the solidification mode. Another reason might be the longer time available for the hydrogen to diffuse and move in front of solidliquid interface out of the sample into the surrounding environment.
Generally, as Cu is added, a ternary eutectic reaction at about 525˚C will occur leading to shrinkage that will not be compensated. Besides, the sample hydrogen activity coefficient might decrease with increasing Cu content and hydrogen solubility decreases, leading to increased porosity [4,5,21]. Due to the mode of solidification, the current study cannot confirm that increased Cu content lead to increased levels of porosity. Gradient solidified materials, directionally solidified, resulted on well fed samples, especially for SDAS 10 and 50 µm. Theoretical density calculations of the alloys confirm higher density values than the measured ones, as Figure 5 depicts, which indicate also the presence of porosity. The measured density data, which is in agreement with Shabestari et al. [4] and Morri et al. [22], cannot reveal any dependency of the Cu level on density more than with increased Cu, the alloy density increases.
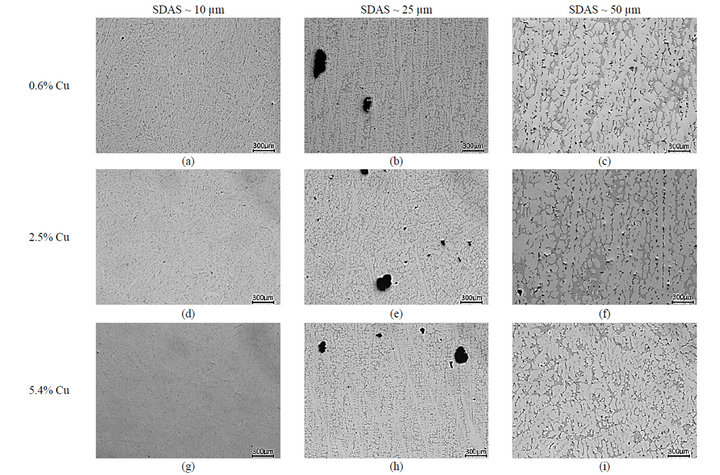
Figure 4. Optical micrographs of large cross section areas illustrating the influence of Cu additions and SDAS on the porosity distributions; (a)-(c) depict the microstructure of the 0.6% Cu alloy; (d)-(f) of the 2.5% Cu alloy and (g)-(i) of the 5.4% Cu alloy with SDAS ranging from 10 up ~50 µm.
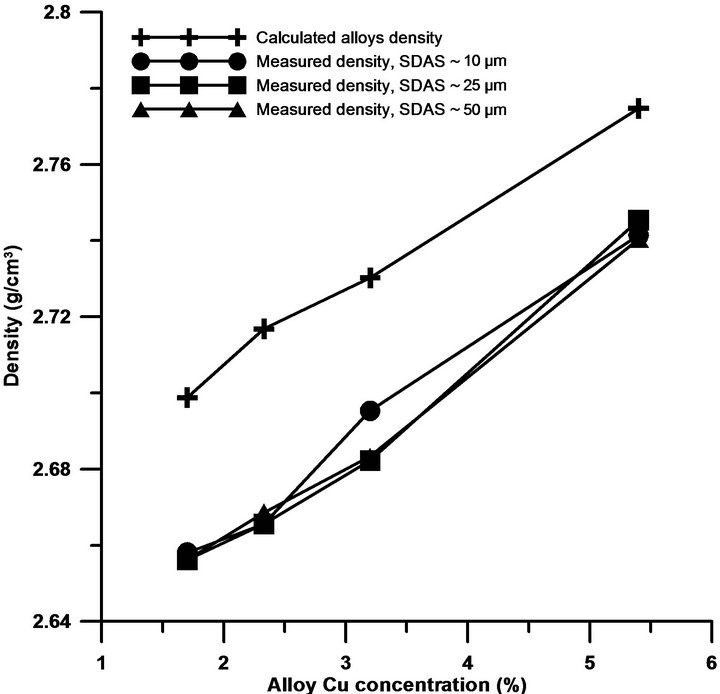
Figure 5. Changes of density with Cu additions and SDAS variations.
Worth to indicate is that the melt hydrogen content has not been measured and assumed in this case to be constant for all the alloys since they have been produced under similar conditions
3.2. Mechanical Properties
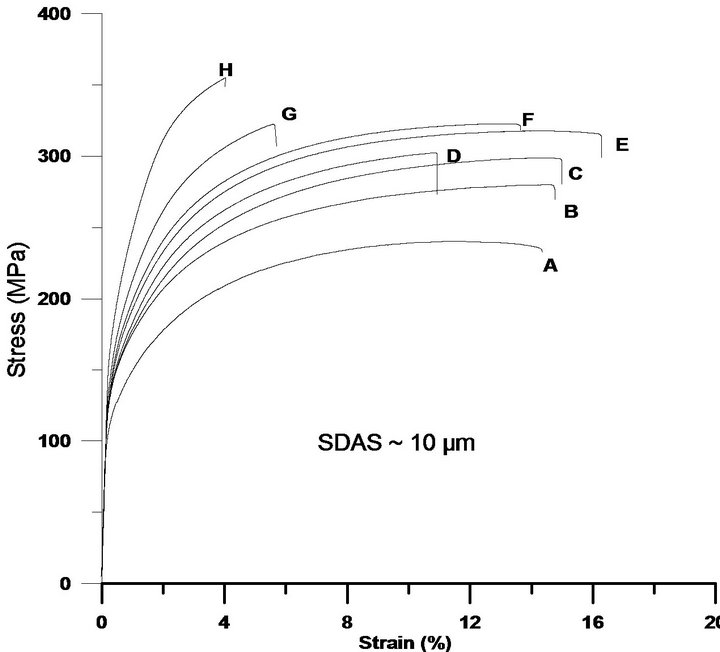
Cu is normally added to enhance the strength of Al-SiMg alloys, which is normally at the expense of ductility. Literature recommends lower levels of Cu, approximately 2% in order to avoid porosity formations which has a counter effect on the overall properties [4]. On the contrary, the current study reveals that Cu levels of 5% still keep increasing both the 0.2% proof stress and ultimate tensile strength at the expense of ductility, see Figures 6(a)-(c). The strength improvements are obtained due to factors such as if the Cu is present as atoms in solid solution or to Guinier Preston zones formed at room temperature [23], which is not investigated in the current investigation. The element concentration profiles, Figure 3, indicate that the matrix can host higher levels of Cu, the more Cu is added. The reduction in ductility is partially attributed to Si particles that tend to get coarser, and partially to the increased levels of Cu bearing intermetallics in Al-Si-Cu-Mg alloys, which is in agreement with reported data [24,25] The element concentration profiles indicate that less Mg is hosted in the matrix as Cu is added, which confirms that also Mg-rich intermetallics, are favourably formed. Being brittle and coarse, at higher stresses these particles tend to crack, grow and link due to the development of internal stresses in the particles. Moreover, formation of bands of brittle Si particles around dendrite arms has been observed and could be one of the mechanisms initiating the crack or leading to debonding and to premature failures, especially for the samples with coarser structures.
Furthermore, fracture surfaces of the Cu free tensile test samples reveal dimples and the mode of fracture is mostly transgranular. The coarser the structure becomes, the fracture seems to be shifted toward an intergranular mode of failure which is reasonably due to coarser intermetallics such as Cu-bearing and Si particles, which are once cracked, they easily link the cracks due to an increased levels of stresses at particles tips. As the level of Cu is increased, the ductility is decreasing and brittle Cu-intermetallics are found like “brittle layers” in between the secondary dendrite arms. Fracture surfaces of Cu rich alloys displays dimples for the finer microstructures and the higher Cu levels accompanied coarser
 (a)
(a)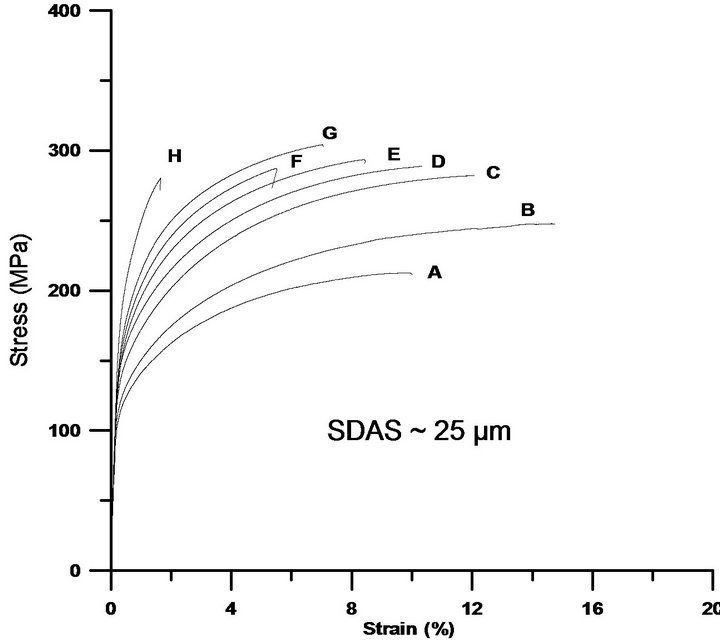 (b)
(b)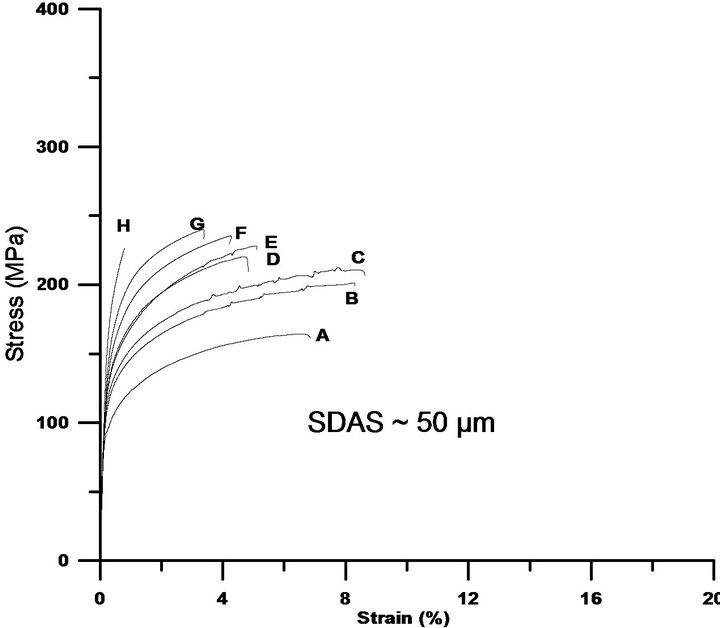 (c)
(c)
Figure 6. The tensile test curves reveal the positive influence of Cu on the 0.2% proof stress and ultimate tensile strength, which are on the expense of ductility. While (a) shows the tensile behaviour for samples with SDAS ~ 10 µm; (b) and (c) illustrate the influence of Cu on samples with SDAS of ~25 µm and ~50 µm respectively. The characters A-H placed near the curves are corresponding to alloy’s chemical composition found in Table 1.
structures the mode of failure is nearly always transgranular.
4. Conclusions
The following conclusions can be drawn from this study:
1) Al-Si-Cu-Mg alloys contain several interdendritic phases and the more Cu is added, the larger the area fractions of Cu-rich compounds. The size of the particles is largely influenced by the solidification rate, SDAS.
2) The solidification rate impacts on the segregation profiles of Si and Cu but seem to be stronger for Mg 3) Pore fractions and sizes of the alloys are not depending on Cu content but influenced by the mode of solidification.
4) The tensile strength seems to be favourably influenced by the addition of Cu on the expense of ductility which is lowered due to the increased levels of intermetallics.
5) The tensile strength decreases simultaneously by decreasing the cooling rate, SDAS, of the alloys.
6) Depending on the component design, castings that are directionally solidified and well fed, are beneficially alloyed with higher levels of Cu.
5. Acknowledgment
The authors would like to thank the Swedish Knowledge Foundation, Stena Aluminium AB and CompTech AB for the financial support.
REFERENCES
- C. Caceres, I. L. Svensson and J. Taylor, “Strength-Ductility Behaviour of Al-Si-Cu-Mg Casting Alloys in T6 Temper,” International Journal of Cast Metals Research, Vol. 15, No. 5, 2003, pp. 531-543.
- S. Seifeddine and I. L. Svensson, “The Effect of Cooling Conditions and Variation of Alloying Elements on the Microstructural and Mechanical Properties of Al-7%Si Cast Alloys,” Giessereiforschung, Vol. 58, No. 3, 2006, pp. 50-54.
- A. L. Dons, G. Heiberg, J. Voje, J. S. Maeland, J. O. Loland and A. Prestmo, “On the Effect of Additions of Cu and Mg on the Ductility of AlSi Foundry Alloys Cast with a Cooling Rate of Approximately 3 K/s,” Materials Science and Engineering A, Vol. 413, 2005, pp. 561-566. doi:10.1016/j.msea.2005.09.053
- S. G. Shabestari and H. Moemeni “Effect of Copper and Solidification Conditions on the Microstructure and Mechanical Properties of Al-Si-Mg Alloys,” Journal of Materials Processing Technology, Vol. 153-154, 2004, pp. 193-198. doi:10.1016/j.jmatprotec.2004.04.302
- C. H. Caceres, M. B. Djurdjevic, T. J. Stockwell and J. H. Sokolowski, “The Effect of Cu Content on the Level of Microporosity in Al-Si-Cu-Mg Alloys,” Scripta Materialia, Vol. 40, No. 5, 1999, pp. 631-637. doi:10.1016/S1359-6462(98)00492-8
- F. Grosselle, G. Timelli and F. Bonollo, “Doe Applied to Microstructural and Mechanical Properties of Al-Si-CuMg Casting Alloys for Automotive Applications,” Materials Science and Engineering A, Vol. 527, No. 15, 2010, pp. 3536-3545. doi:10.1016/j.msea.2010.02.029
- Z. Muzaffer, K. Erdem and G. Serap, “Influence of Cu Addition on Microstructure and Hardness of Near-Eutectic Al-Si-xCu-Alloys,” Transactions of Nonferrous Metals Society of China, Vol. 21, No. 8, 2011, pp. 1698- 1702. doi:10.1016/S1003-6326(11)60917-5
- M. Easton, C. Davidson and D. St John, “Effect of Alloy Composition on the Dendrite Arm Spacing of Multicomponent Aluminum Alloys,” Metallurgical and Materials Transactions A, Vol. 41, No. 6, 2010, pp. 1528-1538.
- E. H. Samuel, A. M. Samuel and H. W. Doty. “Factors Controlling the Type and Morphology of Cu-Containing Phases in 319 Al Alloy,” AFS Transactions, Vol. 30, 1996, pp. 893-901.
- A. M. Samuel, P. Ouellet, F. H. Samuel and H. W. Doty, “Microstructural Interpretation of Thermal Analysis of Commercial 319 Al Alloy with Mg and Sr Additions,” AFS Transactions, Vol. 105, 1997, pp. 951-962.
- E. Sjölander, “Heat Treatment of Al-Si-Cu-Mg Casting Alloys,” Ph.D Dissertation, Chalmers University of Technology, Gothenburg, 2011,
- L. Pedersen and L. Arnberg, “Anomalous Microsegregation in Al-Si Foundry Alloys,” Materials Science and Engineering A, Vol. 241, No. 1-2, 1998, pp. 285-289. doi:10.1016/S0921-5093(97)00490-5
- A. L. Dons, L. Pedersen and L. Arnberg, “The Origin of ‘Anomalous’ Microsegregation in Al-Si Foundry Alloys— Modelling and Experimental Verification” Materials Science and Engineering A, Vol. 271, No. 1-2, 1999, pp. 91- 94. doi:10.1016/S0921-5093(99)00273-7
- S. Seifeddine, S. Johansson and I. L. Svensson, “The Influence of Cooling Rate and Manganese Content on the Al5FeSi Phase Formation and Mechanical Properties of Al-Si-Based Alloys,” Materials Science and Engineering A, Vol. 490, No. 1-2, 2008. pp. 385-390. doi:10.1016/j.msea.2008.01.056
- E. Sjölander and S. Seifeddine, “Optimization of Solution Treatment of Cast Al-7Si-0.3Mg and Al-8Si-3Cu-0.5Mg Alloys,” Submitted to the Metallurgical and Materials Transactions A, (ISSN 1073-5623) (EISSN 1543-1940).
- M. Qian, F. Yi, D. Zhang, X. Pan, H. D. Brody and J. E. Morral, “Solute Distribution and Phase Appearance in As-Cast Al-Si-Cu-Mg-Fe Alloys,” ASM International, Pittsburgh, 2003, pp. 69-78.
- E. Sjölander and S. Seifeddine, “Optimisation of Solution Treatment of Cast Al-Si-Cu Alloys,” Materials and Design, Vol. 31, Suppl. 1, 2010, pp. S44-S49. doi:10.1016/j.matdes.2009.10.035
- Y. M. Han, A. M. Samuel, F. H. Samuel, S. Valtierra and H. W. Doty, “Effect of Solution Heat Treatment Type on the Dissolution of Copper Phases in Al-Si-Cu-Mg Type Alloys,” AFS Transactions, Vol. 116, 2008, pp. 79- 90.
- J. Campbell, “Castings,” 2nd Edition, Butterworth-Heinemann Ltd., Oxford, 2003.
- T. S. Shih, L. W. Hang and Y. J. Chen, “Relative Porosity in Aluminium and in Aluminium Alloys,” International Journal of Cast Metals Research, Vol. 18, No. 5, 2005, pp. 301-308. doi:10.1179/136404605225023135
- L. Backerud, “Solidification Characteristics of Aluminum Alloys,” Amer Foundry Society, Schaumburg, 1990.
- A. Morri, L. Ceschini, I. L. Svensson and S. Seifeddine, “Relationship between Pore Volume (by Density Measurements) and Pore Area (on Fracture Surfaces) of A356 Fatigue Specimens,” TMS Annual Meeting, Vol. 2, 2012, pp. 233-240.
- L. Wang, M. Makhlouf and D. Apelian, “Aluminium Die Casting Alloys: Alloy Composition, Microstructure, and Properties-Performance Relationships,” International Materials Reviews, Vol. 40, No. 6, 1995, pp. 221-238.
- E. H. Samuel, A. M. Samuel and H. W. Doty, “Factors Controlling the Type and Morphology of Cu-Containing Phases in 319 Al Alloy,” AFS Transactions, Vol. 30, 1996, pp. 893-901.
- H. De La Sablonnière and F. H. Samuel, “Solution Heat Treatment of 319 Aluminium Alloy Containing Approx 0.5 wt% Mg, Part I, Solidification and Tensile Properties,” Cast Metals, West Bromwichm, 1996, pp. 195- 211.
NOTES
*Corresponding author.