Journal of Modern Physics
Vol.4 No.10B(2013), Article ID:38732,8 pages DOI:10.4236/jmp.2013.410A2001
Rheological Characteristics of Gluten after Modified by DATEM, Ascorbic Acid, Urea and DTT Using Creep-Recovery Test
1Robert M Kerr Food & Agricultural Products Center, Oklahoma State University, Stillwater, USA
2Department of Food Science, Cornell University, Ithaca, USA
3Department of Biochemistry and Molecular Biology, Oklahoma State University, Stillwater, USA
Email: *pat.rayas_duarte@okstate.edu
Copyright © 2013 Pavalee Chompoorat et al. This is an open access article distributed under the Creative Commons Attribution License, which permits unrestricted use, distribution, and reproduction in any medium, provided the original work is properly cited.
Received August 11, 2013; revised September 12, 2013; accepted September 28, 2013
Keywords: Burgers Model; Creep-Recovery Test; Gluten; Gluten and Dough Rheology; Principal Component Analysis (PCA)
ABSTRACT
The effects of diacetyl tartaric acid ester of monoglycerides (DATEM), ascorbic acid (AA), urea, and dithiothreitol (DTT) on viscoelastic properties of commercial hard red winter wheat gluten were investigated. A constant shear stress of 40 Pa was applied to gluten during creep-recovery test. Experimental creep-recovery compliance responses were fitted into a Burgers model with four elements accounting for characteristics of pure elastic (spring), viscoelastic (spring-dashpots elements), and viscous flow (dashpot). DATEM decreased the elasticity and viscoelasticity, but increased viscosity of gluten. The addition of AA, urea, and DTT, resulted in opposite rheological properties when compared with DATEM. Relationship among physical properties was also studied with principal component analysis (PCA) including gluten viscoelasticity, dough mixing and baking properties. Regressed coefficients from Burgers model accounted for higher percent of explained variance and were independent from flour content, baking and dough mixing properties.
1. Introduction
Gluten is a protein macropolymer in wheat flour that formed in hydrated flour during dough mixing. Gluten plays a major role in viscoelastic properties of breadmaking which is highly correlated to the quality of end products. Glutenins and gliadins are the polymeric and monomeric protein components of gluten, respectively. The high molecular weight glutenin subunits (HMW-GS) are responsible for elasticity of gluten; while low molecular weight glutenin subunits (LMW-GS) are for gluten viscoelasticity [1]. Gliadins act as plasticizers by increasing viscous flow to the embedded glutenin polymers. It has been shown that these gluten fractions help holding carbon dioxide and ethanol gases from yeast during fermentation and also provide limited surface activity in dough during proving [2]. The food industry uses surface active agents and oxidizers in bread formulation to improve interaction between gluten and end product quality.
Diacetyl tartaric acid ester of monoglycerides (DATEM) is one of the most effective surfactants in breadmaking. It is assumed to reduce surface tension resulting in enhancing kinetic stability in gluten and dough system [3]. DATEM was also attributed to decrease the surface tension of gas bubbles by interacting with lipids in dough and lead to the formation of smaller bubbles [4]. Presumably, DATEM promotes interactions of protein-starchlipid, thereby increasing resistance to deformation [5] and breadmaking functionality such as, dough stability during proving and volume of bread [6]. While the effect of DATEM on rheological properties of dough and bread have been reported [7-12], the underlying understanding of specific changes in the structure of the gluten macropolymers is far from complete. Viscoelastic properties of food and non-food materials are measured by creep-recovery test. It is a rheological test performed by applying an instantaneously constant shear stress to the material and the resulting strain recorded over time during creep. The shear stress is removed and the residual strain recorded over time during recovery. The mechanism of this test can reveal the alteration of structure at a molecular level. While some reports on the effect of DATEM on viscoelastic properties using creep-recovery test in cereal based foods can be found [7,8], no reports have covered the effect of DATEM on viscoelastic properties of gluten using modeling creep-recovery compliance. Ascorbic acid (AA), urea, and dithiothreitol (DTT) are also interesting compounds due to their ability to change protein conformations. The specific interactions of these compounds could yield insights to the relationship between molecular bonding and viscoelastic properties. AA has been widely used as dough improver because of its ability to promote disulfide linkage via oxidation [1], thus increase dough’s ability to retain gas during fermentation and baking. Urea is a denaturant and has the ability to displace water and forms hydrogen bonds with amino acids [13]. It was suggested that urea denatures protein by increasing the surface repulsion which results in structural destabilization. Therefore, by using urea in this study, we could quantify the contribution of hydrogen bonding toward viscoelastic properties. Lastly, DTT disrupts disulfide bond in gluten which will directly affect both intermolecular and intramolecular bonding of low molecular weight and high molecular weight glutenin subunits [13].
In this study, we report the structural changes of gluten polymers in the presence of DATEM, AA, urea and DTT, and their relationships to indicators of quality widely used in the baking industry. The gluten was isolated and the protein-protein structures formed were analyzed by modeling their behavior interrogated by creep-recovery compliance.
The objectives of this study were 1) to investigate the effect of DATEM, AA, urea and DTT on viscoelasticity of gluten and apply rheological models to assess structural changes and 2) to determine the relationship between the coefficients obtained from modeling creeprecovery compliance and quality indicators of dough mixing and breadmaking tests.
2. Materials and Methods
2.1. Wheat Flours and Preparation of DATEM, Ascorbic Acid (AA), Urea, and Dithiothreitol (DTT)
We analyzed twenty-two commercial hard red winter wheat flour samples (4 controls and 18 each flour with each level of all compounds). Flours were obtained from wheat grown in the Southern Great Plains region of United States. We identified the flours as C1, C2, C3, C4, C5, and C6. Flour samples were stored at 0˚C and brought to room temperature for 24 h before analysis. We determined protein, moisture and ash content of flour by near infrared reflectance using a FOSS system model 6500 (FOSS NIR System Inc., Laurel, MD).
Concentrations of each compound were used differently; four levels (0%, 0.3%, 0.6% and 1.0%, w/w flour basis) of DATEM (AIC DATEM 100, Caravan Ingredients, Lenexa, KS); five levels (0, 50, 100, 150, 200 ppm) of AA (Malinckrodt Baker Inc., Phillipsburg, NJ); four levels (0, 0.5, 1 and 1.5 M) of urea (VWR International Inc., West Chester, PA); and four levels (0, 0.1, 0.25 and 0.5 mM) of DTT (VWR International Inc., West Chester PA). For a preparation of DATEM, we used a sonicator to heat a 5 mL DATEM solution (0.6, 1.2 and 2 g DATEM in 100 ml of 2% NaCl solution) to 65˚C in order to dissolve DATEM. The rest of compounds were directly added to flour as a solution.
2.2. Physicochemical Analysis of Dough with DATEM, Ascorbic Acid (AA), Urea, and Dithiothreitol (DTT)
Flour with each level of DATEM, AA, urea, and DTT were assessed for 1) dough mixing properties with parameters of development time (DT), stability time (ST), breakdown time (BT) and water absorption (WA) according to [14] Approved Method 54-21 (AACCI 2000), and 2) baking properties with the optimized straightdough procedure of Approved Method 10-10B (AACCI 2000). Parameters of bread quality are dough proof height (PH) and loaf height (LH) measured by a digital proof height gauge (National Mfg. Co. TMCO Inc., Lincoln, NE), loaf volume (LV) from rapeseed displacement, oven spring (OSP) calculated by subtracting loaf height from proof heights, and specific volume (SV) as the ratio of loaf volume to loaf weight. These analyses were performed in duplicates.
2.3. Creep and Recovery Test of Gluten
We added 5 mL DATEM, AA, urea, and DTT solution directly to 10 g flour and mixed for 20 sec. Deionized water (5 mL) was used instead of all compounds solution in control samples. We used a Glutomatic system model 2202 (Perten Instruments, Huddinge, Sweden) for extracting gluten from wheat flour samples. We added 10 g of flour sample with 0.5 ml of 2% NaCl solution (w/v) in the glutomatic chamber before washing soluble particles with excess 2% NaCl solution through a polyester screen (88 μm) for 6 min. The remaining residue in the chamber was wet gluten which we analyzed with the creep-recovery test.
A creep-recovery method based on Zhao et al. [15] was used in this study. Mineral oil was applied to the gluten edge in order to prevent moisture loss. Briefly, the gluten was relaxed under a plate of 2.5 kg fitted with 2.5 mm spacers during 60 min at room temperature. A round cutter of 25 mm diameter was used to obtain a gluten disc which was loaded to the rheometer. The test was performed by applying a constant shear stress of 40 Pa for 100 s followed by 1000 s of recovery with parallel plate. The analysis was performed in duplicates. The creep-recovery data was interpolated into 10,000 points before fitting into Burgers model.
3. Burgers Model
3.1. Calculation of Creep Test
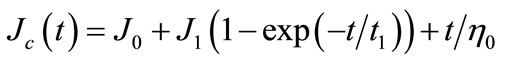
During creep test, instantaneous creep (shear) compliance was given to gluten with a constant shear rate and provided changing magnitude of strain as a function of time. Spring and dashpot are two mechanical analogues of rheological behavior. These two elements represent elastic solid (spring) and viscous flow (dashpot) of viscoelastic materials. Burgers model has been commonly applied to study viscoelastic behavior of soft matter. It is a combination of Maxwell and Kelvin-Voigt models. Maxwell model is represented by a spring and a dashpot; while, a parallel arrangement between spring and dashpot is used in Kelvin-Voigt model. Equation (1) shows the model during creep:
 (1)
(1)
We fitted our experimental data into a four-element model of Burgers model. Gluten shows time-dependent behavior during deformation. Therefore, we can study its properties by applying creep (shear) compliance as a function of time (Jc(t)). The first element of Burgers model is instantaneous shear compliance (J0) corresponding to a spring. This element is deflected at the beginning of deformation test and showed gluten pure elasticity with no time delay. The second element is delayed or retarded viscoelasticity (J1). Retardation time (t1) is a time of delayed elastic deformation to reach equilibrium at 63.2% of the maximum value of the curve. The last element is pure viscosity of gluten (η0). This element corresponds to an increase in deformation of dashpot.
We applied creep-recovery test to investigate the effect of DATEM, AA, urea, and DTT on viscoelastic properties of gluten. Each element of Burger models helped to explain properties of gluten by the coefficients of each curve section. This model is a good tool for investigating molecular response of biological materials. Coefficient values from Burgers model can assist explaining the internal structure of gluten after exposed to DATEM, AA, urea, and DTT in different concentrations.
3.2. Calculation of Recovery Test
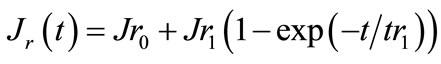
Gluten structure shows non-linear viscoelastic properties due to its ability to recover some structure by storing energy after the applied stress. Shear stress was completely removed during recovery phase. We were able to obtain a reformation value from Burgers model. Equation (2) shows the Burgers model during recovery:
 (2)
(2)
Each element in recovery equation corresponds to the described parameters in creep phase (Equation (1)). Equation (2) contained only 3 elements because there is no dashpot (pure viscous) during recovery phase. In terms of physical changes, tr1 represents the time it takes the gluten recovery step response to reach 1 – 1/exp(1) ≈ 63.2% of its final (asymptotic) value. Thus, it is the time required for the elastic recovery of gluten to rise from zero (deformed) to 63.2% of its final value when it varies with time t as 1 – exp(−kt). The time required for elastic recovery to fall to 1/exp(1) (that is 36.8%) of its initial value when it varies with time t as exp(−kt).
4. Statistical Analysis
We used ANOVA for testing comparison of means significant differences using Tukey’s multiple comparisons test (α = 0.05) in SAS program (Version 9.1 SAS Institute Inc., Cary, NC). Principal component analysis (PCA) was performed using Canoco for Windows 4.5 software (Centre for Biometry, Wageningen, The Netherlands) [16,17].
5. Results and Discussion
5.1. Effect of DATEM, AA, Urea, and DTT on Viscoelastic Properties of Gluten
Protein, moisture, and ash content of flour samples were shown in Table 1.
Sample C5 was chosen for further study because its protein content was closely matched with the average of protein content. The creep-recovery curves of selected gluten (C5) with all compounds (DATEM, AA, urea, and DTT) showed typical viscoelastic properties similar to gluten alone (Figure 1).
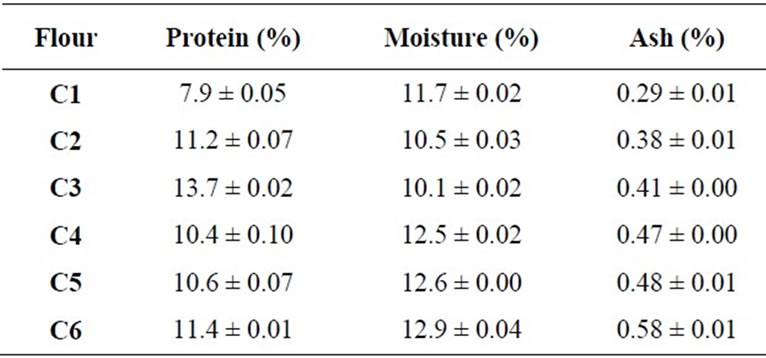
Table 1. Partial proximate analysis of commercial hard red winter flours (means ± SD, n = 2).
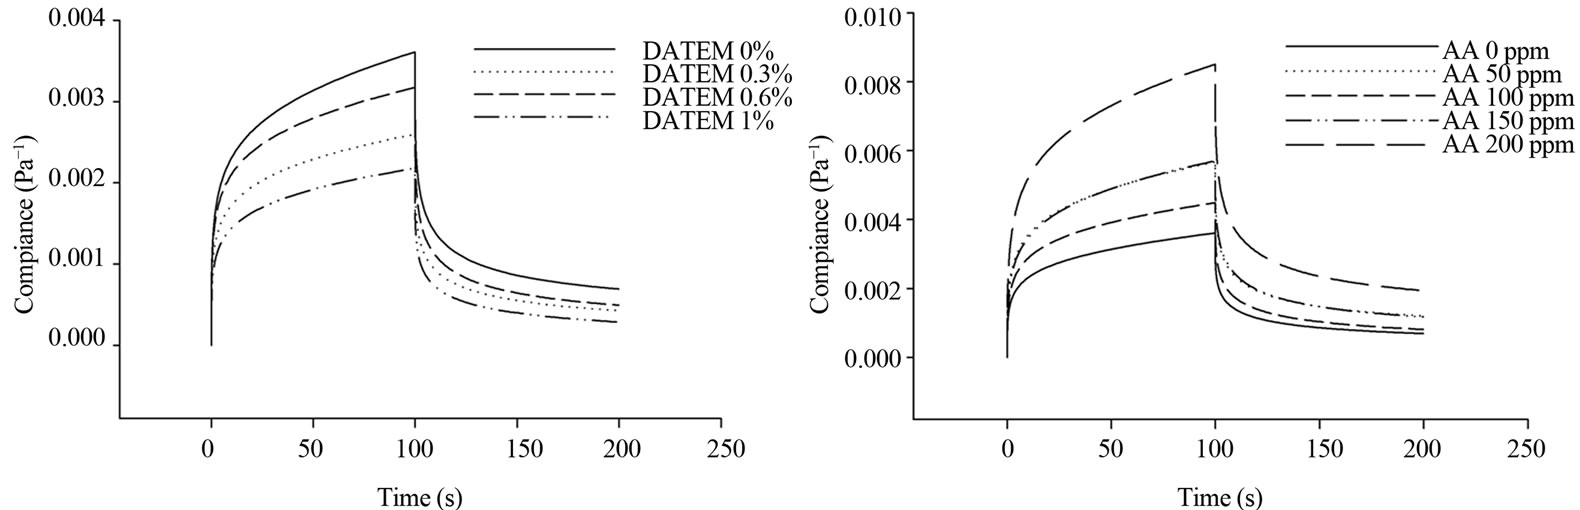
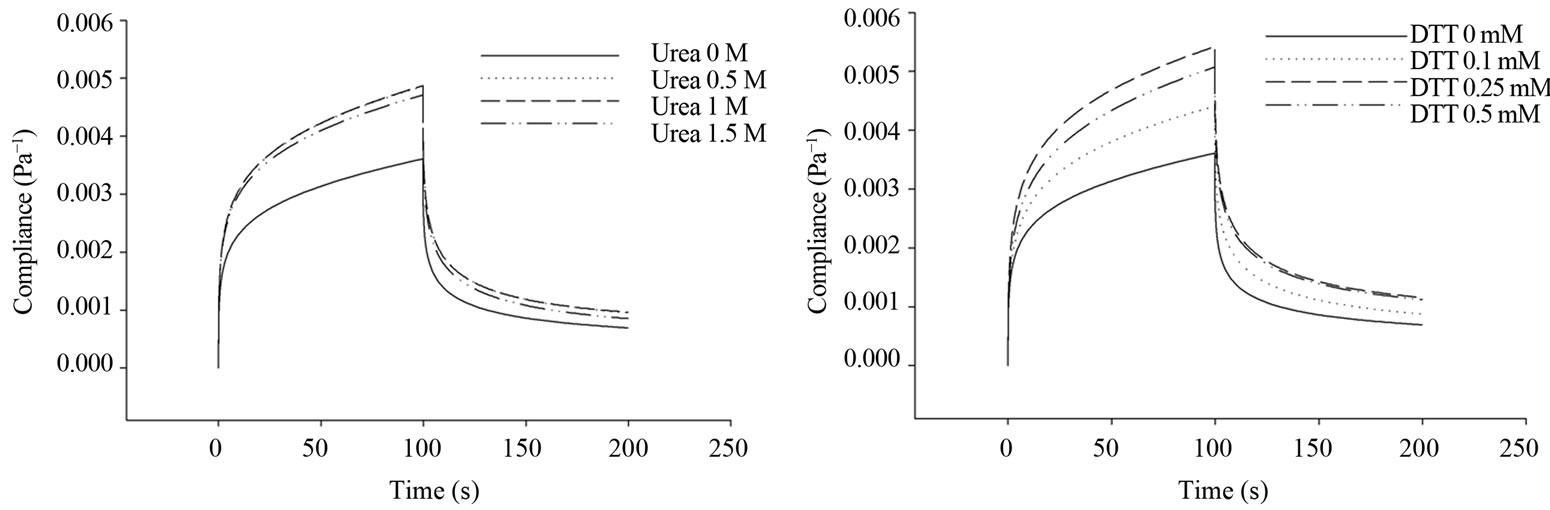
Figure 1. Representative curves of the effect of DATEM, ascorbic acid (AA), urea and DTT on viscoelastic behavior of gluten from a selected flour C5.
The creep compliance curves of gluten exhibited the same pattern for different levels of all compounds. Compliance was used to describe deformation behavior of viscoelastic material, i.e., the higher the compliance value, the greater deformation and lower rigidity of the material. The result showed that an increase in DATEM concentration significantly reduced the magnitude of maximum compliance; while, higher gluten maximum compliance was observed when AA, urea, and DTT were incorporated into gluten system.
Maximum strain (Max strain, γ) at steady-state creep with constant shear rate corresponded to deformation of gluten. In Table 2, max strain (γ) values were obtained directly from the maximum compliance from Figure 2 in which compliance was converted into strain. After treated gluten with DATEM, gluten showed higher resistance to deformation (γ) compared to control.
An increased in rigidity of gluten after treated with DATEM suggested the presence of an end-linked network of high molecular weight and low molecular weight glutenin subunits (HMW-GS and LMW-GS, respectively) infiltrated by gliadin polymers in the form of a resin-like state in which an increase viscosity will account for the increase aggregation of polymers concomitant to a decrease of repulsion forces between polymers caused by DATEM. In comparison, the addition of AA, urea, and DTT induced significant increase in max strain (γ). An increase in deformation of gluten by urea and DTT can be explained by the disruption of hydrogen bonds and disulfide bonds in gluten system, respectively. A surprise finding is that AA increased the compliance of gluten during creep and elasticity during recovery of sample C5. As expected, AA promoted disulfide linkages in gluten [1]. Max strain (γ) is a function of elasticity (J0) and retarded viscoelasticity (J1) compliance, as well as viscosity during creep. A more compliant elasticity during recovery (Jr0) indicated higher recoverable energy stored by a more crosslinked (via increased disulfide bonds) gluten than the control.
5.1.1. Effect of DATEM, AA, Urea, and DTT on Gluten Coefficients from Burgers Model during Creep Phase
To investigate gluten behavior at molecular level, Burgers model was fitted with creep data to obtain rheological parameters. The description of each regressed parameter from Burgers model was described earlier in method section. In Table 2, for instantaneous shear compliance (J0), gluten treated with DATEM resulted in significant decrease in J0 compared to control, which trans-
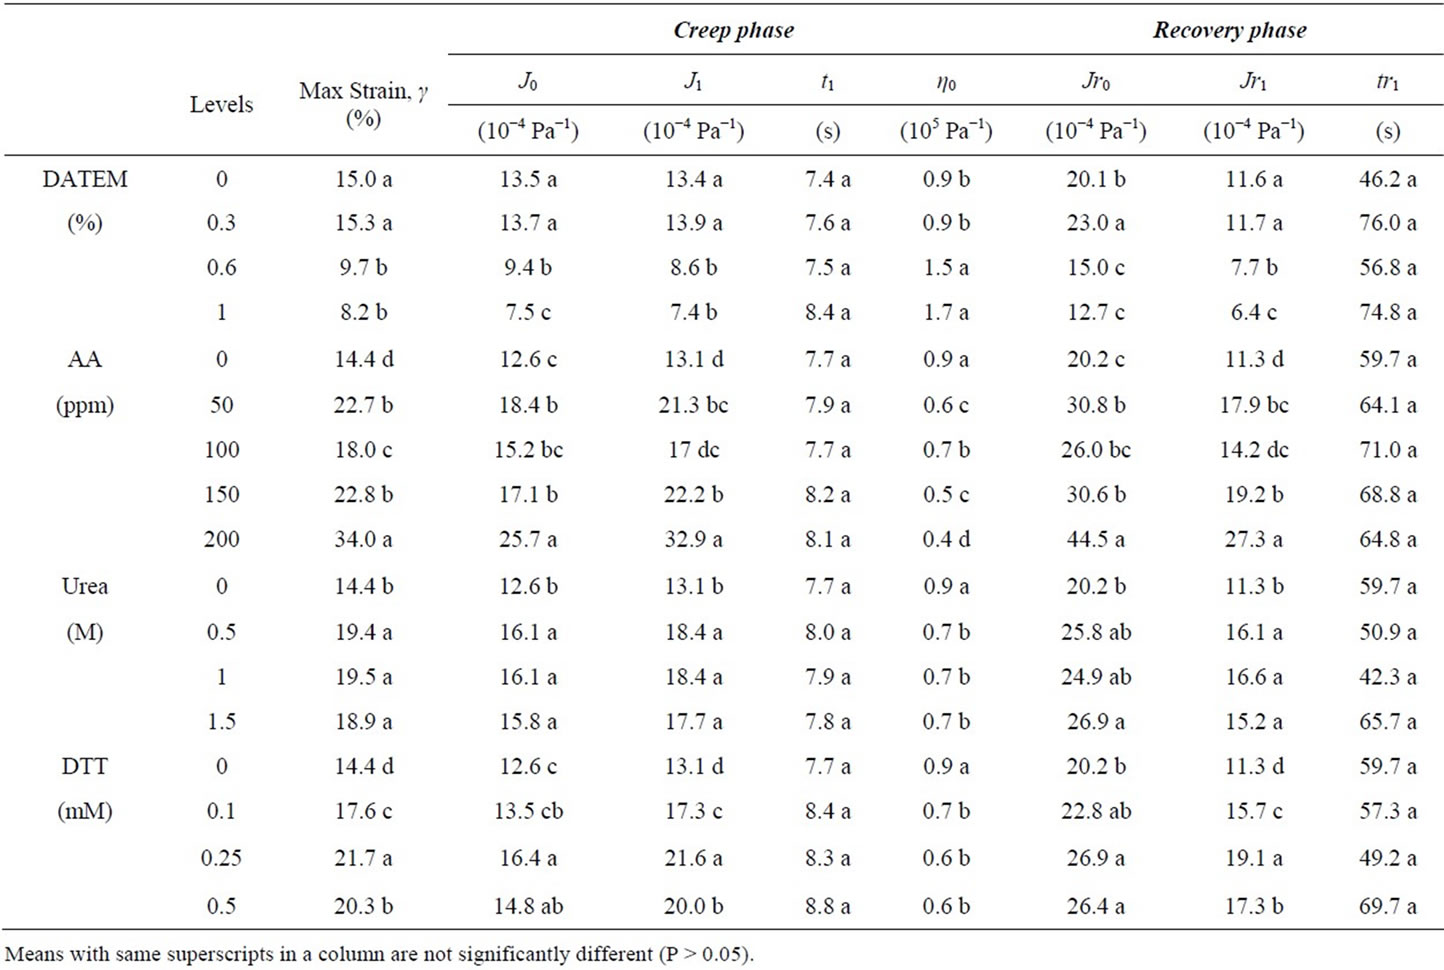
Table 2. Effect of DATEM, ascorbic acid (AA), urea and DTT on gluten regressed parameters from Burgers model of creep and recovery phases of a selected flour C5.
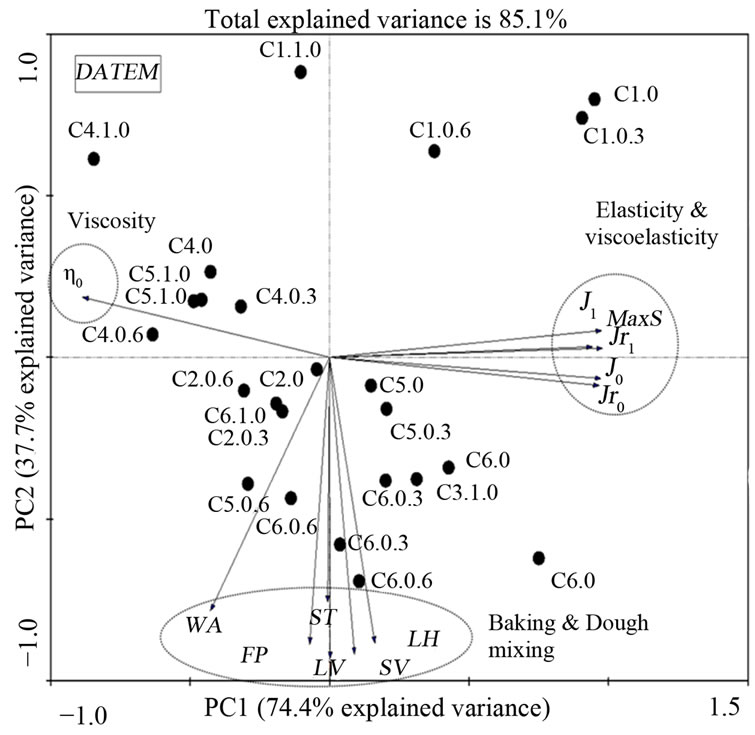
Figure 2. Principle component analysis of gluten from a set of 22 hard red winter wheat samples with DATEM treatment involving 12 indicators of dough and gluten quality (dough mixing and viscoelasticity of gluten) and one indicator of gluten quantity (flour protein) from total of 29 variables.
lated to decrease in elasticity and increase in rigidity. When 1% DATEM was added, the parameter J0 decreased by 18% - 50% depending on the type of sample (data not shown). The addition of AA, urea and DTT resulted in an opposite behavior when compared to DATEM and they significantly increased elasticity (J0) of gluten (at the highest level, AA increased by 108%, urea increased by 23%, and DTT increased by 42%). Previously, it has been shown that the elasticity of gluten is mostly attributed to HMW-GS forming the backbone of the polymeric structure via interchain disulfide bonds [1]. Thus, we proposed that a possible explanation for a reduced gluten elastic deformability and the increment of gluten rigidity is the interaction of DATEM with the hydrophobic gluten domains made largely of HMW-GS and to a less extent by LMW-GS hydrophobic domains. If such interactions lower gluten’s original hydrophobicity, the conformation most likely has changed to a lower coilback potential of the polymer.
The retarded viscoelastic parameter, J1, obtained from a delayed viscoelastic region of gluten showed that J1 decreased with an addition of DATEM in gluten, but increased when AA, urea, and DTT were added which is similar to J0 trend. Viscoelastic properties of gluten are mainly contributed by LMW-GS, therefore, it is possible that all compounds interact with gluten including LMWGS. Interestingly, increasing the concentration of the compounds did not significantly change retardation time, t1, even though t1 is directly related to viscoelastic properties which is similar to J1. This observation could be due to the insensitivity of exponential term in Burgers model when t1 was calculated and further suggested that t1 may not be a suitable parameter for this gluten system of this sample set. Zero shear viscosity (η0) significantly raised after adding DATEM which indicated the formation of entanglements that resemble increased gluten average molar mass of unlinked polymer [18]. However, the presence of AA, urea, and DTT in gluten decreased η0. Gliadins have been attributed with the viscous properties of gluten; they do not form interchain disulfide bonds and thus represent the unlinked polymer of gluten. Therefore, physical proximity of gliadin chains has aggregated and arrived to a critical molecular size for the onset of entanglement. Gliadins are now behaving as larger molecular size polymer with higher frictional factor and this could have happened by the sum of new hydrophobic and hydrophilic interactions of gliadins-DATEMgliadins.
5.1.2. Effect of DATEM, AA, Urea, and DTT on Gluten Coefficients from Burgers Model during Recovery Phase
In recovery phase, there was zero shear stress from the rheometer on gluten and gluten molecules naturally regained its relaxed position. In Figure 1, the result showed that as the higher concentration of DATEM was added, the lower gluten recovery compliance was obtained. In Table 2, Jr0 (elastic properties) and Jr1 (viscoelastic properties) of gluten during recovery showed significant reduction after treated with DATEM which is similar to creep parameters. For AA, urea, and DTT, the recovery curves were shifted to higher range of compliance (Figure 1), which indicated that gluten had lost more energy during recovery to its original position compared to control. For Burgers coefficients, the parameters from recovery phase exhibited the same trend in which the values were significantly increased after treated with AA, urea, and DTT. However, delayed viscoelastic time of gluten (tr1) was not significantly different after treating with every compound.
5.2. Discrimination of Flour Samples and Relationship of Parameters
The mixing and baking properties of treated flour samples were analyzed in order to demonstrate relationship with regressed parameters obtained from Burgers model. The correlation was depicted in a bi-plot graph of principal component analysis (PCA) based on variation. For each PCA graph, variables with higher contributors were used and variables with low variance contribution (less than 50%) were discarded. For PCA of DATEM, the remaining contributors explained 85.1% of the variance (Figure 2). The result showed that DATEM affected the viscoelastic parameters (Jr1 and J1) during creep and recovery and were the main contributors (PC 1), while, loaf volume (LV) was the secondary contributor (PC 2) to this set of sample variance. Thus, the effect of DATEM was greater on the viscoelastic properties (the gradient on the first component had higher variance) than in loaf volume (LV) (gradient in the second component had lower variance). For PCA of AA, the selected contributors increased total explained variance to 85.2% (Figure 3). Viscoelasticity (J1) was the main contributor (PC 1) to the variance, while flour protein (FP) was the secondary contributor (PC 2) to this set of sample variance. For PCA of urea, the selected contributors increased total explained variance to 85.7% (Figure 4). Elasticity (J0) was the main contributor (PC 1), while loaf volume (LV) was the secondary contributor (PC 2) to this set of sample variance.
For PCA of DTT, the selected contributors increased total explained variance to 81.5% (Figure 5). Dough development time (DT) during mixing was the main contributor (PC 1), while viscoelasticity (J1) was the secondary contributor (PC 2) to this set of sample variance.
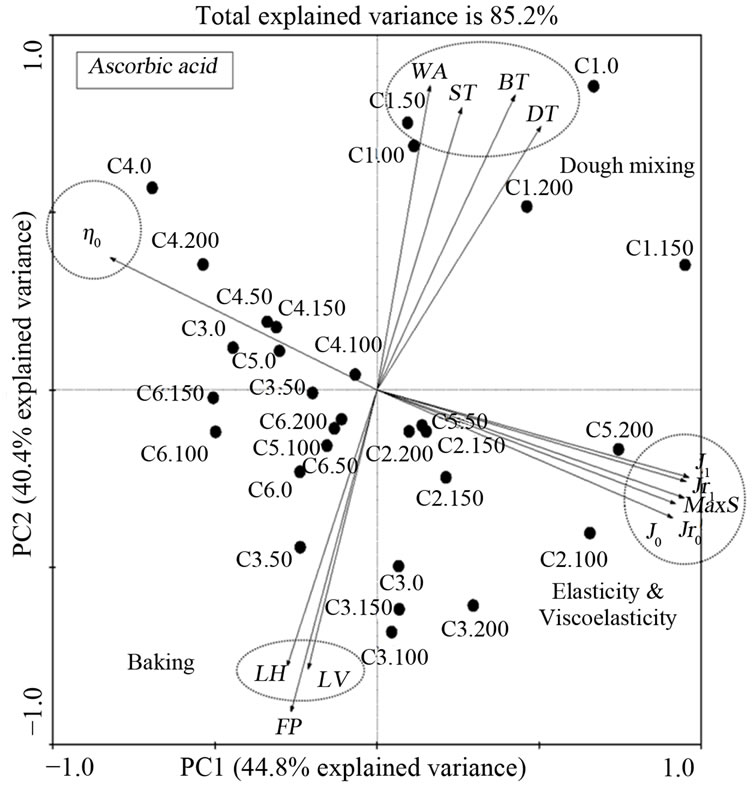
Figure 3. Principle component analysis of gluten from a set of 22 hard red winter wheat samples with ascorbic acid treatment involving 13 indicators of dough and gluten quality (dough mixing and viscoelasticity of gluten) and one indicator of gluten quantity (flour protein) from total of 29 variables.

Figure 4. Principle component analysis of gluten from a set of 22 hard red winter wheat samples with urea treatment involving 13 indicators of dough and gluten quality (dough mixing and viscoelasticity of gluten) and one indicator of gluten quantity (flour protein) from total of 29 variables.
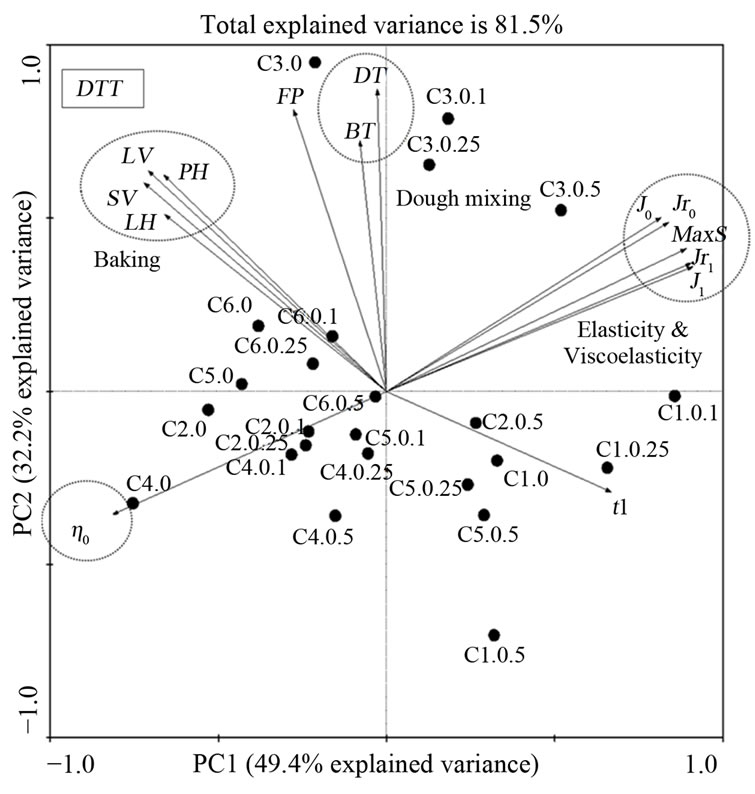
Figure 5. Principle component analysis of gluten from a set of 22 hard red winter wheat samples with DTT treatment involving 14 indicators of dough and gluten quality (dough mixing and viscoelasticity of gluten) and one indicator of gluten quantity (flour protein) from total of 29 variables.
From all of the PCA results, it was demonstrated that coefficients from Burgers model are helpful in discriminating these samples properties because most parameters from Burgers model are the main contributors except loaf volume and dough development time. Overall, maximum strain, J0, J1, Jr0 and Jr1 were highly correlated to each other and negatively correlated to zero shear viscosity (η0). These observations are in agreement with previous finding [19]. The regressed coefficients from Burgers model demonstrated that they were independent of baking and mixing variables and their variances were smaller compared to those of the viscoelastic properties.
6. Conclusion
DATEM affected viscoelastic properties of gluten differently compared to AA, urea, and DTT. DATEM decreased elasticity and viscoelasticity while increasing viscosity of gluten. AA, urea, and DTT had opposite effects with increased elasticity and viscoelasticity and decreased viscosity of gluten. This study confirmed that Burgers model clearly distinguished elasticity, viscoelasticity, and viscosity portions of gluten in terms of regressed parameters. The model allowed us to directly compare individual portions from creep recovery tests. Furthermore, it was confirmed that parameters from Burgers model could assist in discriminating gluten samples based on their specific rheological properties and serve as a tool to explain changes in their structures.
7. Acknowledgements
Authors would like to acknowledge Zorba Josué Hernández Estrada from CINVESTAV Querétaro, Mexico and Dr. Mark E. Payton from Oklahoma State University for their technical assistance in interpolating and modeling creep-recovery experimental data.
REFERENCES
- H. Wieser, Food Microbiology, Vol. 24, 2007, pp. 115- 119. http://dx.doi.org/10.1016/j.fm.2006.07.004
- I. J. Joye, B. Lagrain and J. A. Delcour, Journal of Cereal Science, Vol. 50, 2009, pp. 1-10. http://dx.doi.org/10.1016/j.jcs.2009.04.002
- M. Gómez, S. del Real, C. M. Rosell, F. Ronda, C. A. Blanco and P. A. Caballero, European Food Research and Technology. Vol. 219, 2004, pp. 145-150. http://dx.doi.org/10.1007/s00217-004-0937-y
- S. R. Hughes, “Effect of Processing on Gas Cell Area and Sphericity of Foam Dough: A Microscopy Study,” M.S. Thesis, Oklahoma State University, Stillwater, 2011.
- L. Stampfli, B. Nersten and E. L. Molteberg, Food Chemistry, Vol. 57, 1996, pp. 523-530. http://dx.doi.org/10.1016/S0308-8146(96)00011-8
- P. D. Ribotta, G. T. Pérez, A. E. León and M. C. Añón, Food Hydrocolloids, Vol. 18, 2004, pp. 305-313. http://dx.doi.org/10.1016/S0268-005X(03)00086-9
- A. Aamodt, E. M. Magnus and E. Mosleth Fr., Cereal Chemistry, Vol. 81, 2004, pp. 722-734. http://dx.doi.org/10.1094/CCHEM.2004.81.6.722
- A. Aamodt, E. M. Magnus, K. Hollung, A. K. Uhlen and E. M. Færgestad, Journal of Food Science, Vol. 70, 2005, pp. C214-C221. http://dx.doi.org/10.1111/j.1365-2621.2005.tb07128.x
- C. Bollaı́n and C. Collar, Food Hydrocolloids, Vol. 18, 2004, pp. 499-507. http://dx.doi.org/10.1016/j.foodhyd.2003.08.007
- F. R. Jacobsberg, S. L. Worman and N. W. R. Daniels, Journal of the Science of Food and Agriculture, Vol. 27, 1976, pp. 1064-1070. http://dx.doi.org/10.1002/jsfa.2740271113
- N. R. Ponzio, C. Ferrero and M. C. Puppo, International Journal of Food Properties, Vol. 16, 2011, pp. 33-44. http://dx.doi.org/10.1080/10942912.2010.501467
- B. Ying, L. Jun, F. Yunzi, C. Zhuo and L. Zaigui, Journal of the Science of Food and Agriculture, Vol. 89, 2009, pp. 227-231. http://dx.doi.org/10.1002/jsfa.3430
- B. S. Khatkar, Journal of the Science of Food and Agriculture, Vol. 85, 2005, pp. 337-341. http://dx.doi.org/10.1002/jsfa.1974
- AACC International 2000, “Approved Methods of Analysis, 10th Edition, Method 10-10.03. Optimized StraightDough Bread-Baking Method: Approved November 8, 1995; Method 54-21.02. Rheological Behavior of Flour by Farinograph: Approved November 8,” AACC International, St Paul, 1995.
- D. Zhao, S. Mulvaney, R. Chinnaswamy, P. Rayas-Duarte, B. Allvin and M. Wang, Journal of Cereal Science, Vol. 52, 2010, pp. 432-437. http://dx.doi.org/10.1016/j.jcs.2010.07.007
- C. J. Ft. Braak and P. Šmilauer, “CANOCO Reference Manual and CanoDraw for Windows User’s Guide: Software for Canonical Community Ordination (Version 4.5),” Ithaca, 2002. www.canoco.com
- P. Legendre and L. Legendre, “Numerical Ecology,” 2nd English Edition, Elsevier, Amsterdam, 1998.
- T. G. Mezger, “The Rheology Handbook,” 2nd Edition, Vincentz Network, Hannover, 2006.
- F. Van Bockstaele, I. De Leyn, M. Eeckhout and K. Dewettinck, Journal of Food Engineering, Vol. 107, 2011, pp. 50-59. http://dx.doi.org/10.1016/j.jfoodeng.2011.06.001
NOTES
*Corresponding author.