Journal of Modern Physics
Vol.3 No.5(2012), Article ID:19235,5 pages DOI:10.4236/jmp.2012.35050
Impedance Spectroscopy of Ba5GdTi3V7O30
1Department of Physics, Betnoti College, Mayurbhanj, India
2Department of Physics, Rajib Gandhi University, Indian Institute for Information Technology, Krishna, India
3Department of Physics, Institute for Technical Education and Research, Bhubaneswar, India
Email: *ps_rilly@yahoo.com
Received December 12, 2011; revised January 6, 2012; accepted January 16, 2012
Keywords: Ceramics; Dielectric Properties; Electrical Conductivity
ABSTRACT
The polycrystalline sample of Ba5GdTi3V7O30, a member of tungsten bronze structural family, was prepared by a hightemperature solid-state reaction technique. A preliminary X-ray diffraction analysis suggests the formation of single-phase compound with orthorhombic structure. The effect of temperature on impedance parameters was studied using an impedance analyzer in a wide frequency range (102 - 106 Hz) at different temperatures. The real and imaginary part of complex impedance traces semicircle(s) in the complex plane. The temperature dependent plots reveal the presence of both bulk and grain boundary effects. The bulk resistance of the material decreases with rise in temperature. This exhibits a typical negative temperature coefficient of resistance (NTCR) behavior of the material. The modulus analysis suggests a possible hopping mechanism for electrical transport processes of the material. The nature of variation of dc conductivity suggests Arrhenius type of electrical conductivity.
1. Introduction
Tungsten bronze (TB) ceramics constitute a family of materials that have got special attention due to their technological applications [1-4] including ferroelectric memory devices, electro optical devices, and actuators [5]. Ferroelectric ceramics are of great interest for applications such as dielectrics for capacitors, infrared detectors, electro-mechanical converters, electroptical modulators, etc. The TB structure consists of a skeleton framework of BO6 octahedra, sharing corners to form three different types of tunnels parallel to the c-axis in the unit cell of a general formula, [(A1)2(A2)4C4][(B1)2(B2)8]O30 [6]. It has been found that their physical properties can be improved by different ionic substitutions at above-mentioned sites [7-10]. The advent of nanoscience & technology have completely changed the direction of studies on eco-friendly (lead-free) materials bringing them at the forefront of scientific developments with considerably enhanced physical properties suitable for a wide variety of challenging applications. A number of lead free niobates such as Ba5RTi3Nb7O30, Ba3R3Ti5Nb5O30, and Ba4R2Ti4Nb6O30 of BaO-R2O3-TiO2-Nb2O5 (R = Dy, La, Nd, Sm, and Y) system and vanadates like Ba4SrSmTi3V7O30 and Ba4SrDyTi3V7O30 [11-17] have shown very interesting electrical properties, which can further be applicable for potential device applications. In view of this, we have synthesized and studied the structural and electric properties of rare earth doped Ba5GdTi3V7O30 vanadate.
2. Experimental
2.1. Sample Preparation
Ba5GdTi3V7O30 (BGTV) vanadate has been synthesized by a high-temperature solid-state reaction. First high purity (AR grade) oxides and carbonates, BaCO3, Gd2O3, TiO2, V2O5 (M/S Sarabhai M. Chemicals, India) in a suitable stoichiometry were weighed and grounded homogeneously in an agate mortar in air atmosphere for 2 h followed by in methanol medium for 2 h. Subsequently, the grounded mixtures were calcined at an optimized temperature and time (950˚C for 24 h). The calcined powders were compacted into disks of 10 mm diameter and 1 - 2 mm thickness at the pressure of 4 × 10⁶ N/m2 using isostatic press using polyvinyl alcohol as a binder, which was burnt out during high temperature sintering. The pallets were sintered in high purity (99.9%) alumina crucible at 950˚C for 24 h.
2.2. Characterization
The phase formation in the calcined product has been confirmed by X-ray diffraction (XRD) analysis using an X-ray powder diffractometer (Rigaku, Miniflex) at room temperature with CuKα radiation (λ = 1.5405 Å) in a wide range of Bragg’s angles 2θ (20˚ ≤ 2θ ≤ 80˚) having a scanning rate of three degree per minute. The electrical impedance (Z), capacitance (C) and loss tangent have been measured as a function of frequency (100 Hz - 1 MHz) at different temperatures (33˚C - 500˚C) with a computer-controlled impedance analyzer (PSM 1735, model: N4L). For the measurements, Ag paste was painted on either side of the disk and fired at 150˚C for 1 hr.
3. Results and Discussion
3.1. Impedance Study
Complex impedance spectroscopy (CIS) [18] is a technique to characterize the electrical behavior of a system in which a number of strongly coupled processes exist. It helps to separate grain (intragrain) and grain boundaries (intergrain) contributions in transport properties of the material. The detailed studies of structural and dielelectric analysis of this material are communicated elsewhere [19].
Figure 1 shows temperature dependence Nyquist Plots (fitted complex impedance spectrum) of BGTV measured at some selected temperatures (300˚C - 500˚C). Also, it can be noticed that the complex impedance plots get depressed and the center of the arc lie below the real (Z″) axis, which confirms the polydispersive (multi-Debye type) nature of dielectric relaxation in BGTV. This may be due to the presence of distributed elements in the material-electrode system. These depressed semicircles are not due to defects or interfacial capacitance. These may be due to the relaxation times of which are assumed to be superimposed with the actual ceramics response [20].
The semicircles at the high frequency end correspond to the response of the bulk of the ceramic grains and the low frequency semicircles correspond to grain boundary effects [21]. The decrease in area of the semicircles is observed on increasing temperature in the compound at higher temperatures.
Figure 2 shows the variation of Z′ as a function of frequency (0.1 - 1000 kHz) at different temperatures (300˚C - 500˚C). The plots show a low frequency dispersion followed by a plateau region, and finally all the curves merge/coalesce above 10 kHz irrespective of temperature. Initial Z′ values decrease with frequency; this may be due to a slow dynamics relaxation process in the material probably due to space charges. At high temperatures, low frequency the appearance of plateau region may be related to frequency invariant (dc conductivity) electrical property of the material.
The final merger of the pattern at higher frequency may be attributed to the release of space charge as a result of
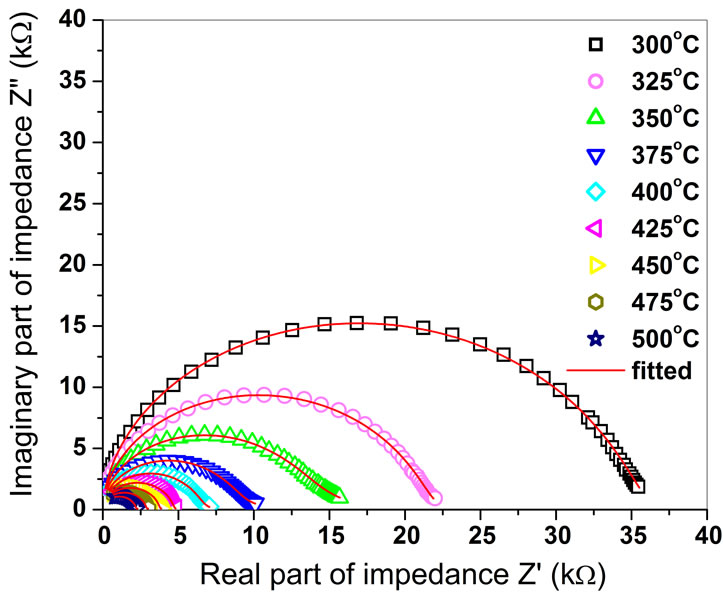
Figure 1. Nyquist plot of Ba5GdTi3V7O30.
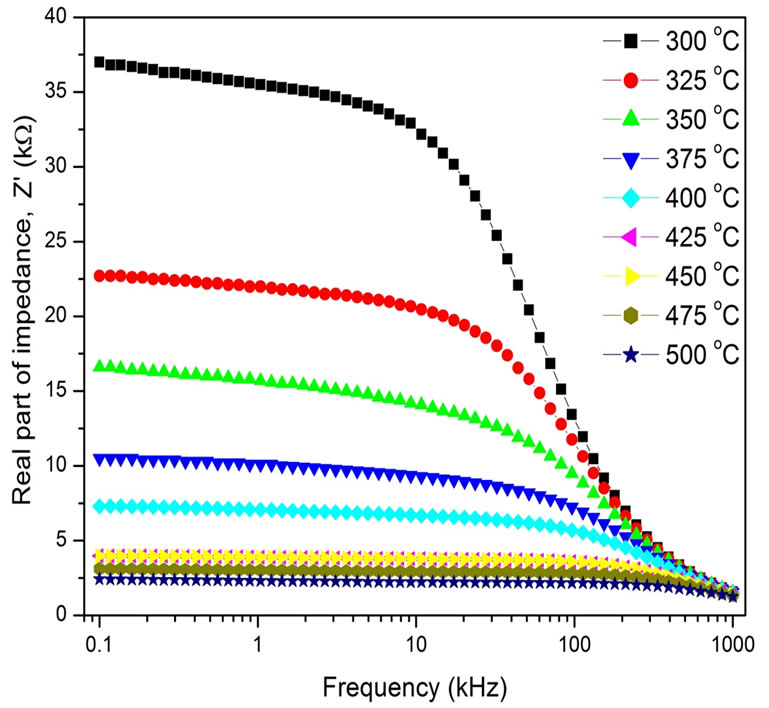
Figure 2. Variation of (a) real part of complex impedance (Z′) with frequency of Ba5GdTi3V7O30.
reduction in the barrier properties of material with the rise in temperature and may be a responsible factor for the enhancement of AC conductivity of material with temperature at higher frequencies [22]. It is observed that the value of Z′ decreases with rise in both temperature and frequency, which indicates the existence of negative temperature coefficient of resistance (NTCR) type behavior in the material as is observed in semiconductors.
Figure 3 shows the frequency-temperature dependence of Z″ (usually called as loss spectrum). Like Z′, the value of Z″ decreases on increasing frequency at all the temperatures up to 150˚C. The non-existence of Z″ peak in this temperature region is due to the absence of current dissipation in the material.
Subsequently, the appearance of peak in the loss spectrum (>175˚C) suggests the existence of relaxation properties of the material. The broadening of peaks on increasing temperature confirms the existence of temperature dependent relaxation phenomena in the material.
 Frequency (kHz)
Figure 3. Variation of and imaginary part of complex impedance (Z″) of Ba5GdTi3V7O30.
This may be due to the immobile species/electrons at low temperatures and defect/vacancies at high temperatures. Further, the magnitude of Z″ decreases with the shift of peaks towards higher frequency side. Finally, all the curves merge in the high-frequency region, which may be due to the accumulation of space charge of the material.
3.2. Conductivity Analysis
Electrical conductivity (σdc) is a thermally activated process and follows the Arrhenius law. The activation energy for conduction (Ea) of grains could be calculated from the slope of the straight line obtained from log σdc versus 1/T plot. Figure 4 shows the Arrhenius plot of the dc conductivity evaluated from the impedance plots of BSDTV sample as a function of temperature, and the corresponding activation energy are found to be 0.41 eV. It may be interpreted as the motion of oxygen vacancies, and are consistent with those obtained by the present impedance studies and also with earlier reports [23].
3.3. Modulus Spectrum Study
The advantage of adopting complex electric modulus formalism is that it can discriminate electrode polarization from grain boundary conduction process.
In polycrystalline materials, impedance formalism might emphasis grain boundary conduction process, while bulk effects on frequency domain would dominate in the electric modulus formalism. The use of modulus spectroscopy plot is particularly useful for separating components with similar resistance but different capacitance.
Figure 5 shows the complex modulus spectrum (M′ versus M′′) of BGTV at selected temperatures. The asymmetric semicircular arcs are observed in this plot which also appears to overlap at all the temperatures. This confirms the presence of electrical relaxation phenomena in this material. It is clear that the modulus plane shows a single semicircle.
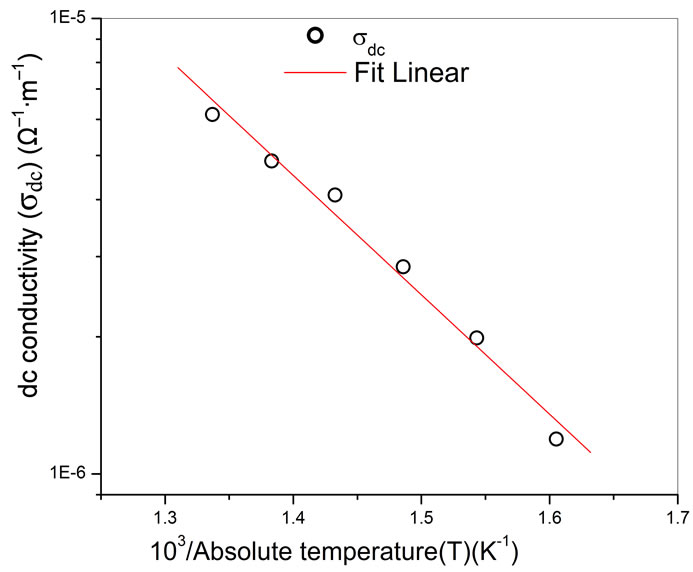
Figure 4. Variation of σdc with 103/T of Ba5GdTi3V7O30.
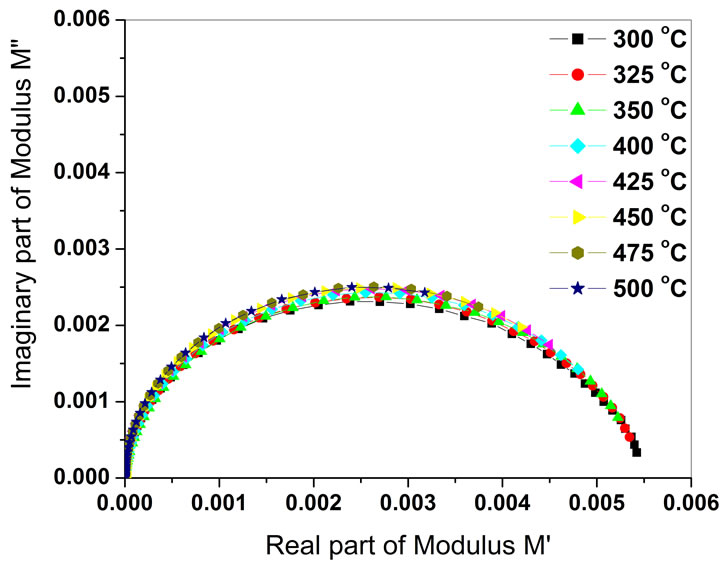
Figure 5. Complex modulus spectrum (M′′ vs M′) of Ba5GdTi3V7O30 at various temperatures.
The intercept on the real axis indicates the total capacitance contributed by the grain. The modulus spectrum shows a marked change in its shape with rise in temperature suggesting a probable change in the capacitance values of the material as a function of temperature.
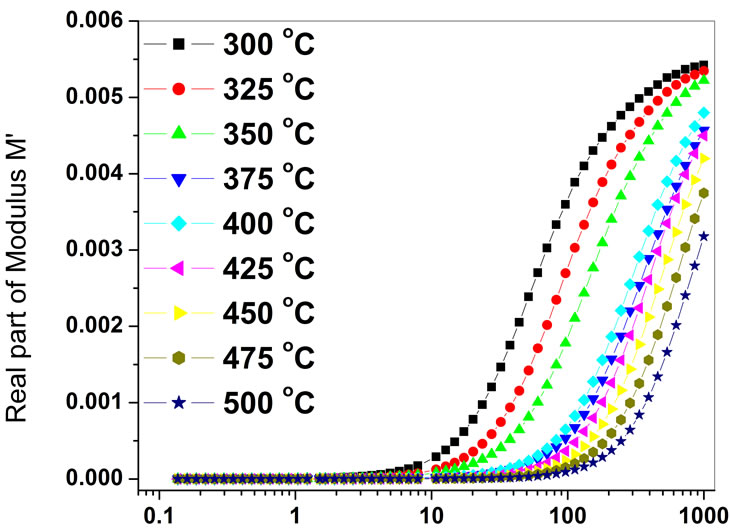
Variation of real (M′) parts of the electric modulus as a function of frequency at various temperatures has been shown in Figure 6. It is evident from the figure that for each temperature, M′ reaches constant value at higher frequencies.
Also, at lower frequencies M′ approaches to zero, confirming the presence of an appreciable electrode and/or ionic polarization in temperature studied. The value of M′ increases from the low frequency towards a high frequency limit and the dispersion shift to high frequency as temperature increases.
4. Conclusion
The polycrystalline sample of BGTV was prepared by a high-temperature solid-state-reaction route. From the impedance and modulus spectroscopic studies the material showed relaxation effects which are non-Debye type.
 Frequency (kHz)
Figure 6. Variation of real part of complex modulus (M′) of Ba5GdTi3V7O30 with frequency.
The relaxation frequencies shifted to higher frequency side with increase in temperature. The complex impedance plots reveal the main contribution of bulk in it. The variation of dc conductivity (bulk) as a function of temperature demonstrates that the compound exhibits Arrhenius type of electrical conductivity.
5. Acknowledgements
The authors P. S. Sahoo and B. B. Mohanty are thankful to N O U, Takatpur, Baripada and Prof. Shishupal Sadual, Principal Betnoti College, Betnoti, Mayurbahnj, Odisha, India, for co-operating them to do their research work. The author P. S. Sahoo also acknowledged U.G.C. for providing financial support through Major Research Project.
REFERENCES
- L. X. Zhang, W. Chen and X. Ren, “Large Recoverable Electrostrain in Mn-Doped (Ba,Sr) TiO3 Ceramics,” Applied Physics Letters, Vol. 85, No. 23, 2004, pp. 5658- 5660. doi:10.1063/1.1829394
- W. L. She, K. K. Lee and W. K. Lee, “All Optical QuasiSteady-State Photorefractive Spatial Solitons,” Physical Review Letters, Vol. 85, No. 12, 2000, pp. 2498-2501. doi:10.1103/PhysRevLett.85.2498
- M. E. Lines and A. M. Glass, “Principles and Applications of Ferroelectric and Related Materials,” Clarendon Press, Oxford, 1977.
- B. Jaffe, W. R. Cook and H. Jaffe, “Piezoelectric Ceramics,” Academic Press, London, 1971.
- K. Uchino, “Piezoelectric Actuators and Ultrasonic Motors,” Kluwer Academics, Boston, 1997.
- R. R. Neurgaonkar, M. H. Kalisher, T. C. Lim, E. J. Staples and K. L. Keester, “Czochralski Single Crystal Growth of Sr.61Ba39Nb2O6 for Surface Acoustic Wave Applications,” Materials Research Bulletin, Vol. 15, No. 9, 1980, pp. 1235-1240. doi:10.1016/0025-5408(80)90025-2
- W. Sakamoto, Y. Horie, T. Yogo and S. Hirano, “Synthesis and Properties of Highly Oriented (Sr, Ba)(Nb, Ta)2O6 Thin Films by Chemical Solution Deposition,” Japanese Journal of Applied Physics, Vol. 40, 2001, pp. 5599-5604. doi:10.1143/JJAP.40.5599
- P. Ganguly and A. K. Jha, “Investigations of Dielectric, Pyroelectric and Electrical Properties of Ba5SmTi3Nb7O30 Ferroelectric Ceramic,” Journal of Alloys and Compounds, Vol. 484, No. 1-2, 2009, pp. 40-44. doi:10.1016/j.jallcom.2009.05.034
- M. R. Ranga Raju, R. N. P. Choudhary and S. Ram, “Dielectric and Electrical Properties of Sr5EuCr3Nb7O30 Nanoceramics Prepared Using a Novel Chemical Route,” Physica Status Solidi B, Vol. 239, No. 2, 2003, pp. 480- 489.
- P. V. Bijumon, V. Kohli, O. Parkash, M. R. Varma and M. T. Sebastian, “Dielectric Properties of Ba5MTi3A7O30 [M = Ce, Pr, Nd, Sm, Gd, Dy and Bi; A = Nb, Ta] Ceramics,” Materials Science and Engineering: B, Vol. 113, No. 1, 2004, pp. 13-18. doi:10.1016/j.mseb.2004.05.023
- M. R. Ranga Raju and R. N. P. Choudhary, “Structural, Dielectric and Electrical Properties of Sr5RTi3Nb7O30 (R = Gd and Dy) Ceramics,” Materials Letters, Vol. 57, No. 19, 2003, pp. 2980-2987. doi:10.1016/S0167-577X(02)01408-8
- H. Zhang, Z. Q. Liu, C. L. Diao and R. Z. Yuan and L. Fang, “Structural and Dielectric Properties of Sr4Ln2Ti4Ta6O30 (Ln = Nd and Sm) Ceramics,” Materials Letters, Vol. 59, No. 21, 2005, pp. 2634-2637. doi:10.1016/j.matlet.2005.04.006
- X. H. Zheng and X. H. Zhou, “Crystal Structure and Dielectric Properties of La3+ Substituted Ba5LaTi3Ta7O30 Ceramics,” Journal of Materials Science: Materials in Electronics, Vol. 17, No. 12, 2006, pp. 987-991. doi:10.1007/s10854-006-9007-5
- L. Fang, H. Zhang, J. F. Yang, X. K. Hong and F. C. Meng, “Preparation, Characterization and Dielectric Properties of Sr5LnTi3Ta7O30 (Ln=La, Nd) Ceramics,” Journal of Materials Science: Materials in Electronics, Vol. 15, No. 6, 2004, pp. 355-357. doi:10.1023/B:JMSE.0000025677.53710.c8
- X. M. Chen, Y. Yuan and Y. H. Sun, “Low Loss Dielectrics of Ba6Ti2Ta8O30 and Sr6Ti2Ta8O30 with TungstenBronze Structure,” Solid State Communications, Vol. 125, 2003, pp. 449-452.
- P. S. Sahoo, A. Panigrahi, S. K. Patri and R. N. P. Choudhary, “Structural, Dielectric, Electrical and Piezoelectric Properties of Ba4SrRTi3V7O30 (R=Sm, Dy) Ceramics,” Central European Journal of Physics, Vol. 6, No. 4, 2008, pp. 843-848. doi:10.2478/s11534-008-0112-3
- P. S. Sahoo, A. Panigrahi, S. K. Patri and R. N. P. Choudhary, “Ferroelectric Phase Transition in Ba4SrSmTi3V7O30 Ceramics,” Materials Letters, Vol. 63, No. 11, 2009, pp. 864-866. doi:10.1016/j.matlet.2009.01.053
- J. R. MacDonald, “Impedance Spectroscopy,” Wiley, New York, 1987.
- P. S. Sahoo, B. B. Mohanty, M. P. K. Sahoo and R. N. P. Choudhary, “Dielectric Anomaly in Ba5GdTi3V7O30 Ceramics,” Journal of Alloys and Compounds, (Communicated).
- K. Prasad, A. Kumar, et al., “Relaxor Behaviour of Pb[(Mg3/4Co1/4)1/3Nb2/3]O3 Ceramic,” Solid State Ionics, Vol. 176, No. 17-18, 2005, pp. 1641-1646. doi:10.1016/j.ssi.2005.04.004
- K. Sambasiva Rao, P. Murali Krishna, D. Madhava, Prasad, J.-H. Lee and J.-S. Kim, “Electrical, Electromechanical and Structural Studies of Lead Potassium Samarium Niobate Ceramics,” Journal of Alloys and Compounds, Vol. 464, No. 1-2, 2008, pp. 497-507. doi:10.1016/j.jallcom.2007.10.023
- Lily, K. Kumari, K. Prasad and R. N. P. Choudhary, “Impedance Spectroscopy of (Na0.5Bi0.5)(Zr0.25Ti0.75)O3 Lead-Free Ceramic,” Journal of Alloys and Compounds, Vol. 453, No. 1-2, 2008, pp. 325-331. doi:10.1016/j.jallcom.2006.11.081
- J. S. Kim, I. W. Kim, C. W. Ahn, et al., “Conduction Behavior of SrBi2Ta2O9 Thin Film Grown by Pulsed Laser Deposition,” Japanese Journal of Applied Physics, Vol. 41, 2002, pp. 6785-6789. doi:10.1143/JJAP.41.6785
NOTES
*Corresponding author.