![]() 31">
31">
Department of Anatomy, Shinshu Institute of Alternative Medicine and Welfare, Nagano and Department of Anatomy and Cell Biology, Shinshu University School of Medicine, Matsumoto, Japan.
Email: nagatas@cnet.ne.jp
Received 8 March 2010; revised 10 April 2010; accepted 8 May 2010.
Keywords: Mitochondrial Macromolecular Syntheses; Aging Animals Labeled; 3H-Precursors; Electron Microscopic Radioautography
ABSTRACT
In order to study the aging changes of intramitochondrial macromolecular synthesis in various organs of aging animals during the development and aging, 10 groups of developing and aging mice, each consisting of 3 individuals, total 30, from fetal day 19 to postnatal newborn at day 1, 3, 9, 14 and adult at month 1, 2, 6, 12 to 24 were injected with 3H-thymidine a DNA precurson, another 10 groups consisting of 3 individuals, total 30, were injected with 3H-uridine a RNA precursor, and another 10 groups of 30 individuals were injected with 3H-leucine a protein precursor, total 90 individuals. Then, all the animals were sacrificed 1 hr after the injections and the liver tissues, the lung tissues, the kidney tissues, the testis and ovary tissues, the adrenal tissues were taken out, fixed and processed for electron microscopic radioautography. On electron microscopic radioautograms obtained from each animal, ten photographs in respective groups, numbers of mitochondria per cell profile area, numbers of labeled mitochondria per cell and the mitochondrial labeling index (LI) labeled with 3H-thymidine showing DNA synthesis, LI labeled with 3H-uridine showing RNA synthesis, and LI labeled with 3H-leucine showing protein synthesis, in various organs, were counted and the results in various organs in respective aging groups were compared, respectively. From the results, it was demonstrated that the numbers of mitochondria in hepatocytes as well as in 3 zones of the adrenal cortex, the zona glomerulosa, fasciculata and reticularis of mice at various ages increased from fetal day 19 to postnatal month 1 due to development and aging of animals. On the other hand, the numbers of labeled mitochondria and the labeling indices of intramitochondrial DNA syntheses incorporating 3H-thymidine in hepatocytes and 3 zones of cortical cells increased from fetal day 19 to postnatal month 1 and decreased to month 24. The numbers of labeled mitochondria and the labeling indices of intramitochondrial RNA syntheses incorporating 3H-uridine in hepatocytes and 3 zones of cortical cells increased from fetal day 19 to postnatal month 1 and decreased to month 24. The numbers of labeled mitochondria and the labeling indices of intramitochondrial RNA syntheses incorporating 3H-uridine in hepatocytes and 3 zones of cortical cells increased from fetal day 19 to postnatal month 1 and decreased to month 24. Moreover, some other organs such as the lung and the testis were also review and discussed. From the results, it was shown that the activity of intramitochnodrial DNA synthesis, RNA synthesis, and protein synthesis in hepatocytes, adrenal cortical cells, pulmonary cells and testicular cells in developing and aging mice as well as some other organs increased and decreased due to development and aging.
1. INTRODUCTION
Intramitochondrial nucleic acid syntheses, both DNA and RNA, in mammalian and avian cells were first demonstrated morphologically by the present author by means of electron microscopic radioautography with accurate localization in primary cultured cells of the livers and kidneys of mice and chickens in vitro [1] and then in some other established cell lines such as HeLa cells [2-4] or mitochondrial fractions prepared from in vivo cells [5,6] It was later commonly found in various cells and tissues not only in vitro obtained from various organs in vivo [7-9] but also in vivo cells of various organs such as the salivary glands [10] the liver [11-16] the pancreas [17,18] the trachea [19-21] the kidneys [22] the testis [23,24] the uterus [25,26] the adrenals [27,28] the brains [29] the retina [30-32] of chickens, mice and rats. However, no other literature was available in other laboratory throughout the world. In our laboratory, the relationship between the intramitochondrial DNA synthesis and cell cycle was formerly studied and it was clarified that the intramitochondrial DNA synthesis was performed without nuclear involvement [33]. On the other hand, the relationship between the DNA synthesis and the aging of individual animals has not yet been clarified. This paper deals with the relationship between the DNA synthesis and development in adrenal cortical cells of mice in vivo at various developmental stages from fetal day 19 to postnatal day 14 by means of electron microscopic radioautography as a part of serial studies on special cytochemistry [34] and radioautographology [35].
2. METHODOLOGY
2.1. Animals
The liver, adrenal gland, lung and testis tissues were obtained from 30 groups of normal ddY strain mice, each consisting of 3 litter mates of both sexes, total 90, aged from embryonic day 19 to postnatal day 1, 3, 9 and 14 and month 1, 2, 6, 12 and 24. The embryonic age was based on observation of the vaginal plug of the female mice (vaginal plug = day 0). All the animals were housed under conventional conditions and bred with normal diet (mouse chow Clea EC2, Clea Co., Tokyo, Japan) with access to water ad libitum in our laboratory. They were administered with 3H-thymidine or 3H-uridine or 3H-leucine, DNA, RNA and protein precursors, respectively, and the liver, adrenal and testis tissues were processed for light and electron microscopic radioautography [34,35]. All the procedures used in this study concerning the animal experiments were in accordance with the guidelines of the animal research committee of Shinshu University School of Medicine as well as the principles of laboratory animal care in NIH publication No. 86-23 (revised 1985).
2.2. Technique of Electron Microscopic Radioautography
All the animals were injected intraperitoneally with 3H-thymidine (Amersham, England, specific activity 877 GBq/mM) or 3H-uridine (Amersham, England, specific activity 1.11 TBq/mM) or 3H-4,5-leucine (Amersham, England, specific acitivity 1002 GBq/ mM) in saline, at 9 a.m., one hour before sacrifices. The dosage of injections was 370 KBq/gm body weight. The animals were perfused at 10 a.m., one hour after the injection, via the left ventricles of the hearts with 0.1 m cacodylate-buffered 2.5% glutaraldehyde under Nembutal (Abbott Laboratories, Chicago, ILL, USA) anesthesia. The right medical lobe of the liver, the superior lobe of the right lung, the right adrenal gland and the right testis were taken out, excised and 3 small tissue pieces from the respective organs (1 mm × 1 mm ×1 mm) were immersed in the same fixative at 4˚C for 1 hr., followed by postfixation in 1% osmium tetroxide in the same buffer at 4˚C for 1 hr., dehydrated in graded series of ethanol and acetone, and embedded in epoxy resin Epok 812 (Oken, Tokyo, Japan).
For light and electron microscopic radioautography, thick (2.0 µm) or semithin (0.2 µm) sections were cut in sequence on a Porter-Blum MT-2B ultramicrotome (Dupont-Sorvall, Newtown, MA, USA) using glass knives. The sections were collected on either collodion coated copper glass slides or grid meshes (VECO, Eerbeek, Netherlands), coated with either Konica NR-M2 (LM) or NR-H2 (EM) radioautographic emulsion (Konica, Tokyo, Japan) by either dipping or wire-loop method [18,35-37] They were stored in dark boxes containing silica gel (desiccant) at 4˚C for exposure. After the exposure for several months, the specimens were processed for development in either SD-X1 developer at 20˚C (LM) or freshly prepared gold latensification solution for 30 sec at 16˚C and then in fresh phenidon developer for 1 min at 16˚C in a water bath, rinsed in distilled water and dried in an oven at 37˚C overnight, stained with either toluidine blue (LM) or lead citrate solution for 3 min and coated with carbon (EM). The electron microscopic radioautograms were examined in a JEOL JEM-4000EX electron microscope (JEOL, Tokyo, Japan) at accelerating voltages of 400 kV for observing thick specimens [33-35].
2.3. Quantitative Analysis of Electron Micrographs
For quantitative analysis of electron micrographs, twenty EM radioautograms showing cross sections of respective cell types from each group, based on the electron microscopic photographs taken after observation on at least 100 each cell type obtained from each animal, and at least 10 cells were analyzed to calculate the total number of mitochondria in each cell and the number of labeled mitochondria covered with silver grains by visual grain counting.
On the other hand, the number of silver grains in the same area size as a mitochondrion outside cells was also calculated in respective specimens as background fog, which resulted in less than 1 silver grain (0.03/mitochondrial area) almost zero. Therefore, the grain count in each specimen was not corrected with background fog. From all the data thus obtained, the averages and standard deviations in respective aging groups were computed with a personal computer (Macintosh type 8100/ 100, Apple Computer, Tokyo, Japan). The data were stochastically analyzed using variance and Student’s t-test. The differences were considered to be significant at P value < 0.01.
3. THE LIVER
3.1. Number of Mitochondria of Mouse Hepatocytes
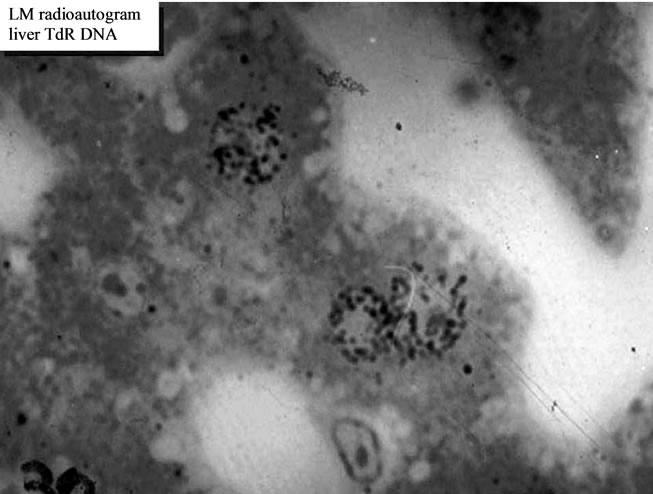
We studied the liver tissues of ddY strain mice at various ages from embryonic day 19 to postnatal 2 years [15,16]. Observing light microscopic microscopic radioautograms labeled with 3H-thymidine, the silver grains were found over the nuclei of some hepatocytes, demonstrating DNA synthesis (Figure 1). By electron microscopic radioautography, some nuclei and some mitochondria in hepatocytes in perinatal stages at embryonic day 19 (Figure 2), postnatal day 1, 3, 9 and day 14 (Figure 3) as well as young adult (Figure 4) and senesecent animals (Figure 5) were observed. However, those labeled hepatocytes were almost mononucleate cells (Figures 2-5) and only a few binucleate cells were found among the mononucleate hepatocytes [36]. In the labeled hepatocytes (Figures 1-5) the silver grains were mainly localized over the euchromatin of the nuclei and only a few or several silver grains were found over the mitochondria of these mononucleate hepatocytes [37]. To the contrary, most hepatocytes were not labeled with any silver grains in their nuclei nor cytoplasm, showing no DNA synthesis even after labeling with 3H-thymidine in aged adult and senescent animals at postnatal month 1 (Figure 4), 2, 6, 12 (Figure 5) and month 24. On the other hand, labeled binucleate hepatocytes over their nuclei were very rarely found only at the perinatal stages from postnatal day 1, 3 (Figure 6), 9 and 14 (Figure 7) but not after postnatal month 1 to senescent stages up to month 12 or 24. Among many unlabeled hepatocytes, most mononucleate and binucleate hepatocytes were observed to be labeled with several silver grains over their mitochondria due to the incorporations of 3H-thymidine especially at the perinatal stages from embryonic day 19 to postnatal day 1, 3, 9 and 14 (Figure 3). The localizations of silver grains over the mitochondria were mainly on the mitochondrial matrices but some grains over the mitochondrial membranes and cristae when observed by high power magnification (Figure 3).
For preliminary quantitative analysis on the number of mitochondria in 10 mononucleate hepatocytes whose
 34" height="296.59001159668 " />
Figure 1. LM radioautogram of the liver of an adlut mouse at postnatal month 1 labeled with 3H-thymidine, demonstrating DNA synthesis in the two nuclei. x 1,000.
 34" height="293.26501159668 " />
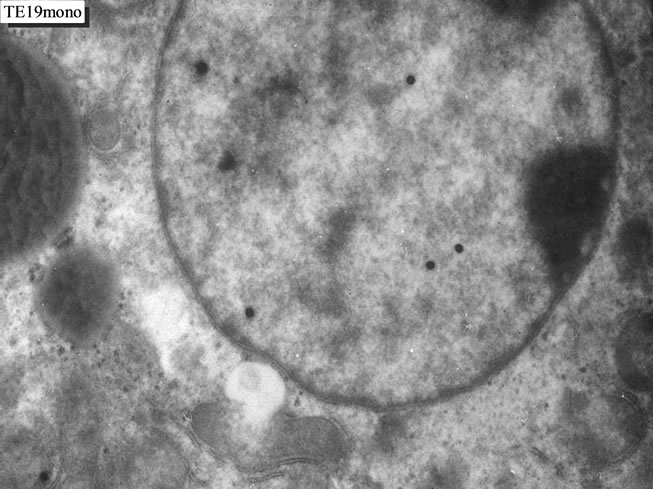
Figure 2. EM radioautogram of a mouse embryo liver aged at fetal day 19, labeled with 3H-thymidine, demonstrating DNA synthesis of a mononucleate hepatocyte. Silver grains are localized over euchromatin of the nucleus as well as over a few mitochondria. x 4,000.
539c9772-842e-4437-a070-65838291b74f.jpg" width="392.92000579834" height="294.40499420166 " />
Figure 3. EM radioautogram of a mouse liver aged at postnatal day 14, labeled with 3H-thymidine, demonstrating DNA synthesis of mononucleate hepatocyte. Silver grains are localized over euchromatin of the nucleus as well as over several mitochondria. x 4,000.
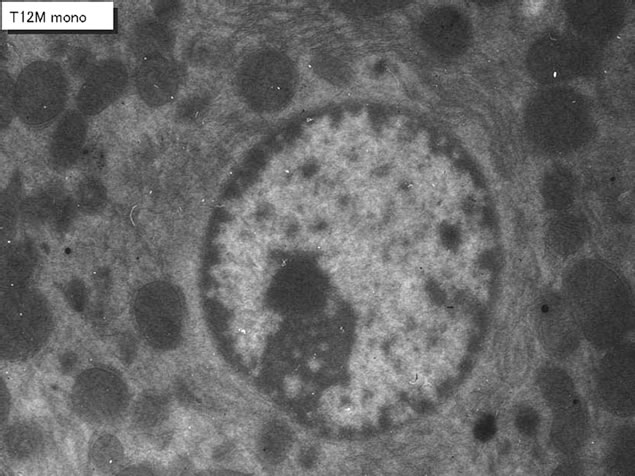
Figure 4. EM radioautogram of a senescent mouse aged at postnatal month 12, labeled with 3H-thymidine, demonstrating DNA synthesis of a mononucleiate hepatocyte. Silver grains are localized not over the nucleus but over a few mitochondria. x 3,000.
36c90c4c2a.jpg" width="383.04001159668" height="286.70998840332 " />
Figure 5. EM radioautogram of a newborn mouse aged at postnatal day 3, labeled with 3H-thymidine, demonstrating DNA synthesis of a binucleiate hepatocyte. Silver grains are localized not over the 2 nuclei but over a few mitochondria. x 3,000.
51c-4771-a1ea-c5151fd96fea.jpg" width="381.9" height="285.66501159668 " />
Figure 6. EM radioautogram of juvenile mouse aged at postnatal day 14, labeled with 3H-thymidine, demonstrating DNA synthesis of a binucleiate hepatocyte. Silver grains are localized over one of the 2 nuclei as well as over a few mitochondria. x 3,000.
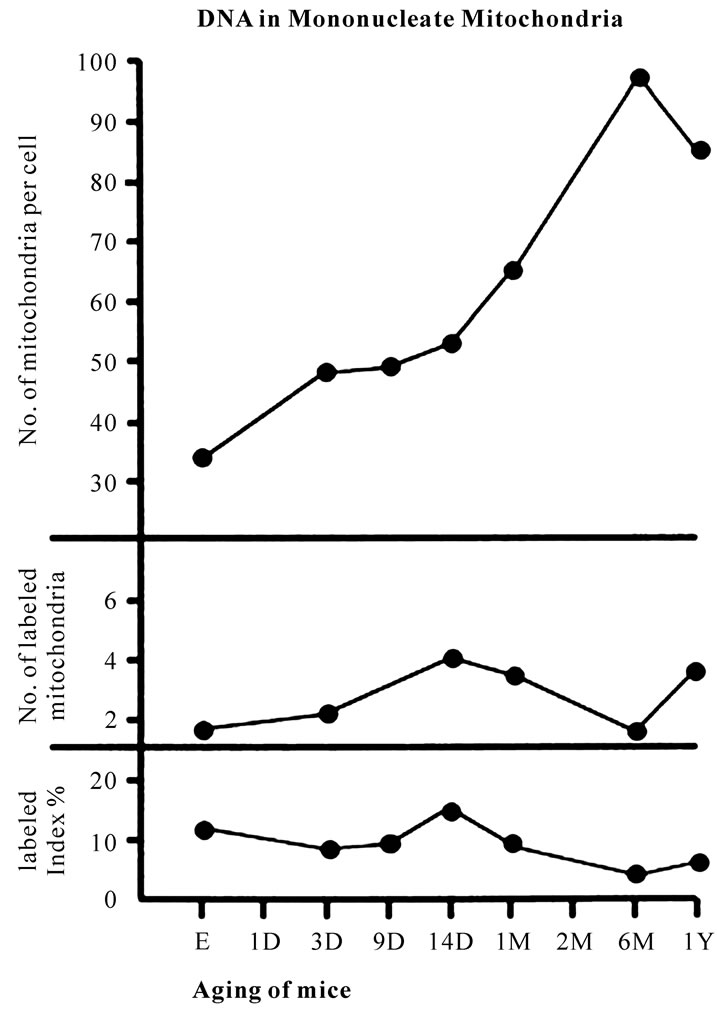
Figure 7. Transitional curves of the number of mitochondria per cell profile area (top), the number of labeled mitochondria per cell (middle) and the labeling index (bottom) of a monucleate hepatocyte in respective aging groups. The numbers and LI increased and decreased due to aging.
nuclei were labeled with silver grains and other 10 mononucleate hepatocytes whose nuclei were not labeled in each aging group injected with either 3H-thymidine revealed that there was no significant difference between the number of mitochondria and the labeling indices in both types of hepatocytes (P < 0.01). Thus, the number of mitochondria and the labeling indices were calculated in both types of hepatocytes with labeled or unlabeled nuclei at respective aging stages. The results obtained from the number of mitochondria in mononucleate hepatocytes showed an increase from the prenatal day to postnatal day 14 (26.2-34.5/cell), then to postnatal month 1-6 (89.2-97.1/cell), reaching the maximum, then decreased to year 1-2 (80.4-85.7/cell) as is shown in Figure 7 (top).
3.2. Mitochondrial DNA Synthesis of Mouse Hepatocytes
The results of visual counts on the number of mitochondria labeled with silver grains obtained from 10 mononucleate hepatocytes of each animal labeled with 3H-thymidine demonstrating DNA synthesis in 7 aging groups at perinatal stages, prenatal embryo day 19, postnatal day 3, 9 and 14, month 1, 6 and 12, are plotted in Figure 7 (middle). The labeling indices in respective aging stages were calculated from the number of labeled mitochondria (Figure 7 middle) and the number of total mitochondria per cell (Figure 7 top) which were plotted in Figure 7 (bottom), respectively. The results showed that the numbers of labeled mitochondria with 3H-thymidine showing DNA synthesis increased from prenatal embryo day 19 (3.8/cell) to postnatal day 14 (6.2/cell), reaching the maximum, and then decreased to month 6 (3.7/cell) and again increased to year 1 (6.0/cell), while the labeling indices increased from prenatal day 19 (11.8%) to postnatal day 14 (16.9%), reaching the maximum, then decreased to month 6 (4.1%) and year 1 (6.4%) and year 2 (2.3%). The increase of the total number of mitochondria in mononucleate hepatocytes was stochastically significant (P < 0.01), while the changes of number of labeled mitochondria and labeling index in mononucleate hepatocytes were not significant (P < 0.01).
As for the binucleate hepatocytes, on the other hand, because the appearances of binucleate hepatocytes showing silver grains in their nuclei demonstrating DNA synthesis were not so many in the adult and senescent stages from postnatal month 1 to 24, only binucleate cells at perinatal stages when reasonable numbers of labeled hepatocytes were found in respective groups were analyzed. The number of mitochondria in binucleate hepatocytes at postnatal day 1 to 14 kept around 80 (77-84/cell) which did not show such remarkable changes, neither increase nor decrease, as shown in mononucleate cells. Thus, the number of mitochondria per binucleate cell (Figure 8 top), the number of labeled mitochondria per binucleate cell (Figure 8 middle) and the labeling index of binucleat cell (Figure 8 bottom) in 4 groups from postnatal day 1 to 14 were shown. The number of mitochondria and the number of labeled mitochondria were more in binucleate cells than mononucleate cells.
3.3. Mitochondrial RNA Synthesis of Mouse Hepatocytes
On the other hand, observing light microscopic radioautograms labeled with 3H-uridine, the silver grains were found over both the karyoplasm and cytoplasm of almost all the cells not only at the perinatal stages from embryo day 19 to postnatal day 1, 3, 9, 14, but also at the adult and senescent stages from postnatal month 1 to 2, 6, 12 and 24. By electron microscopic observation, silver grains were observed in most mononucleate hepatocytes in respective aging groups localizing not only over euchromatin and nucleoli in the nuclei but also over many
318174.jpg" width="430.35" height="624.15 " />
Figure 8. Transitional curves of the number of mitochondria per cell profile area (top), the number of labeled mitochondria per cell (middle) and the labeling index (bottom) of a binucleate hepatocyte in respective aging groups. The numbers and LI did not show any significant changes, but the number was much more than mononucleate cell at the same age.
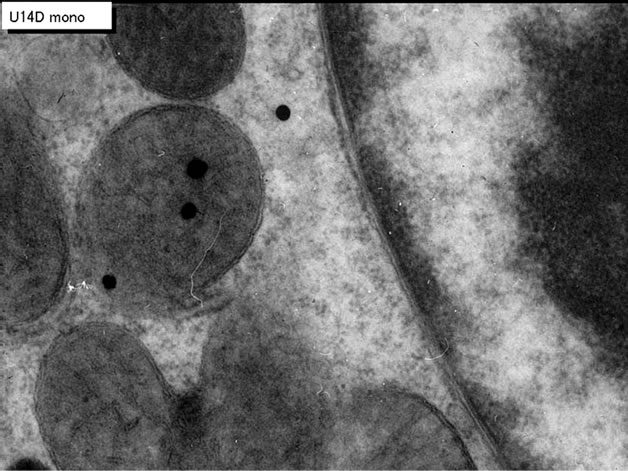
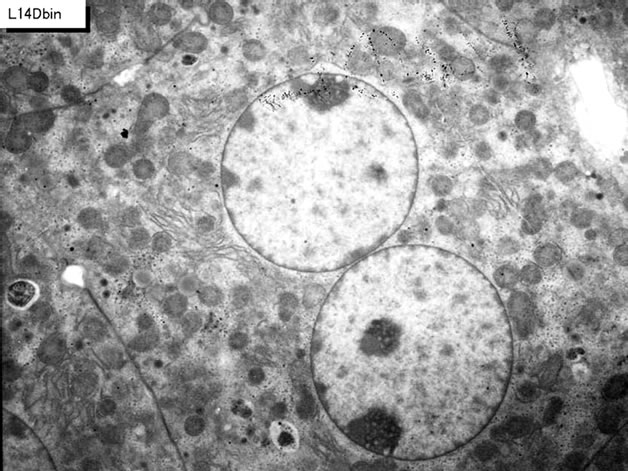
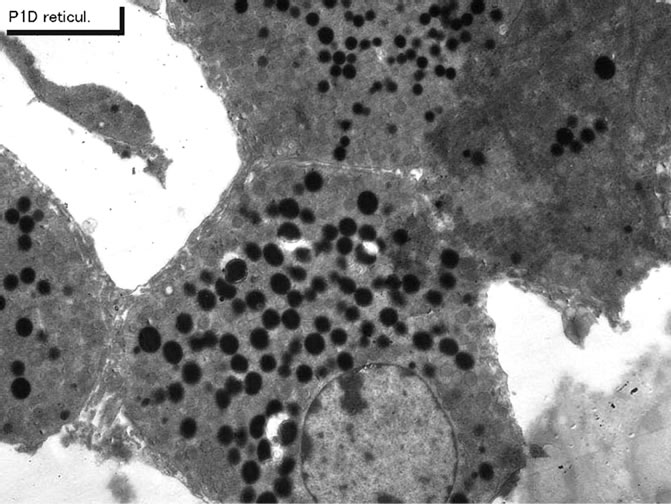
cell organelles such as endoplasmic reticulum, ribosomes, and mitochondria as well as cytoplasmic matrices from perinatal stage at embryonic day 19 (Figure 9), postnatal day 1, 3 (Figure 10), 9, 14 (Figure 11), to adult and senescent stages at postnatal month 1, 2 (Figure 12), 6 (Figure 13), 12 and 24. The silver grains were also observed in binucleate hepatocytes at postnatal day 1, 3, 9, 14, month 1, 2, 6 (Figure 13), 12 and 24 (Figure 14). The localizations of silver grains over the mitochondria were mainly on the mitochondrial matrices but a few over the mitochondrial membranes and cristae when observed by high power magnification (Figure 11).
As the results, it was found that almost all the hepatocytes were labeled with silver grains showing RNA synthesis in their nuclei and mitochondria [38]. Preliminary quantitative analysis on the number of mitochondria in 10 mononucleate hepatocytes whose nuclei were intensely labeled with many silver grains (more than 10 per nucleus) and other 10 mononucleate hepatocytes
52-b163-4ea1-a6b0-2bd63112393c.jpg" width="377.52999420166" height="282.34001159668 " />
Figure 9. EMRAG of a mouse embryo liver at fetal day 19, labeled with 3H-uridine, demonstrating RNA synthesis of a mononucleate hepatocyte. Several silver grains are localized over euchromatin of the nucleus as well as over several mitochondria. x 4,000.
31ca68f7-e3ea-4d7f-a779-197cfac9cf0b.jpg" width="377.52999420166" height="282.34001159668 " />
Figure 10. EMRAG of a newborn mouse liver at postnatal day 3, labeled with 3H-uridine, demonstrating RNA synthesis of a mononucleate hepatocyte. Several silver grains are localized over euchromatin and nucleolus of the nucleus and over several mitochondria. x 4,000.
 52999420166" height="282.34001159668 " />
Figure 11. High power magnification EM radioautogram of a juvenile mouse liver at postnatal day 14, labeled with 3H-uridine, demonstrating RNA synthesis. A few silver grains are localized over the mitochondrial matrix and the mitochondrial membrane of the mitochondrion at center. x 15,000.
 52999420166" height="282.34001159668 " />
Figure 12. EMRAG of a senescent mouse liver at postnatal month 2, labeled with 3H-uridine, demonstrating RNA synthesis of a mononucleate hepatocyte. Several silver grains are localized over euchromatin and nucleolus of the nucleus as well as over a few mitochondria showing less RNA synthesis than younger animals. x 4,000.
526f-4840-84b5-dea3eb46d8a5.jpg" width="377.52999420166" height="276.925 " />
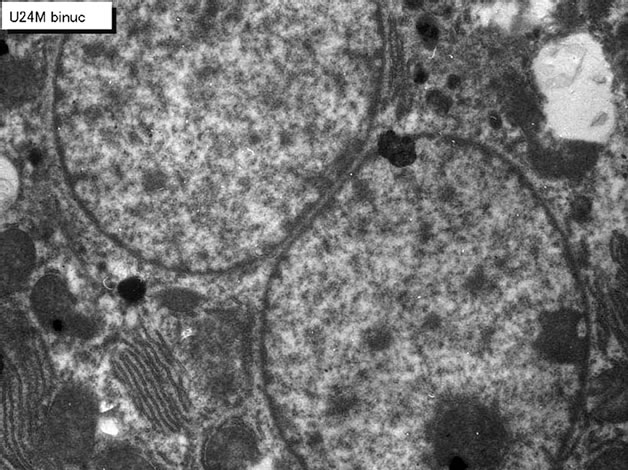
Figure 13. EMRAG of an adult mouse liver at postnatal month 6 labeled with 3H-uridine, demonstrating RNA synthesis of a binucleate hepatocyte. Only a few silver grains are localized over the 2 nuclei and over a few mitochondria. x 4,000.
whose nuclei were not so intensely labeled (number of silver grains less than 9) in each aging group revealed that there was no significant difference between the number of mitochondria, number of labeled mitochondria and the labeling indices in both types of hepatocytes (P < 0.01). Thus, the number of mitochondria and the labeling indices were calculated in 10 hepatocytes selected at random in each animal in respective aging stages regardless whether their nuclei were very intensely labeled or not. The results obtained from the number of mitochondria in mononucleate hepatocytes per cellular profile area showed an increase from the prenatal day (mean ± standard deviation 26.2 ± /cell) to postnatal day 1 to day 14 (38.4-51.7/cell), then to postnatal month 1-2 (53.7-89.2/cell), reaching the maximum, then decreased to year 1-2 (83.7-80.4/cell) as is shown in
 52999420166" height="282.34001159668 " />
Figure 14. EMRAG of a senescent mouse liver at postnatal month 24, 2 years, labeled with 3H-uridine, demonstrating RNA synthesis of a binucleate hepatocyte. Only a few silver grains are localized over the 2 nuclei and a few silver grains over a few mitochondria. x 4,000.
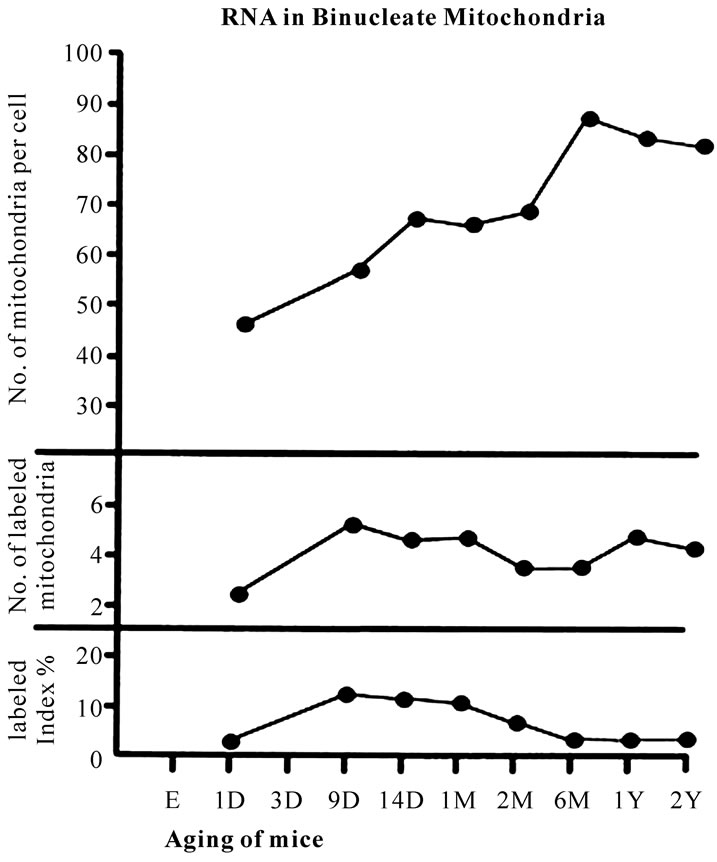
Figure 15 (top) and the increase was stochastically significant (P < 0.01). The results of visual grain counts on the number of mitochondria labeled with silver grains obtained from 10 mononucleate hepatocytes of each animal labeled with 3H-uridine demonstrating RNA synthesis in 10 aging groups at perinatal stages, prenatal embryo day 19, postnatal day 1, 3, 9 and 14, month 1, 6 and year 1 and 2, are plotted in Figure 15 (middle). The labeling indices in respective aging stages were calculated from the number of labeled mitochondria (Figure 15, middle) and the number of total mitochondria per cellular profile area (Figure 15, top) which were plotted in Figure 15 (bottom), respectively. The results showed that the numbers of labeled mitochondria with 3H-uridine showing RNA synthesis increased from prenatal embryo day 19 (3.3/cell) to postnatal month 1 (9.2/cell), reaching the maximum, and then decreased to month 6 (3.5/cell) and again increased to year 1 (4.0/cell) and year 2 (4.3/cell), while the labeling indices increased from prenatal day 19 (12.4%) to postnatal month 1 (16.7%), reaching the maximum, then decreased to year 1 (4.8%) and year 2 (5.3%). Stochastical analysis revealed that the increases and decreases of the number of labeled mitochondria from the perinatal stage to the adult and senescent stage were significant in contrast that the increases and decreases of the labeling indices were not significant (P < 0.01). As for the binucleate hepatocytes, on the other hand, because the appearances of binucleate hepatocytes were not so many in the embryonic stage, only several binucleate cells (5-8 at least) at respective stages when enough numbers of binucleate cells available from postnatal day 1 to year 2 were analyzed. The results were shown in Figure 16. The results of visual counts on the number of mitochondria labeled with silver grains
319b60807cd.jpg" width="430.35" height="577.6 " />
Figure 15. Transitional curves of the aging changes of the number of mitochondria per cell profile area (top), the number of labeled mitochondria per cell (middle) and the labeling index (bottom) of a monucleate hepatocyte in respective aging groups labeled with 3H-uridine showing RNA synthesis. The number of labeled mitochondria and LI peaked at day 14.
obtained from several (5 to 8) binucleate hepatocytes labeled with 3H-uridine demonstrating RNA synthesis in 8 aging groups at perinatal stages, postnatal day 1, 9, 14, and month 1, 2, 6, and year 1 and 2, are plotted in Figure 16 (middle) and the labeling indices in respective aging stages were calculated from the number of labeled mitochondria (Figure 16, middle) and the number of total mitochondria per cellular profile area (Figure 16, top) which were plotted in Figure 16 (bottom), respectively. The results showed that the number of labeled mitochondria increased from postnatal day 1 (2.3/cell) to day 9 (5.2/cell) and remained almost constant around 4-5, but the labeling indices increased from postnatal day 1 (2.1%) to postnatal day 9 (13.6%), remained almost constant around 13% (12.5-13.6%) from postnatal day 9 to month 1, then decreased to month 2 (6.1%) to month 6 (3.9%), and slightly increased to year 1 (6.3%) and 2 (5.3%). The increases and decreases of the number of labeled mitochondria and the labeling indices in binucleate hepatocytes were stochastically not significant (P < 0.01).
 31.20499420166" height="516.51501159668 " />
Figure 16. Transitional curves of the aging changes of the number of mitochondria per cell profile area (top), the number of labeled mitochondria per cell (middle) and the labeling index (bottom) of binucleate hepatocyte in respective aging groups labeled with 3H-uridine showing RNA synthesis.
3.4. Protein Synthesis of Mouse Hepatocytes
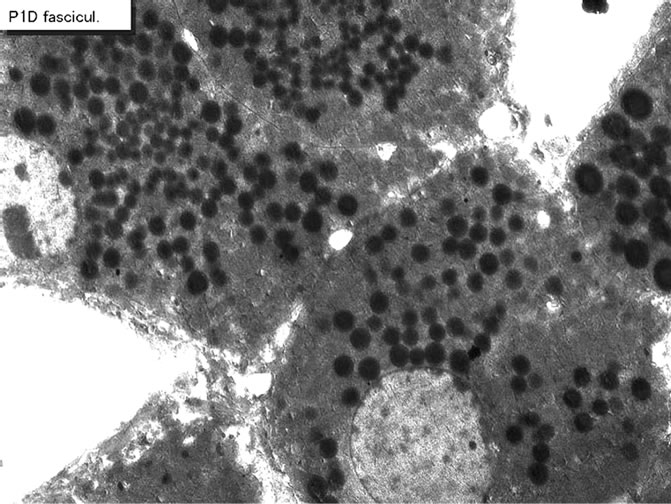
When the animals were injected with 3H-leucine, it was found that almost all the hepatocytes, from embryonic day 19, postnatal day 1, 3 (Figure 18), 9, 14 (Figure 19), to adult and senescent stages at postnatal month 1, 2 (Figure 20), 12 and 24 (Figure 21). The silver grains were also observed in binucleate hepatocytes at postnatal day 1, 3 (Figure 22), 9, (Figure 23), 14 (Figure 24), month 1, 2, 6, 12 (Figure 25) and 24. The localizations of silver grains observed over the mitochondria were mainly on the mitochondrial matrices but a few over their nuclei, cytoplasmic matrix, endoplasmic reticulum, ribosomes, Golgi apparatus and mitochondria [39]. In the mitochondria the silver grains were localized over the mitochondrial membranes and cristae when observed by high power magnification (Figure 19). Preliminary quantitative analysis on the number of mitochondria in 20 mononucleate hepatocytes whose nuclei were intensely labeled with many silver grains (more than 10 per nucleus) and other 20 mononucleate hepatocytes whose nuclei were not so intensely labeled (number of silver grains less than 9) in each aging group revealed that there was no significant difference between the number of mitochondria, number of labeled mitochondria
526b03-2dbd-4b88-8b2a-57c415b0000c.jpg" width="377.52999420166" height="282.34001159668 " />
Figure 17. EMRAG of a mouse embryo liver at fetal day 19, labeled with 3H-leucine, demonstrating protein synthesis of a mononucleate hepatocyte. Several silver grains are localized over euchromatin of the nucleus and over several mitochondria. x 4,000.
318a0d5653.jpg" width="377.52999420166" height="282.34001159668 " />
Figure 18. EMRAG of a newborn mouse liver at postnatal day 3, labeled with 3H-leucine, demonstrating protein synthesis of a mononucleate hepatocyte. Several silver grains are localized over euchromatin of the nucleus and over several mitochondria. x 4,000.
319aecc.jpg" width="376.48498840332" height="282.34001159668 " />
Figure 19. High power magnification radioautogram of a juvenile mouse liver at postnatal day 14, labeled with 3H-leucine, demonstrating protein synthesis. A few silver grains are localized over the mitochondrial matrix of the 2 mitochondria at left. x 8,000.
51.jpg" width="377.52999420166" height="282.34001159668 " />
Figure 20. EMRAG of an adult mouse liver at postnatal month 2, labeled with 3H-leucine, demonstrating protein synthesis of a mononucleate hepatocyte. Several silver grains are localized over the nucleus and over several mitochondria. x 3,000.
40-441f-92a2-2f1dca905229.jpg" width="377.52999420166" height="282.34001159668 " />
Figure 21. EMRAG of a senescent mouse liver at postnatal month 24, 2 years, labeled with 3H-leucine, demonstrating protein synthesis of a mononucleate hepatocyte. Several silver grains are localized over euchromatin of the nucleus as well as over a few mitochondria showing less protein than younger animals. x 3,000.
and the labeling indices in both types of hepatocytes (P < 0.01).
On the other hand, the numbers of mitochondria, the numbers of labeled mitochondria and the labeling indices were calculated in 10 binucleate hepatocytes selected at random in each animal in respective aging stages, regardless whether their nuclei were very intensely labeled or not, except the prenatal stage at embryonic day 19, because no binucleate cell was found at this stage. Thus, the numbers of mitochondria, the numbers of labeled mitochondria and the labeling indices were calculated in 20 hepatocytes selected at random in each animal in respective aging stages regardless whether their nuclei were very intensely labeled or not. The results obtained from the total numbers of mitochondria in mononucleate
36a60c5463.jpg" width="377.52999420166" height="282.34001159668 " />
Figure 22. Next slide shows an EMRAG of mouse liver at postnatal day 3, a newborn mouse, labeled with 3H-leucine, demonstrating protein synthesis of a binucleate hepatocyte. Only a few silver grains are localized over the 2 nuclei and over a few mitochondria. x 3,000.
36a-c42e72b78da7.jpg" width="377.52999420166" height="282.34001159668 " />
Figure 23. EMRAG of mouse a juvenile mouse liver at postnatal day 9, labeled with 3H-leucine, demonstrating protein synthesis of a binucleate hepatocyte. Only a few silver grains are localized over the 2 nuclei and over a few mitochondria. x 3,000.
 52999420166" height="282.34001159668 " />
Figure 24. EMRAG of a juvenile mouse liver at postnatal day 14, labeled with 3H-leucine, demonstrating protein synthesis of a binucleate hepatocyte. Only a few silver grains are localized over the 2 nuclei and over a few mitochondria. x 3,000.
36d9b5c-a42a-4179-a262-7051704de11e.jpg" width="376.48498840332" height="283.47999420166 " />
Figure 25. EMRAG of senescent mouse liver at postnatal month 12, year 1, labeled with 3H-leucine, demonstrating protein synthesis of a binucleate hepatocyte. Only a few silver grains are localized over the 2 nuclei and over a few mitochondria. x 3,000.
hepatocytes showed an increase from the prenatal day (34.5/cell) to postnatal days 1 (44.6/cell), 3 (45.8/cell), 9 (43.6/cell), 14 (48.5/cell), to postnatal months 1 (51.5/cell)2 (52.3/cell), reaching the maximum at month 6 (60.7/cell), then decreased to years 1 (54.2/cell) and 2 (51.2/cell) as shown in Figure 26 (upper left). The increase and decrease were stochastically significant (P < 0.01). The results obtained from visual counting on the numbers of mitochondria labeled with silver grains from 20 mononucleate hepatocytes of each animal labeled with 3H-leucine demonstrating protein synthesis in 10 aging groups at perinatal stages, prenatal embryo day 19, postnatal day 1, 3, 9 and 14, month 1, 2, 6 and year 1 and 2, are plotted in Figure 26 (lower left). The labeling indices in respective aging stages were calculated from the numbers of labeled mitochondria and the numbers of total mitochondria per cell which were plotted in Figure 26 (right). The results showed that the numbers of labeled mitochondria with 3H-leucine showing protein synthesis increased from prenatal embryo day 19 (8.3/cell) to postnatal days 1 (9.6/cell), 3 (8.1/cell), 9 (8.9/cell), 14 (9.5/cell), and month 1 (11.2/cell), reaching the maximum, and then decreased to months 2 (9.1/cell), 6 (8.8/cell) to years 1 (6.7/cell) and 2 (2.2/cell), while
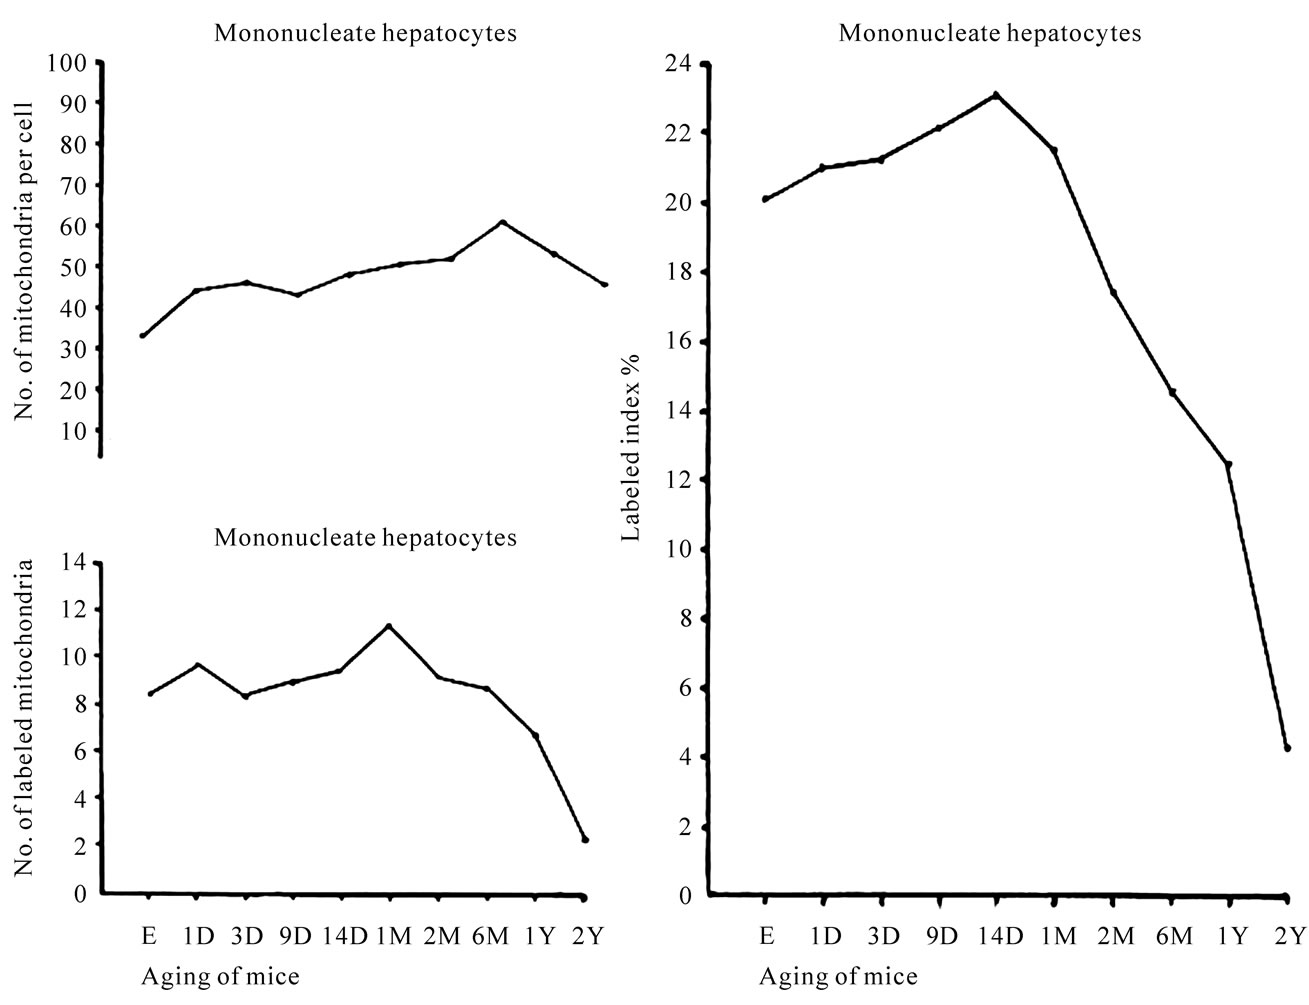
Figure 26. Transitional curves of the aging changes of mononucleate hepatocyte mitochondria labeled with 3H-leucine showing protein synthesis. The upper left curve shows number of mitochondria per cell showing an increase and decrease due to aging, the lower left curve shows number of labeled mitochondria per cell, which showed an increase and decrease, and the right curve shows labeling index which also showed an increase and decrease with aging.
the labeling indices increased from prenatal day 19 (20.1%) to postnatal days 1 (21.2%), 3 (21.6%), 9 (22.2%), 14 (23.1%), reaching the maximum, then decreased to month 1 (21.7%), 2 (17.4%), 6 (14.6%), and years 1 (12.4%) and 2 (4.4%). Stochastical analysis revealed that the increases and decreases of the numbers of labeled mitochondria as well as the labeling indices from the perinatal stage to the adult and senescent stages were significant (P < 0.01).
On the other hand, the results obtained from the numbers of mitochondria in binucleate hepatocytes showed an increase from the postnatal days 1 (66.2/cell), to 3 (66.4/cell), 14 (81.8/cell), to postnatal months 1 (89.9/cell), 2 (95.1/cell), and 6 (102.1), reaching the maximum at month 12 (128.0/cell), then decreased to years 2 (93.9/cell) as shown in Figure 27 (upper left). The increase and decrease were stochastically significant (P < 0.01). The results obtained from visual counting on the numbers of mitochondria labeled with silver grains from 10 binucleate hepatocytes of each animal labeled with 3H-leucine demonstrating protein synthesis in 10 aging groups at postnatal day 1, 3, and 14, month 1, 6 and year 1 and 2, are plotted in Figure 27 (lower left). The labeling indices in respective aging stages were calculated from the numbers of labeled mitochondria and the numbers of total mitochondria per cell which were plotted in Figure 27 (right). The results showed that the numbers of labeled mitochondria with 3H-leucine showing protein synthesis increased from postnatal day 1 (7.3/cell) to day 3 (6.8/cell), 14 (10.2/cell), and month 1 (15.0/cell), 2 (15.9/cell), reaching the maximum at month 6 (19.6/cell), then decreased to year 1 (8.3/cell) and 2 (5.1/cell), while the labeling indices increased from postnatal day 1 (11.8%) to 3 (10.2%), 14 (12.5%), month 1 (18.3%) and 2 (18.7%), reaching the maximum at month 6 (19.2%), then decreased to year 1 (6.4%) and 2 (5.5%). Stochastical analysis revealed that the increases and decreases of the numbers of labeled mitochondria as well as the labeling indices from the newborn stage to the adult and senescent stages were significant (P < 0.01).
4018fcea.jpg" width="789.45" height="627.95 " />
Figure 27. Transitional curves of the aging changes of binucleate hepatocyte mitochondria labeled with 3H-leucine showing protein synthesis. The upper left curve shows number of mitochondria per cell, which had much more mitochondria than mononucleate cell and showed an increase and decrease due to aging, the lower left shows number of labeled mitochondria per cell, which showed an increase and decrease, and the right shows labeling index which also showed an increase and decrease with aging.
4. THE ADRENAL GLAND
4.1. Structure of Mouse Adreno-Cortical Cells
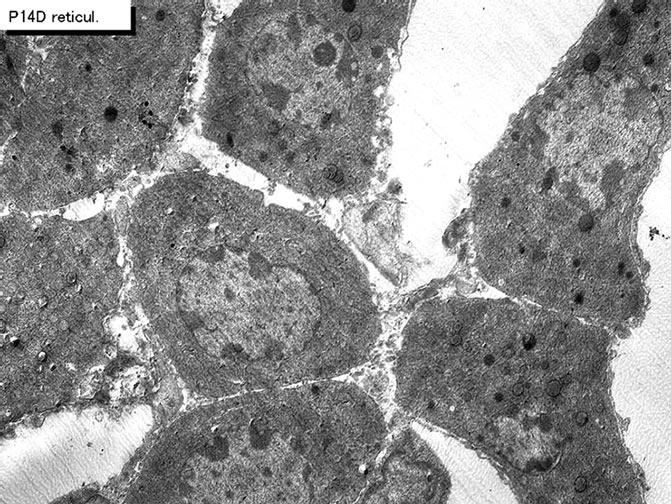
We studied the adrenal tissues at various ages from embryo to postnatal 2 years [30,31]. The adrenal tissues obtained from ddY strain mice at various ages from embryo day 19 to postnatal day 30, consisted of the adrenal cortex and the adrenal medulla. The former consited of 3 layers, zona glomerulosa, zona fasciculata and zona reticularis, developing gradually with aging as observed by light microscopy. At embryonic day 19 and postnatal day 1, the adreno-cortical cells were composed mainly of polygonal cells, while the specific orientation of the 3 layers, zona glomerulosa, zona fasciculata and zona reticularis,was not yet well established. At postnatal day 3, orientation of 3 layers, especially the zona glomerulosa became evident. At postnatal day 9 and 14, the specific structure of 3 layers was completely formed and the arrangements of the cells in respective layer became typical especially at day 14 and month 1 (Figure 28). Observing the ultrastructure of the adreno-cortical cells by electron microscopy, cell organelles including mitochondria were not so well developed at perinatal and early postnatal stages from embryonic day 19 to postnatal day 9. However, these cell organelles, mitochondria, endoplasmic reticulum, Golgi apparatus, appeared well developed similarly to the adult stages at postnatal day 14. The zona glomerulosa (Figures 29, 32, 35, 38) is the thinnest layer found at the outer zone, covered by the capsule, consisted of closely packed groups of columnar or pyramidal cells forming arcades of cell columns. The cells contained many spherical mitochondria and well developed smooth surfaced endoplasmic reticulum but a compact Golgi apparatus in day 14 animals. The zona fasciculata (Figures 30, 33, 36, 39) was the thickest layer, consisted of polygonal cells which were larger than the glomerulosa cells, arranged in long cords disposed radially to the medulla containing many lipid droplets (Figures 33, 36, 39). The mitochondria were less numerous and were more variable in size and shape than those of the glomeruloza cells, while the smooth surfaced endoplasmic reticulum were more developed and the Golgi apparatus was larger than the glomerulosa. In the zona reticularis (Figures 31, 34, 37, 40), the parallel arrangement of cell cords were anastomosed showing networks continued to the medullar cells. The mitochondria were less numerous and were more variable in size and shape than those of the glomeruloza cells like the fasciculata cells, as well as the smooth surfaced endoplasmic reticulum were developed and the Golgi apparatus was large like the fasciculata cells. However, the structure of the adrenal cortex tissues showed changes due to development and aging at respective develop-
520-7f48185eb8e7.jpg" width="377.52999420166" height="282.34001159668 " />
Figure 28. LM radioautograms of a young mouse adrenal cortex, zona glomerulosa (left), fasciculata (center), and reticularis (right), labeled with 3H-thymidine, demonstrating DNA synthesis of adreno-cortical cells. Silver grains are localized over the nuclei in each zone (arrows). x 800.
3111af1fbbf.jpg" width="376.48498840332" height="283.47999420166 " />
Figure 29. EM radioautogram of a mouse embryo adrenal gland at fetal day 19, labeled with 3H-thymidine, demonstrating DNA synthesis of adreno-cortical cells at zona glomerulosa. Silver grains are localized over euchromatin of the nuclei as well as over a few mitochondria. x 2,000.
mental stages.
4.2. DNA Synthesis in the Adreno-Cortical Cells
Observing EM radioautograms, the silver grains were found over the nuclei of some adreno-cortical cells labeled with 3H-thymidine, demonstrating DNA synthesis mainly in perinatal stages at embryonic day 19 (Figures 29-31), postnatal day 1 (Figures 32-34) and day 3 (Figures 35, 36), while less at day 9 (Figure 37), and day 14 (Figures 38, 39, 40).
However, those labeled cells were found in all the 3 layers, the zona glomerulosa (Figures 29, 32, 35, 38), the zona fasciculata (Figures 30, 33, 36, 39) and the zona reticularis (Figures 31, 34, 36, 37, 40), at respective aging stages. In the labeled adreno-cortical cells in 3
31e-bde4-40a5-93ce-3da939e3eb9e.jpg" width="377.52999420166" height="282.34001159668 " />
Figure 30. EMRAG of a mouse embryo adrenal gland at fetal day 19, labeled with 3H-thymidine, demonstrating DNA synthesis of adreno-cortical cells at zona fasciculata. Silver grains are localized over euchromatin of the nuclei as well as over a few mitochondria. x 2,000.
31-8b07-c41c6005cfc7.jpg" width="376.48498840332" height="283.47999420166 " />
Figure 31. EMRAG of a mouse embryo adrenal gland at fetal day 19, labeled with 3H-thymidine, demonstrating DNA synthesis of adreno-cortical cells at zona reticularis. Silver grains are localized over euchromatin of the nuclei as well as over a few mitochondria. x 2,000.
527-01452b0ce34e.jpg" width="377.52999420166" height="282.34001159668 " />
Figure 32. EMRAG of mouse adrenal gland at postnatal day 1, labeled with 3H-thymidine, demonstrating DNA synthesis of adreno-cortical cells at zona glomerulosa. x 3,000.
 403.84500579834" height="302.1 " />
Figure 33. EMRAG of a newborn mouse adrenal gland at postnatal day 1, labeled with 3H-thymidine, demonstrating DNA synthesis of adreno-cortical cells at zona fasciculata. x 3,000.
 403.84500579834" height="302.1 " />
Figure 34. EMRAG of newborn mouse adrenal gland at postnatal day 1, labeled with 3H-thymidine, demonstrating DNA synthesis of adreno-cortical cells at zona reticularis. x 3,000.
517e1d49dff.jpg" width="403.84500579834" height="302.1 " />
Figure 35. EMRAG of a newborn mouse adrenal gland at postnatal day 3, labeled with 3H-thymidine, demonstrating DNA synthesis of adreno-cortical cells at zona glomerulosa. x 3,000.
53c22b-a3bb-4da9-9d27-2fcb7f195175.jpg" width="403.84500579834" height="302.1 " />
Figure 36. EMRAG of a newborn mouse adrenal gland at postnatal day 3, labeled with 3H-thymidine, demonstrating DNA synthesis of adreno-cortical cells at zona fasciculata. x 3,000.
367a-7455-4c68-b8ba-6cc1f04c24da.jpg" width="403.84500579834" height="302.1 " />
Figure 37. EMRAG of a juvenile mouse adrenal gland at postnatal day 9, labeled with 3H-thymidine, demonstrating DNA synthesis of adreno-cortical cells at zona reticularis. x 3,000.
 403.84500579834" height="299.82000579834 " />
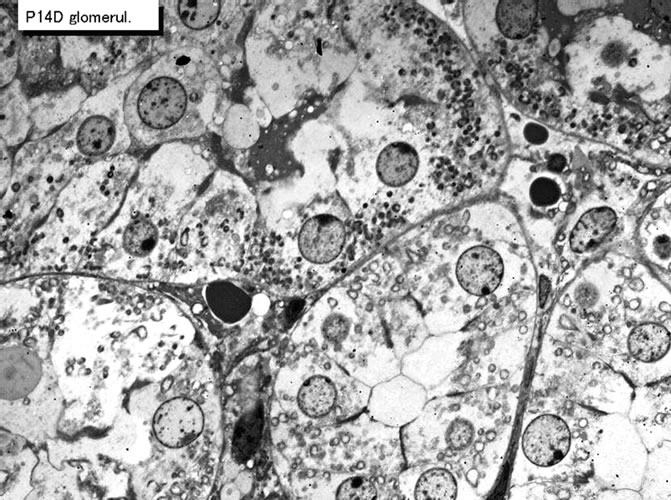
Figure 38. EMRAG of a juvenile mouse adrenal gland at postnatal day 14, labeled with 3H-thymidine, demonstrating DNA synthesis of adreno-cortical cells at zona glomerulosa. x 2,000.
4063-8475-0f1774d1d560.jpg" width="403.84500579834" height="302.1 " />
Figure 39. EMRAG of a juvenile mouse adrenal gland at postnatal day 14, labeled with 3H-thymidine, demonstrating DNA synthesis of adreno-cortical cells at zona fasciculata. x 3,000.
 403.84500579834" height="302.1 " />
Figure 40. EMRAG of juvenile mouse adrenal gland at postnatal day 14, labeled with 3H-thymidine, demonstrating DNA synthesis of adreno-cortical cells at zona reticularis. x 3,000.
layers the silver grains were mainly localized over the euchromatin of the nuclei and only a few or several silver grains were found over the mitochondria of these cells. To the contrary, most adreno-cortical cells were not labeled with any silver grains in their nuclei nor cytoplasm, showing no DNA synthesis even after labeling with 3H-thymidine. Among many unlabeled adrenocortical cells, most cells in the 3 layers were observed to be labeled with several silver grains over their mitochondria due to the incorporations of 3H-thymidine especially at the perinatal stages from embryonic day 19 (Figure 29-31) to postnatal day 1 (Figure 32-34), day 3 (Figure 35, 36), day 9 (Figure 37) and 14 (Figure 38-40). The localizations of silver grains over the mitochondria were mainly on the mitochondrial matrices (Figure 39).
4.3. Quantitative Analysis on the Adreno-Cortical Cells
4.3.1. Number of Mitochondria of Adreno-Corticl Cells
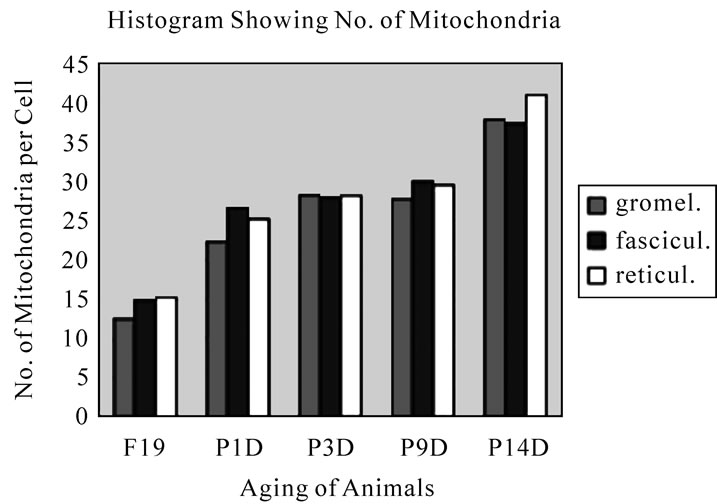
Preliminary quantitative analysis on the number of mitochondria in 10 adreno-cortical cells whose nuclei were labeled with silver grains and other 10 cells whose nuclei were not labeled in each aging group revealed that there was no significant difference between the number of mitochondria and the labeling indices (P < 0.01). Thus, the number of mitochondria and the labeling indices were calculated regardless whether their nuclei were labeled or not. The results obtained from the number of mitochondria in adreno-cortical cells in the 3 layers of respective animals in 5 aging groups at perinatal stages, prenatal embryo day 19, postnatal day 1, 3, 9 and 14, showed an gradual increase from the prenatal day 19 (glomerulosa 12.5, fasciculata 14.9, reticularis 15/2/cell) to postnatal day 14 (glomerulosa 37.8, fasciculata 37.3, reticularis 40.9/cell), as is shown in Figure 41. The increase from embryo day 19 to postnatal day 14 was stochastically significant (P < 0.01).
4.3.2. Mitochondrial DNA Synthesis of Mouse Adreno-Cortical Cells
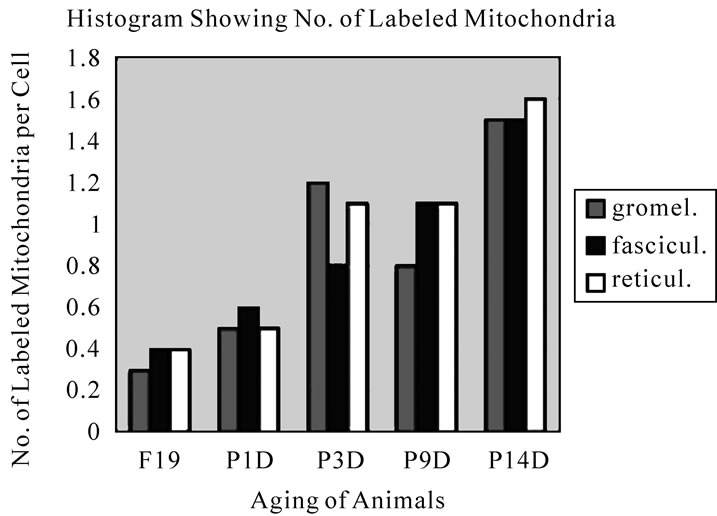
The results of visual grain counts on the number of mitochondria labeled with silver grains obtained from 10 adreno-cortical cells in the 3 layers of each animal labeled with 3H-thymidine demonstrating DNA synthesis in 5 aging groups at perinatal stages, prenatal embryo day 19, postnatal day 1, 3, 9 and 14, are plotted in Figure 42. The results demonstrated that the numbers of labeled mitochondria with 3H-thymidine showing DNA synthesis gradually increased from prenatal embryo day 19 (glomerulosa 0.3, fasciculata 0.5, reticularis 0.4/cell) to postnatal day 14 (glomerulosa 1.5, fasciculata 1.5, reticularis 1.6/cell), reaching the maximum.
4.3.3. The Labeling Index of Mouse Adreno-Cortical Mitochondria
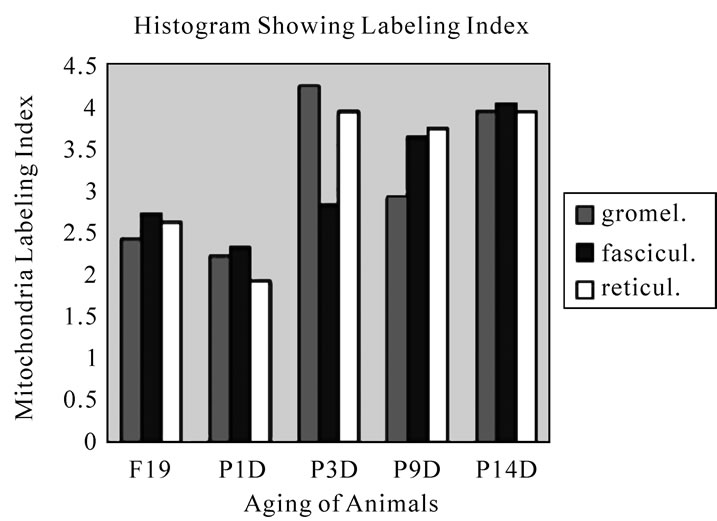
On the other hand, the labeling indices in respective aging stages were calculated from the number of labeled mitochondria (Figure 41) dividing by the number of total mitochondria per cell (Figure 42) which were plotted in Figure 43, respectively.
The results showed that the labeling indices gradually increased from prenatal day 19 (glomerulosa 2.4, fasciculata 2.7, reticularis 2.6%) to postnatal day 14 (glomerulosa 4.0, fasciculata 4.1, reticularis 3.9%), reaching the maximum (Figure 43).
5. THE LUNG
5.1. Structure of the Lung of Mouse
The pulmonary tissues obtained from ddY strain mice at
 31.20499420166" height="302.1 " />
Figure 41. Histogram showing the aging changes of number of mitochondria per cell in 3 zones of glomerulosa, fasciculata and reticularis. It increased from embryo to postnatal day 14.
 31.20499420166" height="309.7 " />
Figure 42. Histogram showing the aging changes of number of labeled mitochondria per cell in 3 zones of glomerulosa, fasciculata and reticularis. It increased from embryo to postnatal day 14.
 31.20499420166" height="311.88498840332 " />
Figure 43. Histogram showing the aging changes of the labeling index of mitochondria in 3 zones of glomerulosa, fasciculata and reticularis. It increased from embryo to postnatal day 14.
embryonic to early postnatal stages consisted of undifferentiated cells (Figure 44). However, they differentiated into several types of cells due to aging, the type I epithelial cell (Figure 45, 51) aging, the type I epithelial cell (Figure 45, 51) or the small alveolar epithelial cell, the type II epithelial cell (Figure 46,52" target="_self"> 52) or the large alveolar epithelial cell, the interstitial cell (Figure 47,53" target="_self"> 53), the endothelial cell and alveolar phagocyte or dust cell as we had formerly observed [19-22]. At embryonic day 16 and 18, the fetal lung tissues appeared as glandular organizations consisting of many alveoli bordering undifferentiated cuboidal cells and no squamous epithelial cells were seen (Figure 44). Mitotic figures were frequently observed in cuboidal epithelial cells. After birth, the structure of the alveoli was characterized by further development of the alveolar-capillary networks from postnatal day 1 to 3 and 7. During the development, the cellular composition of the alveolar epithelium resembled that of the adult lung, with a mixed population of the type I and type II epithelial cells. Up to 1 and 2 weeks after birth, the lung tissues showed complete alveolar structure and single capillary system almost the same as the adult after 1 month (Figure51-53) to 2 to 6 months, and further to senescent stage over 12 months to 22 months.
5.2. Mitochondrial DNA Synthesis of Mouse Pulmonary Cells
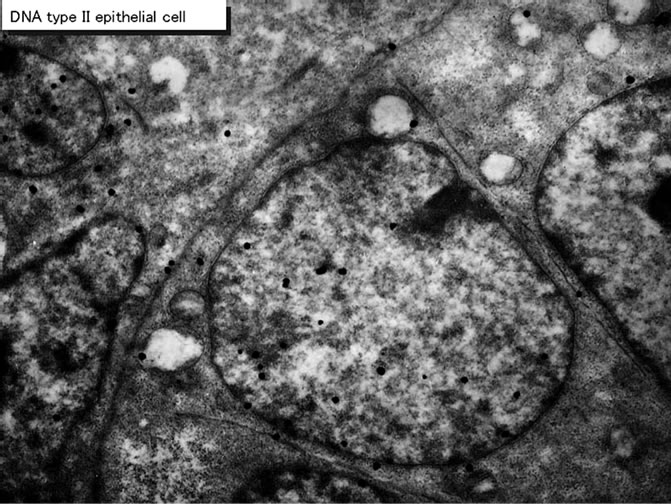
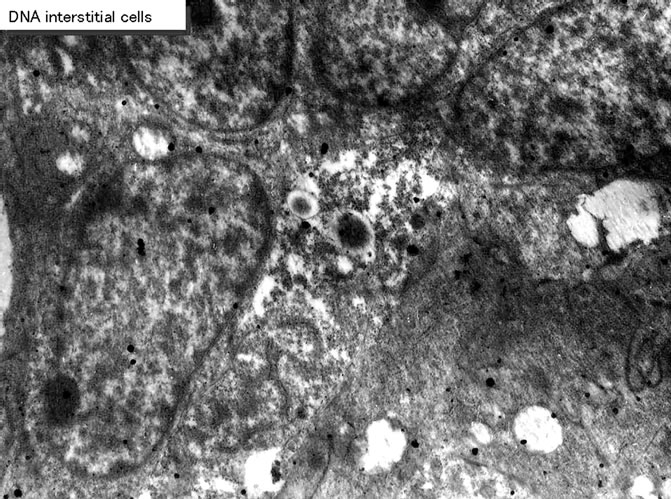
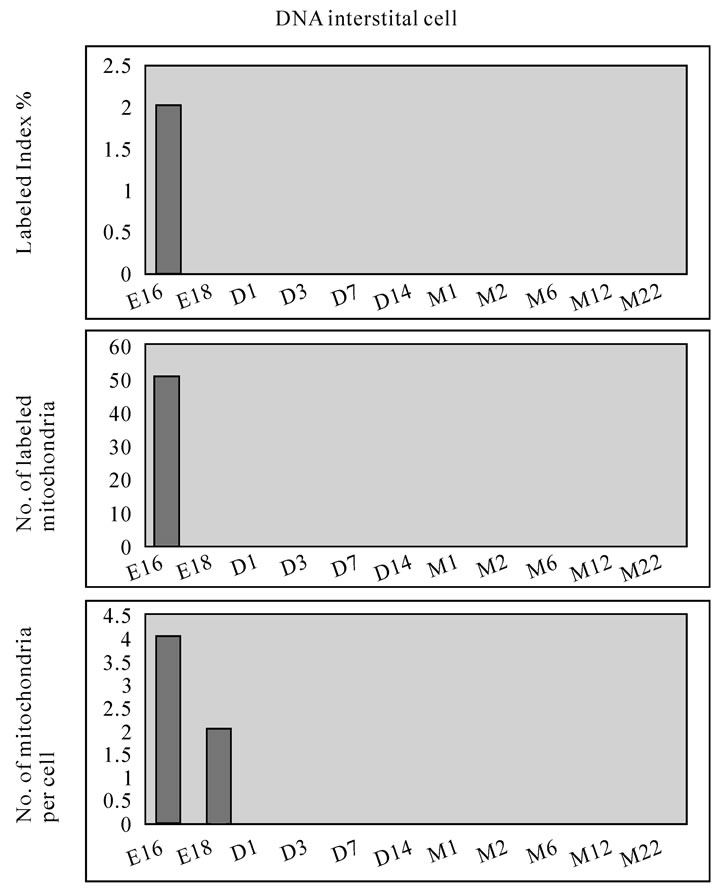
On electron microscopic radioautograms of the pulmonary tissues labeled with 3H-thymidine, silver grains were observed over the nuclei of some pulmonary cells corresponding to the DNA synthesis in S-phase as observed by light microscopic radioautograpy (Figure 44). On the other hand, some mitochondria in both S-phase cells and interphase cells which did not show any silver grains over their nuclei were labeled with silver grains showing intramitochondrial DNA synthesis. The intramitochondrial DNA synthesis was observed in all the cell types, the type I epithelial cell (Figure 45, 51), the type II epithelial cell (Figure 46, 52), the interstitial cell (Figure 47, 53) and the endothelial cell. Because enough numbers of electron photographs (more than 5) were not obtained from all the cell types in respective aging groups, only some cell types and some aging groups where enough numbers of electron photographs were available were used for quantitative analysis. The numbers of mitochondria per cell profile area, the numbers of labeled mitochondria per cell and the labeling indices of the type I epithelial cells in only a few aging groups was shown in Figure 48 (top). Likewise, the similar results from the type II epithelial cells (Figure 49 top), the interstitial cells (Figure 50 top) were shown. The labeling indices in respective aging stages were calculated from the number of labeled mitochondria and the number of total mitochondria per cellular profile area which were plotted in Figures 48-50 (middle and bottom), respectively. These results demonstrated that the labeling indices in these cell types decreased from perinatal stages to the adult and senescent stage due to aging.
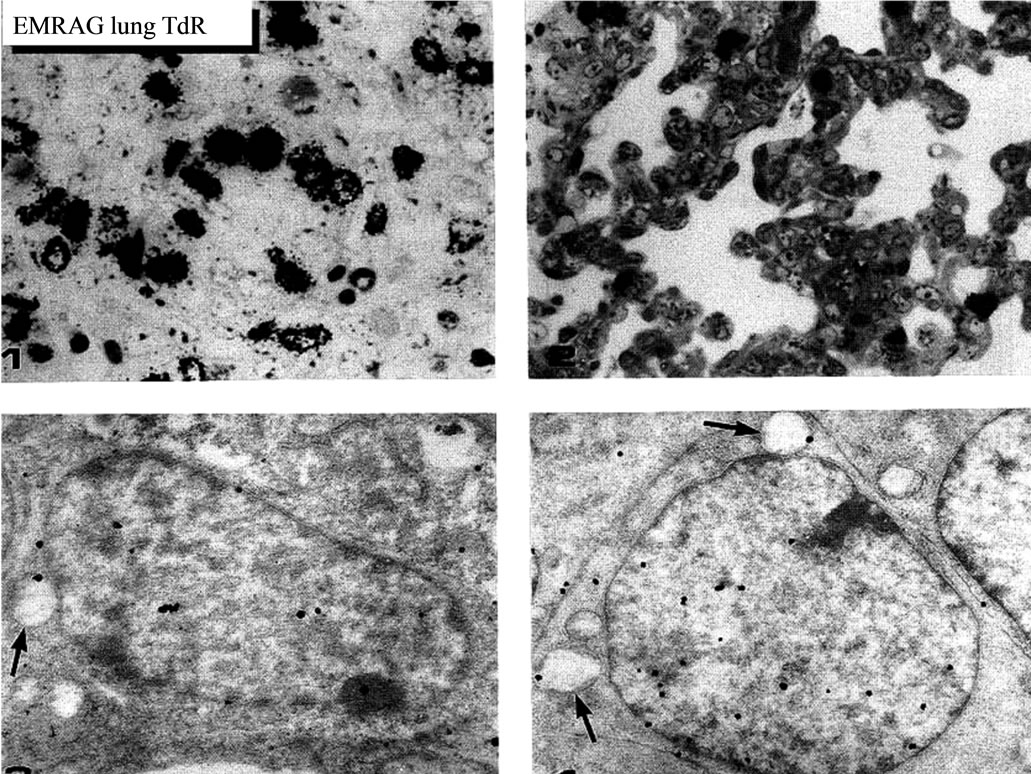
Figure 44. LMRAG of the lung tissues of mice at fetal day 16 (upper left), postnatal day 7 (upper right) x 800, and EMRAG of a mouse cuboidal cell at fetal day 16 (lower left), an interstitial cell (lower right) x 2,000.
31-2729-4bc6-8100-de67e6b9ae79.jpg" width="403.84500579834" height="302.1 " />
Figure 45. EMRAG of the type I epithelial cell of an aduldt mouse at postnatal month 1, labeled with 3H-thymidine. Silver grains are localized over nuclei and several mitochondria. x 4,000.
 403.84500579834" height="302.1 " />
Figure 46. EMRAG of the type II epithelial cell of an adult mouse at postnatal month 1, labeled with 3H-thymidine. Silver grains are localized over nuclei and several mitochondria. x 4,000.
 403.84500579834" height="299.82000579834 " />
Figure 47. EMRAG of the interstitial cell of an adult mouse at postnatal month 1, labeled with 3H-thymidine. Silver grains are localized over nuclei and several mitochondria. x 4,000.
5126dec.jpg" width="431.20499420166" height="508.91501159668 " />
Figure 48. Histograms demonstrating the labeling index (top), number of labeled mitochondria (middle) and number of mitochondria (bottom) of the type I epithelial cells labeled with 3H-thymidine.
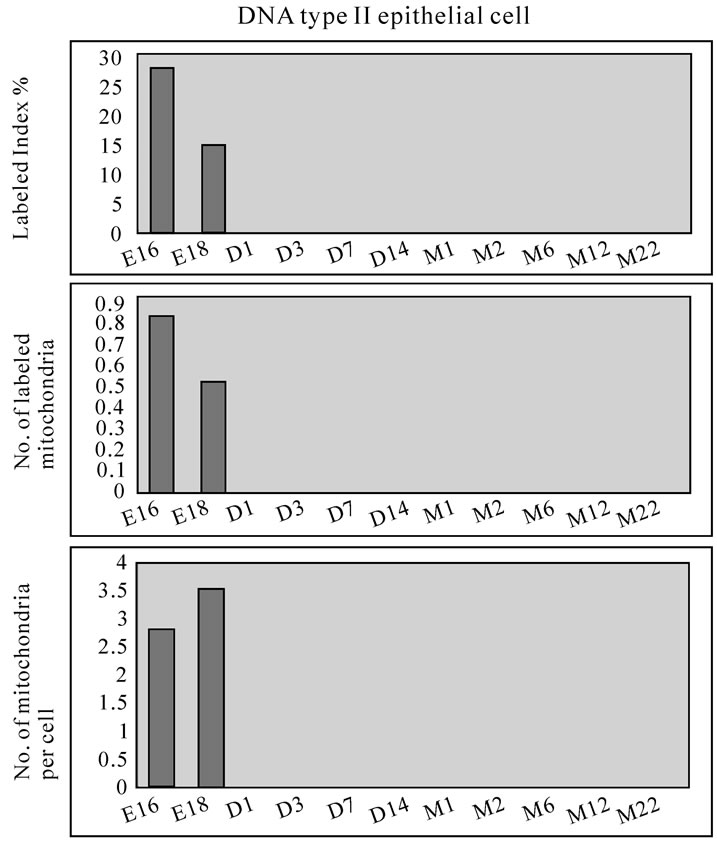
Figure 49. Histograms demonstrating the labeling index (top), number of labeled mitochondria (middle) and number of mitochondria (bottom) of the type II epithelial cells labeled with 3H-thymidine.
 533.9 " />
Figure 50. Histograms demonstrating the labeling index (top), number of labeled mitochondria (middle) and number of mitochondria (bottom) of the interstitial cells labeled with 3H-thymidine.
5.3. Mitochondrial RNA Synthesis of Mouse Pulmonary Cells
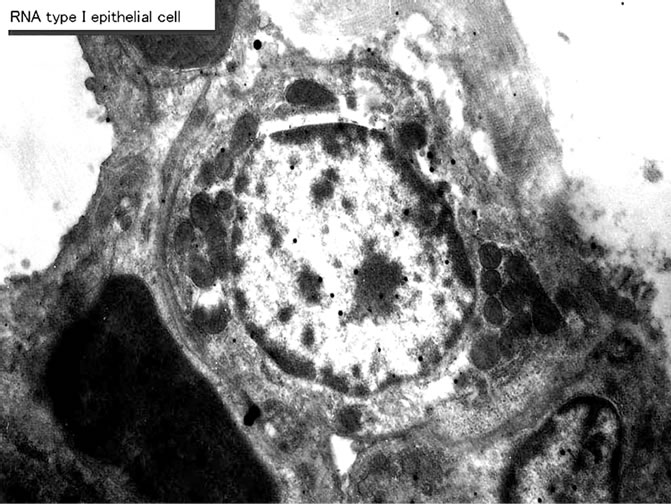
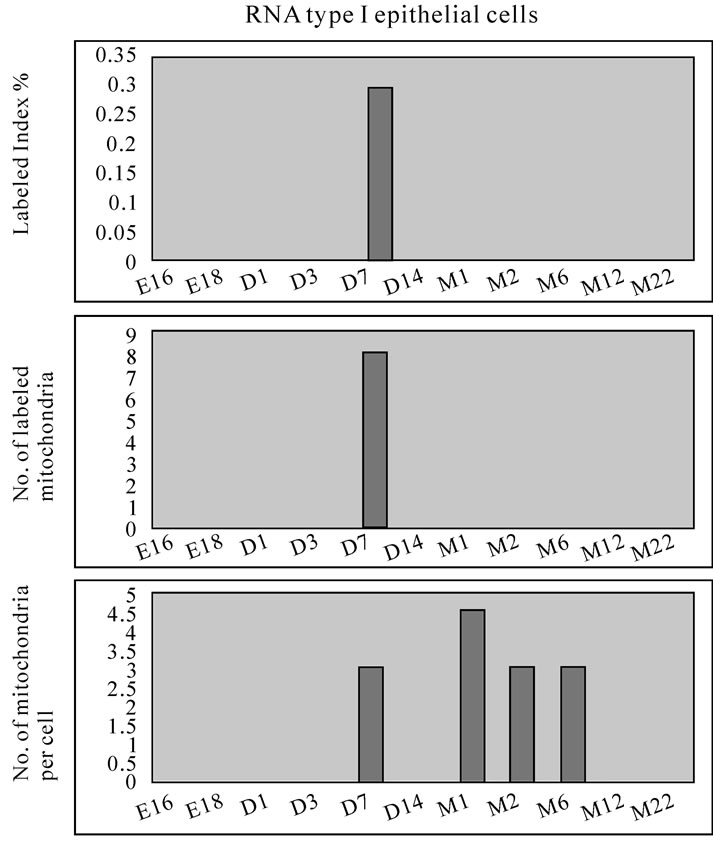
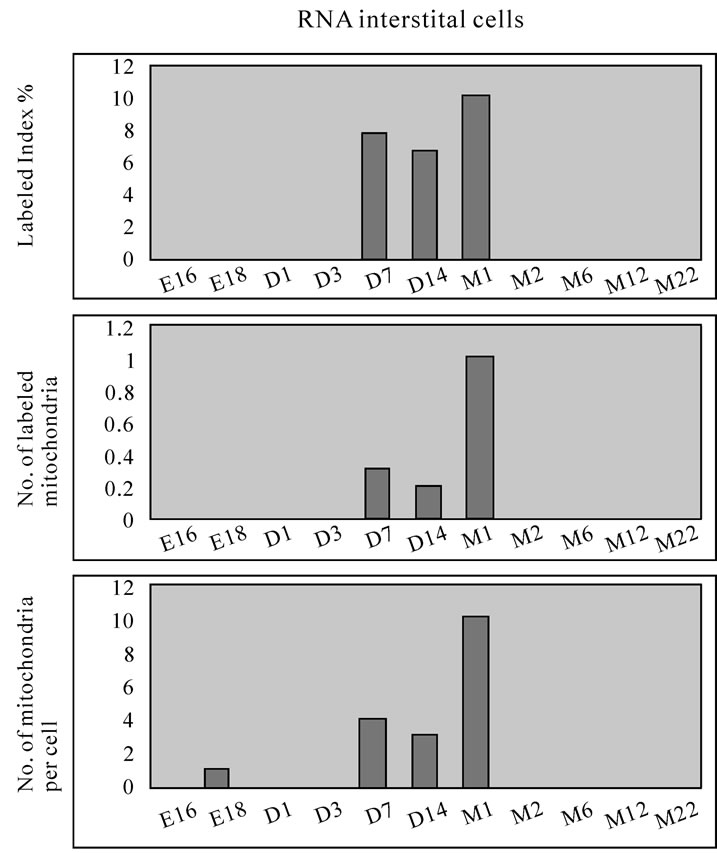
On electron microscopic radioautograms of pulmonary tissues labeled with 3H-uridine, silver grains were observed over the nuclei of some pulmonary cells corresponding to the RNA synthesis in most cells in respective aging groups as observed by light microscopic radioautograpy. The silver grains were observed to localize not only over euchromatin and nucleoli in the nuclei but also over many cell organelles such as endoplasmic reticulum, ribosomes, and mitochondria as well as cytoplasmic matrices of all the cell types. The intramitochondrial RNA synthesis was observed in all the cell types, the interstitial cell (Figure 51) the type I epithelial cell (Figure 52), the type II epithelial cell (Figure 53), and the endothelial cell. Because enough numbers of electron photographs (more than 5) were not obtained from all the cell types in respective aging groups, only some cell types and some aging groups when enough numbers of electron photographs were available were used for quantitative analysis similarly to DNA synthesis. The numbers of mitochondria per cell profile area, the numbers of labeled mitochondria per cell and the labeling indices of the type I epithelial cells in only a few
4025-b166-534c2efc4ca6.jpg" width="398.33498840332" height="299.82000579834 " />
Figure 51. EMRAG of the interstitial cell of an adult mouse at postnatal month 1, labeled with 3H-thymidine. Silver grains are localized over nucleus and several mitochondria. x 3,000.
 403.84500579834" height="302.1 " />
Figure 52. EMRAG of the type I epithelial cell of an adult mouse at postnatal month 1, labeled with 3H-thymidine. Silver grains are localized over nucleus and several mitochondria. x 3,000.
3485209f6.jpg" width="403.84500579834" height="303.14500579834 " />
Figure 53. EMRAG of the type II epithelial cell of an adult mouse at postnatal month 1, labeled with 3H-thymidine. Silver grains are localized over nucleus and several mitochondria. x 3,000.
aging groups was shown in Figure 54. Likewise, the similar results from the type II epithelial cells (Figure 55 bottom), the interstitial cells (Figure 56 bottom), and the endothelial cell (Figure 57 bottom) were shown. The labeling indices in respective aging stages were calculated from the number of labeled mitochondria and the number of total mitochondria per cellular profile area were also shown in Figures 54-57 (top and middle), respectively. These results demonstrated that the numbers of labeled mitochondria in these cell types increased from perinatal stages to the adult stage, reaching maxima at postnatal month 1, and decreased to the senescent stage due to aging.
6. THE TESTIS
The male reproductive system consists of the testis and its excretory ducts. We studied the macromolecular synthesis in the testis of aging ddY mice at various ages [22]. Gao. By LM and EM radioautography, many spermatogonia and myoid cells were labeled with 3H-thymidine at various ages from embryonic day 19 to postnatal day 1, 4, 7, 14 (Figure 58), month 1, 2, 6, 9, 12 and 24. Silver grains are localized over the nucleus and several mitochondria of the spermatogonia showing DNA synthesis. Among of the aging groups, we calculated the numbers of mitochondria per cell profile area, the numbers of labeled mitochondria per cell and the labeling indices of the spermatogonia from 4 aging groups, prenatal embryonic day 19, postnatal day 4, month 1 and 6. The results were listed in Table 1. It is clear that the LI of the spermatogonia increased from embryonic day 19 to postnatal month 1 (day 30), reaching the maximum, then decreased to month 6.
7. CONCLUSIONS
From the results obtained at present in our laboratory, macromolecular synthesis such as nucleic acids, both DNA and RNA, and protein synthesis showing incorporations of 3H-thymidine, 3H-uridine and 3H-leucine, respectively, were demonstrated in the nuclei and mitochondria of some mouse organs, i. e., hepatocytes of the liver, adreno-cortical cells of the adrenal glands, pulmonary cells of the lungs of both sexes and spermatogonia of male mice at various ages from fetal to postnatal newborn, juvenile, young, adult and senescence.
The numbers of mitochondria per cell, the numbers of labeled mitochondria and the labeling indices of hepatocytes, adreno-cortical cells, pulmonary cells and spermatogonia at various ages changed due to aging. The numbers of mitochondria per cell in hepatocytes, adreno-cortical cells, pulmonary cells and spermatogonia increased from fetal to postnatal newborn, juvenile, young and adult animals. However, the numbers of
 34" height="505.59001159668 " />
Figure 54. Histograms demonstrating the labeling index (top), number of labeled mitochondria (middle) and number of mitochondria (bottom) of the type I epithelial cell of an adult mouse at postnatal month 1, labeled with 3H-uridine.
514db3f6d9a2.jpg" width="431.20499420166" height="501.219976806641 " />
Figure 55. Histograms demonstrating the labeling index (top), number of labeled mitochondria (middle) and number of mitochondria (bottom) of the type II epithelial cells labeled with 3H-uridine.
 31.20499420166" height="512.144976806641 " />
Figure 56. Histograms demonstrating the labeling index (top), number of labeled mitochondria (middle) and number of mitochondria (bottom) of the interstitial cells labeled with 3H-uridine.
52715a2.jpg" width="432.25" height="501.219976806641 " />
Figure 57. Histograms demonstrating the labeling index (top), number of labeled mitochondria (middle) and number of mitochondria (bottom) of the endothelial cells labeled with 3H-uridine.
53a39ebf66e.jpg" width="403.84500579834" height="303.14500579834 " />
Figure 58. LMRAG of the testis tissue of a mouse at postnatal day month 1. Silver grains are localized over the nucleus as well as over the cytoplasm (mitochondria) of the spermatogonia showing DNA synthesis. x 800.
labeled mitochondria and the labeling indices in these organs increased from fetal to postnatal newborn, juvenile and young adults but decreased from juvenile and young adults to senescence. The maximal timings of respective organs as well as respective macromolecular precursors were different depending upon the organs and precursors. The DNA synthesis in hepatocytes peaked at postnatal day 14, while the RNA synthesis in hepatocytes peaked at postnatal month 1 and the protein synthesis at postnatal month 6. The DNA synthesis in adreno-cortical cells peaked at postnatal month 2. These differences between the organs and the precursors may have reflected the organ specificity.
We have also studied macromolecular synthesis of mitochondria in other cell types in vivo since we had found DNA, RNA and protein syntheses in cultured cells in vitro [1]. The results were reviewed in previous review article [35], as well as in several recent monographs [35,43-45].
These results indicate that the mitochondria in respective cell types of these organs synthesize DNA, RNA and proteins by themselves, increase and decrease due to the aging of the individual animals depending upon the organ specificities.
These results form parts of special cytochemistry [34] and special radioautographology [35].
8. ACKNOWLEDGEMENTS
These studies cited from the original articles authored and co-authored by the present author and associates were supported in part by Grant-in-Aids for Scientific Research from the Ministry of Education, Science and Culture of Japan (No. 02454564) while the author worked at Shinshu University School of Medicine as well as Grants for Promotion of Characteristic Research and Education from the Japan Foundation for Promotion of Private Schools (1997, 1998 1999, 2000) while the author worked at Nagano Women’s Jr. College. The author is also grateful to Grant-in-Aids for Scientific Research from the Japan Society for Promotion of Sciences (No. 18924034, No. 19924204 and No. 20929003) while the author has been working at Shinshu Institute of Alternative Medicine and Welfare since 2005 up to the present time. The author thanks Dr. Kiyokazu Kametani, Technical Official, Research Center for Instrumental Analysis, Shinshu University, for his technical assistance in electron microscopy during the course of this study.
REFERENCES
- Nagata, T., Shibata, O. and Nawa, T. (1967) Incorporation of tritiated thymidine into mitochondrial DNA of the liver and kidney cells of chickens and mice in tissue culture. Histochemie, 10(4), 305-308.
- Nagata, T. (1972) Radioautographic study on intramitochondrial nucleic acid synthesis: Its relationship to the cell cycle in cultivated cells. Proceedings of the 4th International Congress Histochemistry Cytochemistry, Kyoto, 1972, 223-224.
- Nagata, T. (1972) Electron microscopic radioautography of intramitochondrial RNA synthesis of HeLa cells in culture. Histochemie, 32(2), 163-170.
- Nagata, T. (1972) Quantitative electron microscope radioautography of intramitochondrial nucleic acid synthesis. Acta Histochemica Cytochemica, 5, 201-203.
- Nagata, T. (1974) Electron microscopic radioautography of intramitochondrial nucleic acid syntheses in mammalian cells in vitro. Proceedings of the 8th International Congress of Electron Microscopy, Canberra, 1974, 346- 347.
- Nagata, T., Yamada, Y., Iwadare, N. and Murata, F. (1975) Relationship of intramitochondrial nucleic acid synthesis to the nucleoli in cultivated cells as revealed by electron microscopic radioautography. Proceedings of 10th International Congress Anat., Tokyo, 1975, 474-475.
- Nagata, T. and Murata, F. (1977) Electron microscopic dry-mounting radioautography for diffusible compounds by means of ultracryotomy. Histochemistry, 54(1), 75-82.
- Nagata, T., Iwadare, N. and Murata, F. (1977) Electron microscopic radioautography of nucleic acid synthesis in cultured cells treated with several carcinogens. Acta Pharmacologica Toxicologica, 41, 64-65.
- Nagata, T. (1984) Electron microscopic observation of target cells previously observed by phase-contrast microscopy: Electron microscopic radioautography of laser beam irradiated cultured cells. Journal of Clinical Electron Microscopy, 17, 589-570.
- Nagata, T., Ito, M. and Chen, S. (2000) Aging changes of DNA synthesis in the submandibular glands of mice as observed by light and electron microscopic radioautography. Annals of Microscopy, 1, 13-22.
- Nagata, T., Ohno, S., Kawahara. I., Yamabayashi, S., Fujii, Y. and Murata, F. (1979) Light and electron microscopic radioautography of nucleic acid synthesis in mitochondria and peroxisomes of rat hepatic cells during and after DEHP administration. Acta Histochemica Cytochemica, 16, 610-611.
- Nagata, T., Ohno, S., Yoshida, K. and Murata, F. (1982) Nucleic acid synthesis in proliferating peroxisomes of rat liver as revealed by electron microscopical radioautography. Histochemica Journal, 14(2), 197-204.
- Nagata, T., Fujii, Y. and Usuda, N. (1982) Demonstration of extranuclear nucleic acid synthesis in mammalian cells under experimental conditions by electron microscopic radioautography. Proceedings of 10th International Congress Electron Microscopy, Hamburg, 1982, 305-306.
- Ma, H. and Nagata, T. (1988) Studies on DNA synthesis of aging mice by means of electron microscopic radioautography. Journal of Clinical Electron Microscopy, 21, 335-343.
- Ma, H., Gao, F., Sun, L., Jin, C. and Nagata, T. (1994) Electron microscopic radioautographic study on the synthesis of DNA, RNA and protein in the livers of aging mice. Medical Electron Microscopy, 27(3-4), 349-351.
- Nagata, T. and Ma, H. (2005) Electron microscopic radioautographic study of RNA synthesis in hepatocyte mitochondria of aging mouse. Microscopy Research Technique, 67(2), 55-64.
- Nagata, T., Usuda, N. and Ma, H. (1986) Electron microscopic radioautography of nucleic acid synthesis in pancreatic acinar cells of prenatal and postnatal aging mice. Proceedings of 11th International Congress Electron Microscopy, Kyoto, 1986, 2281-2282.
- Nagata, T. (1992) Radiolabeling of soluble and insoluble compounds as demonstrated by light and electron microscopy. In: Wegmann, R.J. and Wegmann, M.A. Eds., Recent Advances in Cellular and Molecular Biology, Peters Press, Leuven, 9-21.
- Sun, L., Gao, F., Jin, C. and Nagata, T. (1997) DNA synthesis in the trachea of aging mice by light and electron microscopic radioautography. Acta Histochemica Cytochemica, 30, 211-220.
- Sun, L., Gao, F. and Nagata T. (1995) Study on the DNA synthesis of pulmonary cells in aging mice by light microscopic radioautography. Molecular Biology of Cell, 41(6), 851-859.
- Sun, L. (1995) Age related changes of RNA synthesis in the lungs of aging mice by light and electron microscopic radioautography. Molecular Biology of Cell, 41(8), 1061- 1072.
- Hanai, T. and Nagata, T. (1995) Electron microscopic radioautographic study on nucleic acid synthesis in perinatal mouse kidney tissue. Medical Electron Microscopy, 27(3-4), 355-357.
- Gao, F., Ma, H., Sun, L., Jin, C. and Nagata, T. (1994) Electron microscopic radioautographic study on the nucleic acid and protein synthesis in the aging mouse testis. Medical Electron Microscopy, 27(3-4), 360-362.
- Gao, F., Chen, S., Sun. L., Kang, W., Wang, Z. and Nagata, T. (1995) Radioautographic study of the macromolecular synthesis of Leydig cells in aging mouse testis. Molecular Biology of Cell, 41, 145-150.
- Yamada, A.T. and Nagata, T. (1994) Light and electron microscopic radioautography of DNA synthesis in the endometria of pregnant ovariectomized mice during activation of implantation window. Molecular Biology of Cell, 38(7), 763-774.
- Yamada, A.T. and Nagata, T. (1994) Ribonucleic acid and protein synthesis in the uterus of pregnant mouse during activation of implantation window. Medical Electron Microscopy, 27(3-4), 363-365.
- Ito, M. and Nagata, T. (1996) Electron microscopic radioautographic study on DNA synthesis and the ultrastructure of the adrenal gland in aging mice. Medical Electron Microscopy, 29(3-4), 145-152.
- Liang, Y., Ito, M. and Nagata, T. (1999) Light and electron microscopic radioautographic studies on RNA synthesis in aging mouse adrenal gland. Acta Anatomica Nipponica, 74(3), 291-300.
- Cui, H., Gao, F., Ma, H. and Nagata, T. (1996) Study on DNA synthesis of cellular elements in the cerebella of aging mice by light and electron microscopic radioautography. Proceedings of the 4th China-Japan Joint Histochemistry and Cytochemistry Symposium, Chongqing, 1996, 111-112.
- Gunarso, W., Gao, F., Cui, H., Ma, H. and Nagata, T. (1996) A light and electron microscopic radioautographic study on RNA synthesis in the retina of chick embryo. Acta Histochemica, 98(3), 300-322.
- Gunarso, W., Gao, F. and Nagata, T. (1997) Development and DNA synthesis in the retina of chick embryo observed by light and electron microscopic radioautography. Molecular Biology of Cell, 43(2), 189-201.
- Kong, Y. and Nagata, T. (1994) Electron microscopic radioautographic study on nucleic acid synthesis of perinatal mouse retina. Medical Electron Microscopy, 27(3-4), 366-368.
- Nagata, T. (1972) Radioautographic study on intramitochondrial nucleic acid synthesis: Its relationship to the cell cycle in cultivated cells. Proceedings of 4th International Congress Histochemica Cytochemica, Kyoto, 1972, 223-224.
- Nagata, T. (2001) Special Cytochemistry in Cell Biology. In: Jeon, K.W. Ed., International Review of Cytology, Academic Press, New York, 33-151.
- Nagata, T. (2002) Radioautographology General and Special, In: Graumann W. Ed., Progress in histochemistry and cytochemistry, Urban & Fischer, Jena, 2002, 37(2), 57-226.
- Nagata, T. (1997) Techniques and application of microscopic radioautography. Histology and Histopathology, 12(4), 1091-1124.
- Nagata, T. (1996) Techniques and application of electron microscopic radioautography. The Journal of Electron Microscopy, 45(4), 258-274.
- Nagata, T. and Ma, H. (2003) Electron microscopic radioautographic study on nucleic acid synthesis in amitotic hepatocytes of the aging mouse. Medical Electron Microscopy, 36(4), 263-271.
- Nagata, T. and Ma, H. (2005) Electron microscopic radioautographic study on mitochondrial DNA synthesis in hepatocytes of aging mouse. Annals of Microscopy, 5, 4-18.
- Nagata, T. and Ma, H. (2005) Electron microscopic radioautographic study on RNA synthesis in hepatocytes of aging mouse. Microscopy Research and Technique, 64, 55-64.
- Nagata, T. (2006) Electron microscopic radioautographic study on protein synthesis in hepatocyte mitochondria of developing mice. Annals Microscopy, 6, 43-54.
- Nagata, T. (2007) Macromolecular synthesis in hepatocyte mitochondria of aging mice as revealed by electron microscopic radioautography. I. Nucleic acid synthesis. In: Vilas, A.M. and Alvarez, J.D. Eds., Modern Research and Educational Topics in Microscopy, Formatex, Badajoz, Spain, 245-258.
- Nagata, T. (2007) Macromolecular synthesis in hepatocyte mitochondria of aging mice as revealed by electron microscopic radioautography. II. Protein synthesis. In: Vilas, A.M. and Alvarez, J.D. Eds., Modern Research and Educational Topics in Microscopy, Formatex, Badajoz, Spain, 259-271.
- Nagata, T. (2008) Sexual difference between the macromolecular synthesis of hepatocyte mitochondria in male and female mice in aging as revealed by electron microscopic radioautography. In: Benninghouse, H.T. and Rosset, A.G. Eds., Women and Aging, Nova Sci. Publishers, USA, 461-487.
- Nagata, T. (2009) Protein synthesis in hepatocytes of mice as revealed by electron microscopic radioautography. In: Esterhouse, T.E. and Petrinos, L.B., Eds., Protein Biosynthesis, Nova Sci. Publishers, New York, USA, 133-161.
Journal Menu >>
- 535353; font-size: 12px; _font-size: 7px; padding: 0 5px 0 0">●Indexing
- 535353; font-size: 12px; _font-size: 7px; padding: 0 5px 0 0">●View Papers
- 535353; font-size: 12px; _font-size: 7px; padding: 0 5px 0 0">●Aims & Scope
- 535353; font-size: 12px; _font-size: 7px; padding: 0 5px 0 0">●Editorial Board
- 535353; font-size: 12px; _font-size: 7px; padding: 0 5px 0 0">●Guideline
- 535353; font-size: 12px; _font-size: 7px; padding: 0 5px 0 0">●Article Processing Charges
- 535353; font-size: 12px; _font-size: 7px; padding: 0 5px 0 0">●Paper Submission
- 535353; font-size: 12px; _font-size: 7px; padding: 0 5px 0 0">● ABB Subscription
- 535353; font-size: 12px; _font-size: 7px; padding: 0 5px 0 0">●Free Newsletter Subscription
- 535353; font-size: 12px; _font-size: 7px; padding: 0 5px 0 0"> ●Most popular papers in ABB
- 535353; font-size: 12px; _font-size: 7px; padding: 0 5px 0 0">●Publication Ethics Statement
- 535353; font-size: 12px; _font-size: 7px; padding: 0 5px 0 0">●About ABB News
- 535353; font-size: 12px; _font-size: 7px; padding: 0 5px 0 0">●Frequently Asked Questions