Modern Economy
Vol.07 No.10(2016), Article ID:70418,15 pages
10.4236/me.2016.710106
The Effect of Firm Size on Regional Innovation Efficiency in China
Linhai Mei, Wen Shao
Jinan University, Guangzhou, China

Copyright © 2016 by authors and Scientific Research Publishing Inc.
This work is licensed under the Creative Commons Attribution International License (CC BY 4.0).
http://creativecommons.org/licenses/by/4.0/


Received: August 1, 2016; Accepted: September 4, 2016; Published: September 7, 2016
ABSTRACT
The paper uses panel data of 30 provinces in China from 1998 to 2012 to calculate their innovation efficiency by DEA model. Meanwhile we use Tobit model to discuss the effect of firm size on regional innovation efficiency. In order to solve endogeneity problem, we choose an instrumental variable to replace firm size. Although from Figure 2, firm size and innovation efficiency show an inverted U-shaped relationship, at this stage enterprises in China are usually small, which leads most of them stay at the left side of inverted U-shaped curve. Our main conclusion is that at this stage in China, firm size and innovation efficiency have a linear relationship. Other variables such as dependence on trade, level of urbanization and education also have positive effect on innovation efficiency.
Keywords:
Firm Size, Innovation Efficiency, DEA-Tobit

1. Introduction
Since the reform and opening up, construction of China’s socialist modernization has made remarkable achievements. Meanwhile GDP continued to increase, and it surpassed Japan to become the world’s second largest economy. However, in recent years, with the gradual disappearance of reform dividend, economic growth is slowing down, China is facing unprecedented pressure. Innovation is the core of modern economic growth, and over the past decade, China had put it to a strategic height, and we tried to use innovation to break the bottleneck of economic growth. China held a National Conference in 2006, it tried to make China an innovation-oriented country. From then on government’s investment in research and development continues to increase, and government uses more and more policies and regulations to guide our overall innovation activities. According to the statistics of National Bureau, science and technology funds in China continued to increase in 2012, total investment in research, experimentation and development for the first time exceeded one trillion yuan, and the total funding ranked third in the world. Figure 1 shows China’s actual R&D funding from 1998 to 2012. From the figure we can see that our investment in science and technology activities increased year by year, and the speed of increase also showed an increasing trend. Using the price in 1998 as the base period to eliminate price fluctuations, the actual funding in 2012 was about 70 million.
Even though we pay close attention to innovation, our input and output are beyond proportion. During the Third Plenary Session of the Eighteenth Central Committee, government analyzed 31 provinces’ level of development. The analysis found that regional technology innovation is still insufficient. Gap between China and developed countries in Europe and America is still obvious, and the situation that our core technology is depending on foreign countries has not been improved. According to statistics of customs, in 2012 China’s IC imports amounted to $172.499 billion, imports amounted to 2197.17, and the same as number of China’s crude oil imports. The amazing situation indicated that China had not the core capacity of technology production, the huge funding in research and development did not solve the problem that we lacked of ability to innovate.
At present it’s extremely important for us to improve our innovative ability. In fact, enterprises are the main element in technological innovation. In Europe and other developed countries, 80% of the research work was done in large enterprises. So in order to improve the overall ability of technical innovation, we need to enhance enterprises’ capability of independent innovation. But at the stage enterprises in China are accessories in the cooperation of industry-university-research. On the one hand China lacks of adequate intellectual property protection system, enterprises’ output cannot offset input. Their motivation to innovate must be weaken. On the other hand, currently our market is disperse, there are so many enterprises in all kinds of industry. It’s difficult for a small firm to make huge profit. As a consequence they do not have enough money
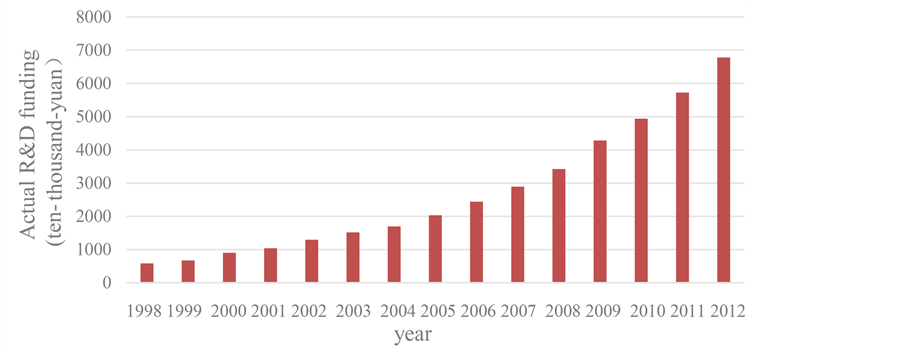
Figure 1. 1998-2012 Actual R&D funding histogram in China.
to carry out high-investment research and development. But as the main element of innovation, the status of enterprises cannot be replaced. Edwin Mansfield and Morton Kaman who were the representatives of Technological Innovation Economic Theory analyzed the relationship between technological innovation and firm size. They found in terms of technological innovation, firm size was an important element. In fact the effect of firm size on innovation is very complex. Schumpeter who was the founder of innovation theory thought that large firms had more powerful economic strength than small firms’ economic strength. They can provide advanced equipment and recruitment talented employees. However it does not mean that firm size can be infinite large. Because management efficiency will be insufficient accompanied with firm size being large. At present China lacks both adequate intellectual property protection system and completely competitive market. Will firm size have obvious effect on technological innovation? How large the impact will be? This article will discuss these problems in detail.
The paper is organized as follows. The second part is literature review; the third part aims to select research methods and variables; the fourth part is empirical analysis; the fifth part is the conclusion and policy recommendations.
2. Literature Review
Domestic and foreign scholars carried out a lot of discussion on the relationship between firm size and innovation activities, but scholars have not come to a unified conclusion. Overall, the research on firm size and technological innovation can be divided into three categories. First, the impact that firm size has on input in R&D activities. Second, the impact that firm size has on output in R&D activities. Third, the impact that firm size has on innovation efficiency.
Scholars generally use R&D expenditure to measure innovation inputs, such as Culbertson (1985) [1] . He studied the effect that firm size had on firms’ R&D expenditure and the industries’ R&D expenditure. The main conclusion is that change of a firm’s size will cause other firms in the industry change their firm size. Firm size’s being larger may increase its R&D expenditure but decrease the total R&D expenditure in the industry. Meanwhile, many scholars examined the effect of firm size on allocation of R&D effort between process and production innovation. They had similar conclusion. Mansfield (1981) [2] based on data for over 100 firms in a dozen industries and found that with the expansion of firm size spending on basic research was increasing, but inversely spending on product innovation was declining. Cohen and klepper (1996) [3] found that process and product innovation systematically differ regarding the extent to which they can be sold in disembodied form and generate discontinuous growth. More generally the finding also supported the basic idea that larger firms had an advantage in R&D because of the larger output over which they can apply the results-thus spread their costs-of their R&D. Yin and Zuscovitch (1998) [4] combined theory with model derivation and found that large companies were more inclined to process innovation, inversely small businesses tend to product innovation. Therefore, large companies dominated in the original product market. And small companies dominated in the new product market. As for the relationship between firm size and R&D expenditure in China, Jefferson (2004) [5] based on the panel data of 5451 companies in China and found that there were no significant relationship between firm size and R&D expenditure.
Research on the relationship between firm size and innovation output might be endless, but the conclusion is not consistent. Some scholars believed that both of large and small companies had their own comparative advantages, such as Acs and Audretsch (1987) [6] in 1982. They based on the four-digit manufacturing industry data, and found that in capital-intensive industries large enterprises had innovation advantages. In new technology-intensive industry, medium and small enterprises were more innovative. Some scholars thought that large companies produce more innovations, such as Gayle (2001) [7] used 33,250 enterprises’ panel data from 1976 to 1992 and found that firm size has a significant positive impact on innovation output. Some scholars believed that as long as control certain factors, there were significant relationship between firm size and innovation output. Such as Acs and Audretsch (1988) [8] found that the innovation activities were affected by technological and economic environment. The more firms that owned staffs beyond 500 in a industry, the more innovative activities the industry would have. Gifford (1992) [9] used the model to deduce that if monopoly and firm size had effect on innovation depended on the enterprise technology environment. Technological environment refers to the degree of economic boom. When the economy bottomed, entrepreneurs have to consider withdrawing from the market or innovating in order to survive. Then the author of the study found that when the economy went well, firm size started to have effect on innovation. Ajay (2014) [10] examined MSA- level patent data during the period 1975-2000 and found that innovation output is higher in regions where both a sizable population of small firms and large labs are present. As for the relationship between enterprises in China and innovative output, scholar Zhengbo Peng (2007) [11] used Industrial Statistics in China from 2000 to 2003 and found that the relationship between firm size and innovation output was not a simple linear relationship. It can be expressed as U-shaped or inverted U-shaped. Liangmou Gao and Yu Li (2009) [12] found that firm size and technological innovation inverted U-shaped relationship. Zedong Niu, Qianxiao Zhang and Wen Wang (2011) [13] used a nonlinear regression model smooth transition panel to analysis the relationship between firm size in high-tech industries and technological innovation, the results showed their relationship was inverted U-shaped.
Research from the perspective of innovation efficiency is relatively less, Ronde and Huccler (2005) [14] found that the relationship between firm size and innovation efficiency was not determined, it depended on the country’s science and technology policy. Petra and Susanne (2013) [15] discussed from the point of view that if innovation activities were outsourced. Results showed that if company outsourced innovation activities, small firm size might have advantage. If company innovated themselves, then large firm may do well. Revilla and Fernández (2012) [16] based on Spanish corporate data and found in the dynamics mechanism of technological innovation firm size and innovation efficiency showed negative relationship. Junhong Bai (2011) [17] used SFA model and found that there was a positive linear relationship between firm size and innovation efficiency.
Overall, research on the relationship between firm size and innovation input were concentrated before 20000. And the conclusions were similar. In regard to firm size and innovation output, the quantity of research was large. And the conclusion was very inconsistent. The reason why scholars’ conclusions differ, possibly because of their sample selection, measurement methods and various metrics were not the same, and the relationship between firm size and innovation activities also cannot be answered by a simple conclusion. The research about firm size and efficiency of innovation was beginning at the last decade. Domestic literature about the firm size and innovation efficiency is few. Since innovation efficiency considers both the inputs and outputs, it can reflect the effect of firm size on innovation activities more comprehensive. It is why the paper chooses this research point. More importantly, the paper uses Shapley decomposition to analysis regional innovation efficiency. It can analyze the contribution of firm size to regional innovation efficiency’s difference, which is an innovative point of this paper.
3. Research Methods and Variables Selection
3.1. Research Methods
The paper uses two stage model of DEA-Tobit to analyze the effect that firm size has on innovation efficiency. The first stage is using data envelopment analysis (DEA) model to estimate innovation efficiency of 30 provinces in China. The second stage will use innovation efficiency as dependent variable, and analyze the influence factors by Tobit model.
To construct a variable scale reward DEA model, we first need to build a production possibility set. Suppose each region using N kinds of inputs  to get M kinds of outputs
 . We use
  to represent production possibility set:
 . (1)
. (1)
Suppose the production possibility set is a closed and bounded set, outputs and inputs can be freely disposed of, in each period , the region
  has a set of input and output which can be represented by
 . So DEA can be used to build a technical model as follow:
 (2)
(2)
among them  indicates the weight which is conferred by each observation.
indicates to tectonic boundary in the case of variable returns to scale. Next we solve linear programming model, we regard region I as district I namely DMU unit. For each DMU, to make it the most efficient means to use the least input to have certain output, namely:
 (3)
(3)
If the optimal solution of  is 1, then the DMU is weak DEA efficient. If the
 , and
, and , The DMU is DEA efficient. Because the value of
  is between [0,1], it is bounded, therefore we choose Tobit model to analyze the impact factors. Expression of Tobit model is as follow:
 (4)
(4)
among them ,
,  is
is  in the DEA model. And
  may be a set of variables,
  is independent random disturbance. RHS obeys normal distribution.
When  it means the value of innovation efficiency can be observed, or that cannot be observed.
3.2. Variables Selection
In a two input-two output model, two input variables respectively are R&D personnel FTE of above-scale industrial enterprises and R&D intramural expenditure of above- scale industrial enterprise. The output variables are sales revenue of new product and the number of patents which are accredited. Other scholars also use the number of R&D activities personnel, R&D expenditure, the funding spent on new product development and the number of scientists and engineers as input variables. Patent applications, the output value of new product are also used as output variables by many scholars. The full-time equivalents here refer to the total of full-time personnel converted by full-time staff plus part-time staff. It is more precise than R&D activities personnel. Considering that the paper aims to analyze regional innovation efficiency, so we use R&D intramural expenditure rather than spending on new product development.
Besides firm size, we selected 5 variables to analyze factors which have influence on innovation efficiency, namely FDI, government behavior, dependence on trade, education, and urbanization. The full name of FDI is foreign direct investment. It will not only bring capital to the provinces, but also introduce technology. There is an overflow brought by foreign capital. So the technology spillover cannot be ignored. Thus the impact of FDI on innovation efficiency is expected to be positive. Government behavior means the part of R&D expenditure raised by government. Government’s raising science and technology funds can increase output of innovative products, but the impact on efficiency is complex. Because efficiency measures a firm’s ability to transfer inputs into outputs. But it does not mean that efficiency will be improved. Therefore impact of government behavior on innovation efficiency is uncertain. Trade dependence ratio is measured by the industry export delivery value of GDP, reflecting the country’s dependence on foreign trade industry, its impact on innovation efficiency is uncertain. The level of education is measured by the ratio provincial education funding to provinces’ GDP in the same year. It reflects the level of supporting on education by provinces. It can also reflect the level of human capital in a province. Thus the impact of it on the innovation efficiency is expected to be positive. Urbanization level is measured by urban road space per capital. Urbanization level has direct impact on all kinds of local facilities, the ability to raise capital and the capacity to absorb talents. Therefore this factor should be included in. And its impact on innovation efficiency is expected to be positive.
Firm size as an important explanatory variable can be measured by different standards. According to Yanbing Wu (2008) [18] , we can use average value of production per company and the average number of employees per company to denote firm size. The paper choose the first one, namely the total industrial output value divides by total number of company. At the same time according to the Xiaohua Sun and Yun Wang (2014) [19] , we use the average number of employees as an instrument to solve the endogenous problem. The average number of employees is measured by the industrial employees in a whole province divides by the total number of firms in the same province.
Input and output data is obtained from the 1999-2013 “China Statistical Yearbook on Science and Technology”. R&D intramural expenditure of above-scale industrial enterprise and sales revenue of new product are disposed by consumer price deflator. The paper selects the data from 1998 to 2012. Due to the incomplete data of Tibet, we just choose 30 provinces to analyze. The data of dependence on trade and government behavior is obtained from 1999-2013 “China Statistical Yearbook on Science and Technology” and “Statistical Yearbook of the industrial economy”. The data of level of urbanization, education, and firm size is obtained from 1999-2013 “China Statistical Yearbook”. The data of FDI is obtained from each provincial statistical Yearbook.
4. Empirical Analysis
4.1. The Measure of Innovation Efficiency
Table 1 shows the estimation results of innovation efficiency in each province. Overall, there are some differences between each province in our country. From 1998 to 2012, the highest value of average innovation efficiency is 1, the lowest was 0.797. Among them, the following provinces own the highest value of innovation efficiency, they are Shanghai, Hainan, Qinghai, Guangdong and Beijing. Their value of innovation efficiency are 1, 1, 1, 0.989 0.988. Innovation efficiency is the lowest in Shanxi, Gansu, Shanxi, Guizhou and Hubei, and its values are 0.797, 0.809, 0.826, 0.833 0.836. As of 2010, from the historical context of innovation efficiency, Beijing, Shanghai, Zhejiang, Hainan, Qinghai have better performance, they maintain a high level. The value of innovation efficiency in Tianjin, Jiangsu, Shandong, Chongqing shows a steadily trend of

Table 1. Innovation efficiency value of 30 provinces in China from 1998 to 2012.
Source: “China Statistical Yearbook from 1999 to 2013 on Science and Technology” and “Industrial Economy Statistical Yearbook from 1999 to 2013”.
increasing. On the contrary, Hebei, Shanxi, Xinjiang shows a trend of decreasing. It is not difficult to see that the provinces that have high innovation efficiency are basically developed coastal areas, possibly because the reform and opening policy tilt as well as the original resource endowment. After 2010, the value of innovation efficiency in all provinces declined. One possible reason is that the 2008 financial crisis led to excess capacity, making the product unmarketable, output fell. Another possibility is that our ability to innovate has risen to a bottleneck, practical solutions must be found if you want to break through the bottleneck.
30 provincial-level administrative regions are divided into eastern, central and western regions by geographical location. All things considered, in addition to the decline in 2001, the average value of innovation efficiency in China shows little fluctuation. It remained almost steady state. This conclusion is the same as XiuSong Shi, Shudong Zhao and Fu Wu (2009) [20] , their research also found that the efficiency of regional innovation in 2000 and 2001 slightly decreased. The declining in 2001 is probably due to our country’s joining in WTO. While in long term joining the WTO means more choices, China will benefit from it. But in short term there is a certain impact on China. Global trade liberalization on the one hand leads the small-scale enterprises to face tremendous pressure. On the other hand, our large-scale enterprises show unchecked expansion of their firm size. So their innovation must be inefficient. In 1998, national average innovation efficiency was 0.923, while in 2011, the national average innovation efficiency was 0.922, but it felt to 0.83 in 2012. Our technological innovation relies mainly on a lot of investment in research funding, so the fluctuations of macroeconomic policies have fatal influence on innovation efficiency. When the economical situation is good, government will put large investment in industry innovation and efficiency will be relatively high. In terms of eastern, central and western regions’ average innovation efficiency, the overall trend is consistent with the national average innovation efficiency. But the value in eastern is still highest. Its annual average innovation efficiency is higher than the national average. The central and western regions are basically lower than the national average. High efficiency means that the eastern region with the same input can be more productive. The possible reason may be that the regional advantages of national policy tilt. Since the reform and opening up, our country insists on rich former leads latter, eventually together. It means the priority development of the eastern region so that they get more resources. More importantly, the eastern coastal areas can be relatively easy to get access to FDI. And the technology exists overflow, FDI brings not only capital, but also more advanced foreign technology. From the comparison of eastern region’s innovation efficiency and national average innovation efficiency, the advantage of the eastern is getting weaker. Possible reason may be that our country starts to carry out balanced regional infrastructure projects, which make it easier for the central and western to get access to advanced technologies and more resources. The central region owns higher innovation efficiency compared to the western region. It is consistent with the traditional interpretation of the three regions. Scholars in China have different opinions on the comparison of central and western region’s innovative efficiency. Junhong Bai (2008) [17] found that the value of innovation efficiency in central region is not necessarily higher compared with western region. They are alternately rising. Zheng Zhao and Yan Jiang (2013) [21] found that before 2003 innovation efficiency in central regions is higher than western region. But after 2003, innovation efficiency in western region is higher than central region. Possible reason may be they chose different input and output variables.
4.2. Analysis of Influence Factors
In Equation (4), we base on China’s 30 provincial-level panel data and get a result of regression in Table 2. There are 4 models in Table 2.
From the model (1), coefficient of dependence on trade is significantly positive, indicating that exports will help to improve the technical level. Dependence on trade reflects the market conditions of a region, a high value of dependence on trade indicates a high degree of openness. Thus we own more opportunity to communicate with foreign technology and therefore its coefficient is positive.
Urbanization coefficient is positive at the 10% significance level. The level of urbanization reflects the level of a region’s infrastructure, public transport, etc. A high level of urbanization means a greater chance to get access to advanced technologies. Thus the innovation efficiency in that region must be higher.
The coefficient of education is positive at the 5% significance level. Nowadays, education spending in GDP is increasing, indicating that more and more provinces are
Table 2. Factors innovative efficiency regression results.
Note: ***, **, * represent the 1%, 5% and 10% significance level, t values in parentheses.
paying more attention to education. In fact, the level of education can reflect the level of human capital in the province. The level of education can promote innovation efficiency.
FDI had no significant impact on innovation efficiency. To some extent FDI can bring foreign advanced technology and improve efficiency, but as Zhaoyang Lu and Shanshan Liu (2012) [22] , FDI and innovation capacities had a very complex relationship, not simple linear relationship. FDI technology spillover exists a significant impact on regional innovation capability based on the level of intellectual property protection “double threshold effect”. Only across the region corresponding to the level of intellectual property protection barriers, FDI technology spillover can promote regional innovation capability.
The variable of government behavior also has no significant impact on innovation efficiency, consistent with Lian Zhou and Kai Luo (2005) [23] . It confirmed that government did not play an important role in promoting innovation efficiency. The reform of state-owned enterprises in 2015 is a new beginning of government behavior. It aims at encouraging state-owned to inject capital to private enterprises.
As an important explanatory variable, firm size has significant impact on innovation efficiency. But when we add the squared term in the enterprise scale model (2), the first term and squared term of firm size are both insignificant. As Junhong Bai (2011) [17] , firm size has a significant positive impact on innovation efficiency. But they show a inverted U-shaped relationship. As it can be seen from Figure 2, when the firm size is less than 200 million yuan with the rise of firm size innovation efficiency is rising. When firm size is larger than 200 million yuan, innovation efficiency tends to decrease. However squared coefficient is not significant, firm size and innovation efficiency continues to show a linear relationship. Possible reasons are that the firm size of enterprises in China is usually small. They are staying at the left of 200 million yuan, which is consistent with Xiaohua Sun and Yun Wang (2014) [19] , but Xiaohua Sun and Yun Wang (2014) [19] removed smaller-scale enterprise data.
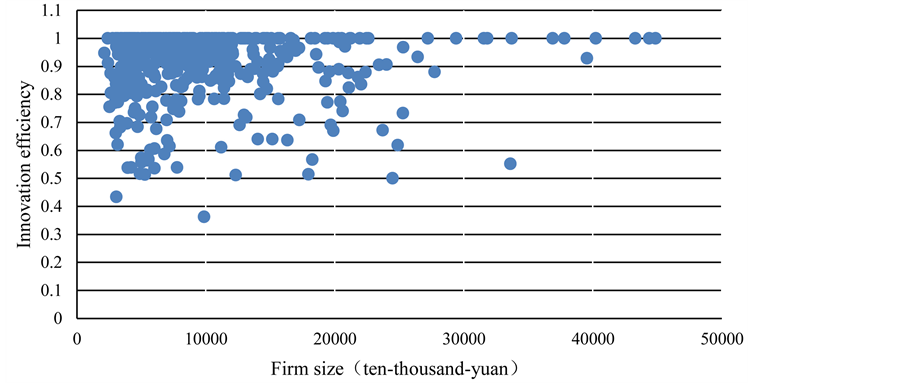
Figure 2. Scatter plot of firm size and innovation efficiency.
4.3. Robustness Test
Firm size can affect innovation efficiency, but innovation efficiency will in turn affect the firm size. So in order to solve the endogeneity problem, we use the average number of employees as instrumental variables to replace firm size which is the same as Xiaohua Sun and Yun Wang (2014) [19] .
Model (3) in Table 2 uses the average number of employees as independent variable, and the model (4) adds the squared term of average number of employees. From the model (3), firm size still has a positive impact on innovation efficiency which is consistent with the model (1). Besides dependency on trade, level of urbanization, and level of education still show positive impact. While the coefficient of foreign direct investment and government behavior is still insignificant. In model (4) coefficient of squared term is not significant, which confirms there is a linear relationship between firm size and innovation efficiency.
5. Conclusions and Implications
5.1. Conclusions
Since the reform and opening up, “bringing in” and “going out” have brought a huge gospel to our country. Not only our economy has created a new high, but also advanced Western technology has been brought. However, in recent years, with the weakening of reform dividend, our country encountered a bottleneck in the way of constructing an innovative country. Technical plagiarism scandal broke frequently, and regional technology gap also led to a series of livelihood issues. From the perspective of innovation and efficiency, the paper begins to discuss the impact which firm size has on innovation efficiency’s differences. We try to open a new situation for China’s technological progress.
The paper uses panel data of China’s 30 provinces from 1998 to 2012 to calculate their innovation efficiency by DEA model. We try to discuss the impact which firm size has on the innovation efficiency. The main conclusions are as follow. Firstly from a scatter plot, although firm size and innovation efficiency show an inverted U-shaped relationship, and the scale of the country’s industrial enterprises are generally small. So most of companies are staying at left in the inverted U-shaped apex, this is why regression results show positive linear relationship between them. Secondly, Shapley decomposition results show that the contribution of firm size on innovation efficiency difference exceeds 20%, which is an important factor in regional innovation efficiency differences. In addition, firm size, FDI, trade dependency, education, and R&D intensity also have positive impact on regional innovation and efficiency differences. Among them, FDI’s impact on innovation efficiency is the maximum. It implies that the reform and opening up has essential contribution on increasing technology level in China. The government behavior and the urbanization have no significant impact on innovation efficiency.
5.2. Implications
In fact, China’s industrial enterprises are facing the embarrassing situation in promoting innovation. State-owned enterprise owns abundant capital but their efficiency is low. Small private enterprises lack of motivation for innovation because they lack of capital. The end of 2015, our government promotes the reform to guide state-owned enterprises, in a sense that it is the government who wants to make a difference in promoting the integration of state-owned enterprises and private enterprises. Apart from this, based on the conclusions of this paper, we get the following policy implications:
1) Firm size of China’s industrial enterprises is generally small. So economy of scale can’t make a big difference fully. Government can lead enterprises to scale up itself by policy support and financial loans. But we cannot allow unlimited expansion of enterprises, only reasonable range of firm size can promote innovative efficiency.
2) “Bringing in” and “going out” had a profound influence on our country’s innovation efficiency, although the current international situation making waves, the TPP trying to limit trade in our country. But the government still can promote the internationalization of the RMB, and at the same time use taxation and credit to absorb foreign companies in, and also encourage local enterprises to cooperate with foreign enterprises.
3) The provinces should try to cut the small-scale production of backward production capacity, reducing the gap between our province enterprise first, and then to narrow regional gap and alleviate regional imbalance in our country.
4) Reduce administrative barriers mainly dominated by state-owned enterprises, encourage more capital flowing into the industry market. Through the way of introducing competition strength, improving the efficiency of technology innovation.
5) Improving the efficiency of government funding. Our study found that government behavior has no significant effect on technological innovation efficiency. It warns us to check government directly investment on innovation. We need to supervise the use of governmental funding and arouse the innovation enthusiasm of enterprise.
Acknowledgements
Many people have made invaluable contributions, both directly and indirectly to our research. I would like to express my warmest gratitude to them. WE thank the editor and anonymous referees for their instructive suggestions and valuable comments on the writing of this thesis. And we thank the professor in Jinan university, without their help, the present thesis would not have been accomplished. Finally, we greatly appreciate all the people who helped us.
Cite this paper
Mei, L.H. and Shao, W. (2016) The Effect of Firm Size on Regional Innovation Efficiency in China. Modern Economy, 7, 1035-1049. http://dx.doi.org/10.4236/me.2016.710106
References
- 1. Culbertson, J.D. (1985) Econometric Tests and the Market Structure Determinants of R&D Investment: Consistency of Absolute and Relative Firm Size Models. Journal of Industrial Economics, 34, 101-108.
http://dx.doi.org/10.2307/2098485 - 2. Mansfield, E. (1981) Composition of R and D Expenditures: Relationship to Size of Firm, Concentration, and Innovative Output. The Review of Economics and Statistics, 63, 610-615.
http://dx.doi.org/10.2307/1935857 - 3. Cohen, W.M. and Klepper, S. (1996) Firm Size and the Nature of Innovation within Industries: The Case of Process and Product R&D. The Review of Economics and Statistics, 78, 232-243.
http://dx.doi.org/10.2307/2109925 - 4. Yin, X.K. and Zuscovitch, E. (1998) Is Firm Size Conductive to R&D Choice? A Strategic Analysis of Product and Process Innovations. Journal of Economic Behavior and Organization, 35, 243-262.
http://dx.doi.org/10.1016/S0167-2681(98)00057-2 - 5. Jefferson, G.H., Bai, H.M., Guan, X.J. and Yu, X.Y. (2004) R and D Performance in Chinese Industry. Economics of Innovation and New Technology, 13, 1-2.
- 6. Acs, Z.J. and Audretsch, D.B. (1987) Innovation, Market Structure, and Firm Size. The Review of Economics and Statistics, 69, 567-574.
http://dx.doi.org/10.2307/1935950 - 7. Gayle, P.G. (2001) Market Concentration and Innovation: New Empirical Evidence on the Schumpeterian Hypothesis. Discussion Papers in Economics.
- 8. Acs, Z.J. and Audretsch, D.B. (1988) Innovation in Large and Small Firms: An Empirical Analysis. The American Economic Review, 78, 678-690.
- 9. Gifford, S. (1992) Innovation, Firm Size and Growth in a Centralized Organization. The Rand Journal of Economics, 23, 284-298.
http://dx.doi.org/10.2307/2555989 - 10. Ajay, A.B., Iain, C.C., Alberto, G.E. and Alexander, O. (2014) Why Are Some Regions More Innovative Than Others? The Role of Small Firms in the Presence of Large Labs. Journal of Urban Economics, 81, 149-165.
http://dx.doi.org/10.1016/j.jue.2014.03.003 - 11. Peng, Z.B. (2007) Firm Size, Market Structure and Innovation-Experience from Different Industry. Journal of Zhongnan University of Economics and Law, No. 2, 106-111.
- 12. Gao, L.M. and Li, Y. (2009) The Formation Mechanism and Dynamic Extension of Firm Size and Innovation’s Inverted U Shape. Management World (Monthly), No. 8, 113-123.
- 13. Niu, Z.D., Zhang, Q.X. and Wang, W. (2012) Firm Size and Innovation in High-Tech Industry-Based on PSTR Model. Journal of Central University of Finance and Economics, No. 10, 68-74
- 14. Ronde, P. and Huccler, C. (2005) Innovation in Regions: What Does Really Matter? Research Policy, 34, 1150-1172.
http://dx.doi.org/10.1016/j.respol.2005.03.011 - 15. Petra, A. and Susanne, T. (2014) Should Firms Outsource their Basic Research? The Impact of Firm Size on In-House versus Outsourced R&D Productivity. Creativity and Innovation Management, 23, 303-317.
http://dx.doi.org/10.1111/caim.12073 - 16. Revilla, A.J. and Fernandez, Z. (2012) The Relation between Firm Size and R&D Productivity in Different Technological Regimes. Technovation, 32, 609-623.
http://dx.doi.org/10.1016/j.technovation.2012.06.004 - 17. Bai, J.H. (2011) Firm Size, Market Structure and Innovation Efficiency-Experience from High-Tech Industry. Economic Problems in China, No. 5, 65-79.
- 18. Wu, Y.B. (2007) Firm Size, Market Power and Innovation: A Reference. Economic Research, No. 5, 125-139.
- 19. Sun, X.H. and Wang, Y. (2014) The Effect of Firm Size on Productivity and Its Difference-Experience from Industrial Enterprise. Chinese Industrial Economy, No. 5, 57-70.
- 20. Shi, X.S., Zhao, S.D. and Wu, F.X. (2009) China Regional Innovation Efficiency and Its Spatial Difference. Quantitative & Technical Economics, No. 3, 45-56.
- 21. Zhao, Z. and Jiang, X. (2013) The Difference of Regional Innovation Efficiency in China. Regional Economic Review, No. 3, 72-78.
- 22. Lu, Z.Y. and Liao, S.S. (2012) Double Threshold Effect of FDI and Regional Innovation Ability. Quantitative & Technical Economics, No. 5, 75-89.
- 23. Zhou, L. and Luo, K. (2005) Firm Size and Innovation: The Experience from Province in China. Economics (Monthly), 4, 623-638.