Modern Economy
Vol.5 No.7(2014), Article
ID:47098,19
pages
DOI:10.4236/me.2014.57067
Use of the Dominance-Based Rough Set Approach as a Decision Aid Tool for the Selection of Development Projects in Northern Quebec
Jean-Charles Marin, Kazimierz Zaras, Bryan Boudreau-Trudel
Université du Québec en Abitibi-Témiscamingue, Québec, Canada
Email: jean-charles.marins@uqat.ca, kazimierz.zaras@uqat.ca, boudreab@uqat.ca
Copyright © 2014 by authors and Scientific Research Publishing Inc.
This work is licensed under the Creative Commons Attribution International License (CC BY).
http://creativecommons.org/licenses/by/4.0/


Received 30 April 2014; revised 25 May 2014; accepted 3 June 2014
Abstract
The purpose of this article is to present a summary of research results relating to the application of the dominance-based rough set (DRSA) approach to the selection of projects in the context of the Northern Quebec development plan. Based on this research, decision makers will be able to rank municipalities according to their actual needs in social and economic terms. We believe that public administrators will be able to use various socio-economic indicators in order to classify, based on chosen criteria, municipalities (objects) in one of the following four categories: [A]―the best in the region in terms of the criteria considered; [B]―those that need support in order to acquire category A status; [C]―those that need support in order to acquire category B status; [D]― those ranked lowest in the region and needing special support with regard to the criterion or criteria considered. These four categories are delimited by quartiles relative to the average ranking of municipalities. The chosen criteria are measured in order to provide decision rules based on this classification. These decision rules thus focus on the social and economic needs of municipalities with respect to improving their performance and classification. By targeting these needs, DRSA will help administrators of the Northern Quebec development plan to prioritize actions or to evaluate, for example the social and economic impact of a project in a municipality.
Keywords
Dominance-Based Rough Set, Economic Development, Project Management, Social-Economics

1. Introduction
Various decision-aid tools are available to help organizations choose courses of action. Such tools may provide support for a choice, confirm the validity of a ranking, or weigh various alternatives faced in designing projects and strategic plans. Rough set theory, developed by Pawlak [1] [2] and by Pawlakand Slowinski [3] , is a mathematical tool that may be used to support decision-making processes in fields such as medicine, banking and engineering [4] . It was modified by Greco, Matarazzo and Slowinski [5] and subsequently renamed the “dominance-based rough set approach” (DRSA). Zaras then developed it for mixed data (deterministic, probabilistic, and fuzzy) [6] . This latter approach may be used as a decision-aid tool for prioritizing certain socio-economic projects in a given region [7] . In the present study, we examine the applicability of the DRSA on a larger scale, specifically the case of extensive economic development projects in non-urban regions of the province of Quebec. We present our findings regarding the usefulness of the DRSA as a decision aid, in feasibility studies, risk analysis and prioritization for project selection in the context of the Northern Quebec development initiative called “Le Nord pour Tous” (NPT). For the purposes of this research, 32 socio-economic indicators in six categories were measured using census data representing 52 of the 62 municipalities and 73,289 persons out of the population of 121,000 of the Northern Quebec region designated by the NPT.
1.1. The Project “Le Nord Pour Tous”
1.1.1. Background
On May 9, 2011, the government of the province of Quebec formally announced its plan, called “Le Plan Nord”, for the development of Northern Quebec [8] . This project was later re-baptized “Le Nord pour Tous” (NPT). The goals remain unchanged, while some wording was modified in order to emphasize which the various social groups, in particular those that inhabit the region, should expect to gain from the investments. The government wishes to focus on the development of the following natural resources.
• Energy;
• Minerals and ores;
• Forestry;
• Fauna;
• The potential for tourism;
• The potential for the production of food and other biological products.
1.1.2. Financing
The project is expected to bring investments reaching $80 billion over a period of 25 years and to create on average about 20,000 jobs per year. Several transportation infrastructure projects have already been undertaken in order to improve access to zones considered to have economic potential [9] .
1.1.3. Geography
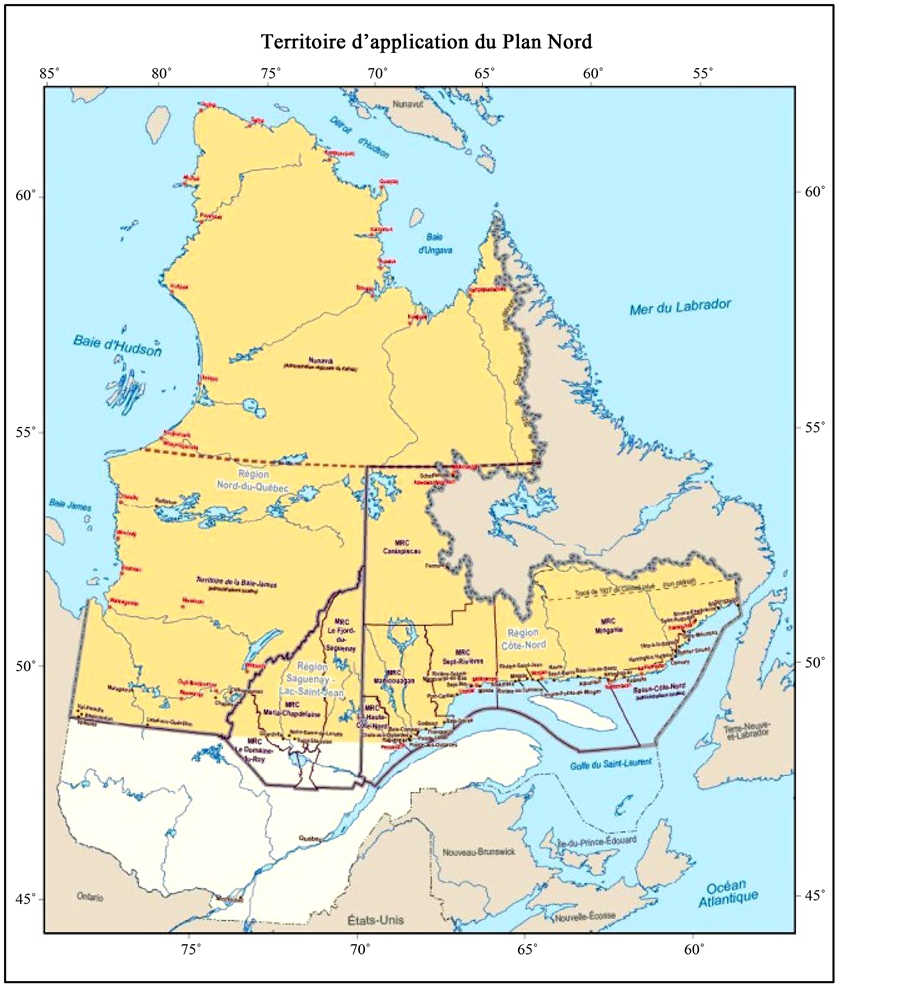
The project concerns a land area of about 1.2 million km2 north of the 49th parallel. Northern Quebec represents 63 municipalities and a population of about 120,000 persons [10] . Figure 1 shows the portion of the province that is the focus of the NPT.
1.2. Socio-Economic Indicators
The variables considered in this study were obtained from 2006 and 2011 census data compiled by Statistics Canada. They were divided into six perspectives, namely demographic, sociological, micro-economic, employment, personal income, and occupational profile, as summarized in Table 1.
1.3. Portrait of the Municipalities Included in the NPT
1.3.1. Statistics
Using Statistics Canada 2006 and 2011 census data, we calculated each indicator for a total of 56 towns and communities out of the 63 targeted by the NPT project, and a total of 121,088 persons. It should be noted that some villages are too small (population of 200 or less) to be counted as such by Statistics Canada, and that the cities of Baie-Comeau and Sept-Îles are not comparable to the other municipalities because of the large difference in population and infrastructures. The research thus focused on 52 towns and villages out of a total of 63 in the region under study, and represents 73,289 persons out of the total population of 121,088 for the region.
Unless otherwise stated, the municipalities were compared with the value of the indicator for the province as a whole (including the region).
1.3.2. Demographics
The municipalities located north of the 49th parallel represent 1.5% of the population of the province of Quebec. Excluding the cities of Baie-Comeau and Sept-Îles, this territory representing 70% of the land area of Quebec contains 0.93% of the population of the province of Quebec.
The population directly concerned by the NPT grew at a rate below the average for the province from 2006 to 2012 (3.38% versus 4.7%). However, this population has a greater proportion of individuals aged 15 years or less (24% versus 16%), and the proportion aged 65 years or more is smaller than that for the province as a whole (10% versus 16%).

Table 1. Summary of the socio-economic indicators considered in this study.
Continued
*“Active” means employed or actively seeking employment, i.e. is in the labour force.
1.3.3. Sociological Indicators
Families in Northern Quebec have more than the average number of children in Quebec (1.47 versus 1) and a smaller proportion of elderly persons living alone (18% versus 27%).
The percentage of young people, aged 15 to 24 years with a diploma, certificate or degree, is lower in the NPT region than in the province as a whole (40% versus 63%). The percentage of graduates is also lower among the active population aged 25 to 64 (56% versus 83%).
Another fact that should be noted is that the percentage of the population that has not moved in more than five years is greater in Northern Quebec (90% versus 58%).
1.3.4. Micro-Economics
The percentage of privately owned dwellings in need of major repair is higher in Northern Quebec than in the province overall (27% versus 8%), and this is in spite of the greater percentage of houses built less than 30 years ago (43% versus 27%). Persons who rent their place of residence pay on average $351 per month, compared to the provincial average of $566. Property value in Northern Quebec averages $75,961 compared to $182,399 for the province.
1.3.5. Employment
The current unemployment rate in Northern Quebec is 20.93%. The employment rate (the percent employed) among persons aged 15 years or more is 50.66%, compared to 60.4% for the province as a whole.
1.3.6. Personal Income
The median income of persons living in Northern Quebec is $22,187 compared to $24,340 for the province as a whole. The proportion of family income received in the form of transfer payments from governments is 22.49%, compared to 13.9%. The median income for families is also lower ($53,000 versus $58,678).
1.3.7. Occupational Profile
The least represented occupations in Northern Quebec are business related, natural sciences related and health care related. The proportion of persons working in the health care sector and in fields relating to natural sciences is only half of those in the province as a whole. Table 2 provides a portrait of the population of Northern Quebec in comparison with the province as a whole.
2. Statement of the Research Problem
The goal of our multi-criteria task is to rate the overall performance of each municipality relative to the group of municipalities on the basis of the indicators as a whole.
Continued
*Excluding municipalities for which the figure was 0. N indicates the number of municipalities included.
The evaluations may be conducted directly by public administrators or with the aid of a multi-criteria decision-making method. For example, the weighted average rank method may be used, in which the municipalities are ranked from the most to the least preferable in terms of each indicator for each development perspective. We then calculate for each municipality the weighted average rank in order to obtain the rating of the municipalities in a final order with respect to a given perspective.
To start with, we must carry out these calculations with respect to each perspective, from which a ranking of the 52 municipalities will be obtained that will allow us to group them into four classifications, A to D, each containing 13 municipalities.
We must then perform the same calculations, taking into consideration all of the indicators in order to determine an overall categorization. The final categorization of the municipalities must be validated by experts and accepted by administrators. The calculations will enable us to deduce, using the DRSA rough set approach, the rules on which decisions shall be based, both for overall assessment and for each perspective, and to explain the classifications obtained.
3. The Dominance-Based Rough Set Approach (DRSA) Applied to Establishing the Developmental Goals of the NPT
3.1. Description
Table 3 shows the evaluation of the 52 municipalities with respect to seven conditional criteria (classification as determined on the basis of each perspective, i.e. demographic, sociological, micro-economic, employment, income and occupational profile) and with respect to the sole decisional criterion.
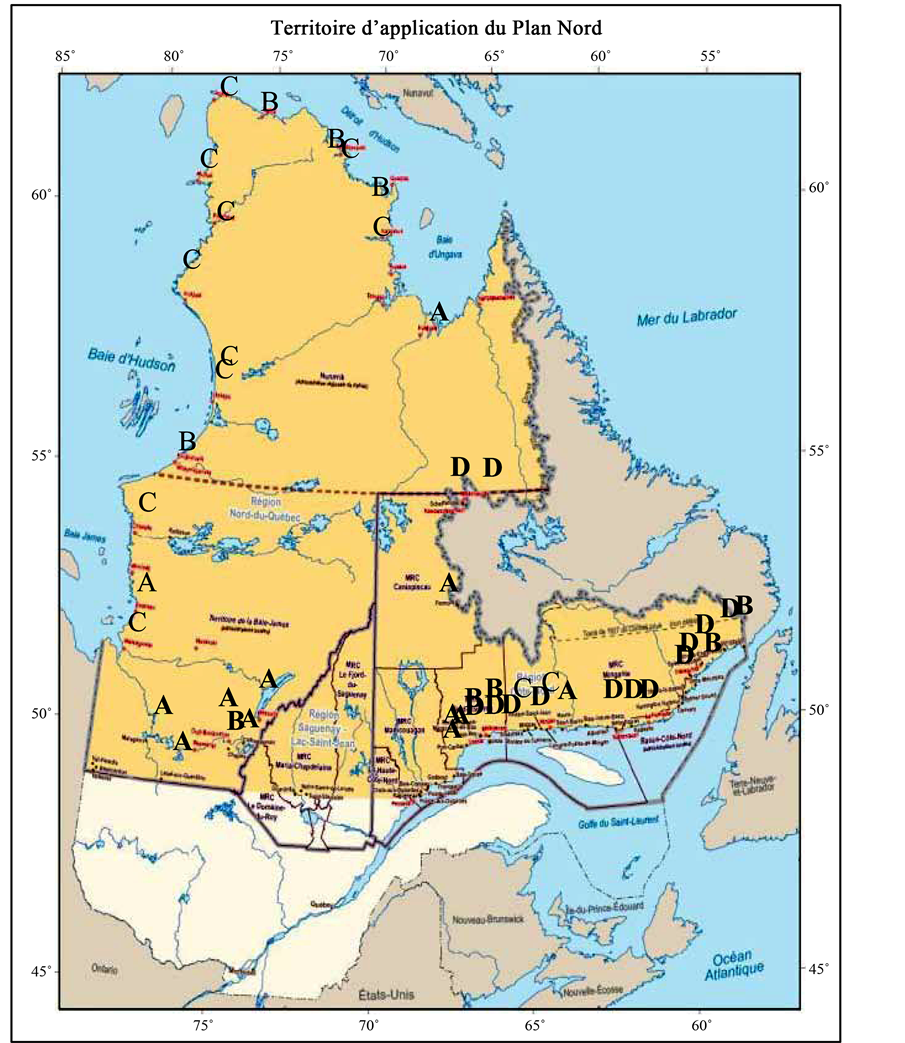
3.2. Geographical Analysis of the Overall Classification Decision Table
In the overall classification presented in the decision table above, 85% (11 of 13) of the municipalities of the Côte-Nord region were assigned to category D. Of the municipalities in the Jamnésie and Baie James region, 46% (6 out of 13) were assigned to category A. It is important to mention that the category A municipalities had ratings close to the average for the province of Quebec. Appendix A provides a map of this classification.
3.3. The Decision Rules
The calculations were performed using jMAF software, developed by the intelligent decision support systems laboratory (IDSS) at the computing science institute of the Poznan University of Technology.
Using jMAF, 28 decision rules were identified, presented in Table 4.
For example, the first four decision rules set the goals to be reached by all municipalities classified in categories B, C or D. Based on rules 1, 2 and 4, a municipality wishing to upgrade its classification to A must achieve A-level performance from at least two perspectives, while based on rule 3, this same municipality need only achieve an A-level performance from a single perspective. Rule 3 is respected in the cases of municipalities 2, 4, 5, 6, 7, 8, 11, 12, 13 in Table 3.
Rule 3: If a municipality is classified category C or better from the demographic perspective, category B or
Table 3. Classification of the 52 municipalities according to each of the six perspectives.
Continued
better from the employment perspective, and category A in terms of personal income, it shall receive a category A classification overall.
Rule 9: If a municipality is classified category A from the demographic perspective, category C or better from the micro-economic perspective, and at least category C in terms of employment, it shall receive at least a category B classification overall. This rule is applicable to six municipalities in our study, namely 4, 6, 9, 10, 19, 24 (Table 3). The research document attached to this summary report explains the rules for upgrading from category B to category A, from category C to category B, from category C to category A, and from category D to category C.
4. The Dominance-Based Rough Set Approach (DRSA) Applied to Establishing the Conditions to Be Met in Order to Improve Municipality Classification Using the Example of Employment
Application of the DRSA to determining the conditions that would allow improvement of the classification of a municipality using the example of employment is presented in the following section. The complete study, attached to this report, also covers the other perspectives (demographic, sociologic, micro-economic, income and occupational profile).
In Section 3.3.1, in which upgrading from category B to category A is discussed, we have identified two municipalities, namely Kangiqsujuaq and Salluit, which were both classified in category B. In order to be upgraded to category A, these municipalities should invest in job creation, which in our approach is measured using three indicators, namely employment rate, participation in the labour force, and unemployment rate.
In order to apply the rough set approach to the employment perspective, we must first construct a decision table for the evaluation of the 52 municipalities with respect to the three conditional criteria (participation rate, employment rate, unemployment rate) and with respect to the sole decisional criterion (see Table 5). The jMAF inductive reasoning software is then used to obtain the decision rules (see Table 6). The set of rules identified using jMAF provided correct classification of all of the 52 municipalities in our study.
Table 4. Decision rules for overall evaluation.
The municipality of Kangiqsujuaq was given a category B classification, since it met the criterion of rule 2, with an employment rate of at least 52.4 but below 59.2 (see rule 1, Table 6). The municipality of Salluit was given a category C classification, since it met the criterion of rule 5, with an employment rate of 46.8 (see Table 6), but below 52.4. These two municipalities should therefore give top priority to projects that will improve the employment rate, until this indicator reaches a value of at least 59.2 and thus meets the criterion of rule 1, which was the case for all of the municipalities that were given a category A classification. This threshold value is close to the employment rate of 60.4 for the province of Quebec.
With regard to upgrading overall classification from category C to category B, we identified in the previous section three municipalities that should give top priority to projects that upgrade their performance from the em
Table 5. Decisions based on the employment perspective.
Continued
Table 6. Decision rules based on the employment perspective.
ployment perspective at least to level C. This was the case for Uashat, to which rule 7 applied, with an employment rate below 37, as well as Kangiqsualujjuaq and Waskaganish, with employment rates of 45.7 or lower and a participation rate of 64.1 or lower, thus meeting the criteria of rule 8. These three municipalities should invest in projects that stand to improve the employment rate indicator to at least 46.8 for category C classification from the employment perspective.
For upgrading overall classification from category D to category C, we identified in the previous section the nine municipalities that need to give top priority to projects that upgrade their performance from the employment perspective to level B. They should invest in projects that stand to improve their employment rate to at least 52.4. Some of these municipalities could also upgrade to category C through improvement from the demographic perspective.
Examination of the conditions of improvement of municipality classifications from the various perspectives reveals that policy makers should give top priority to improving the rate of employment in occupations related to business, managerial roles, and sales. From the sociological perspective, projects designed to increase the rate of graduation among the active population should be preferred, as well as decreasing the number of elderly persons living alone. This policy converges with policies intended to reduce the population-aging index by improving population growth and succession indicators. From the micro-economic perspective, projects having a positive impact on indicators relating to the ownership and condition of housing should be favoured. Finally, from the personal income perspective, emphasis on raising median income as well as median family income needs to increase.
We note also that the majority of the municipalities that were classified in category A were below average for the province of Quebec in terms of the values of the indicators, regardless of the perspective. This demonstrates that Northern Quebec is in very real need of the financial aid proposed in the NPT in order to approach the provincial average.
5. Practical Application of DRSA to Municipal Development: Examples
In this section we demonstrate the practical application of the DRSA decision rules to the sustainable development of municipalities in Northern Quebec and their usefulness as a tool for prospective evaluation. For this purpose, we carried out two case studies, of municipalities selected randomly from the list of 52, namely Chapais and Franquelin. The results of the case study of the municipality of Chapais are presented below. The Franquelin case study is provided in the full research report attached to the present summary.
The Chapais Case Study
The municipality named Chapais was given an overall classification of category B (see Table 3). In order to upgrade this to category A, this municipality needs to address at least one of four decision rules. Our focus was on rule 3, since Chapais already meets two of the criteria associated with this rule. The criteria for category A are as follows: a demographic classification of category C or better, an employment classification of category B or better, and a personal income classification of category A. This municipality thus needs only to improve its employment classification to B or better in order to earn an overall classification of A.
In order to achieve this, the municipality could explore three possibilities (see Table 6). We shall focus on the first two of these, since they are particularly interesting in the present case.
The first possibility concerns the rule specifying an employment rate of at least 52.4% as a requirement for qualifying as category B. The current employment rate in Chapais is 50.7%. Since the labour force in this municipality consists of 1340 persons, 23 new jobs would be needed in order to raise the employment rate to 52.4%, that is, to 703 persons employed out of the 1340 available (see Appendix B).
The second possibility for category B classification with regard to employment would be to reduce the unemployment rate (currently 14.5%) to 5.7% or lower. The number of unemployed persons (persons participating in the labour market by actively seeking employment) is currently 115, while the total number of participants in the labour market in Chapais is 795. Reaching an unemployment rate of 5.7% (45/795) would mean creating jobs for 70 job seekers (see Appendix B).
It is thus clear that there is more than one possibility for upgrading the municipality of Chapais from its current overall B classification to category A. One of these would be to create at least 23 jobs and thus increase its employment rate to 52.4%, while the other would be to create at least 70 jobs and thereby reduce its unemployment rate to 5.7%. In either case, this involves addressing the job shortage problem.
6. Conclusions
The socio-economic status of the towns and villages in the portion of Northern Quebec included in the NPT plan is below average for the province of Quebec. As shown using the statistics chosen for the present study, those
Table 7. Possibilities for upgrading the overall classification of the municipality of Chapais from category B to category A.
“Grad. partic.” = graduated and participating in the labour force.
municipalities in the top-rated category are close to the provincial average. In other words, only 25% of the towns and villages in Northern Quebec enjoy socio-economic conditions comparable to the average for the province of Quebec, while the others are below average. The investments planned within the framework of the NPT will have without any doubt a positive impact on the socio-economic status of the population of Northern Quebec.
As shown in our analysis, we may conclude that the DRSA should help to provide decision makers with better understanding of the social and economic impact of different projects, as well as actual needs in each of the sub-regions of Northern Quebec.
In addition, with the aid of Statistics Canada census data for 2006 and 2011, we were able to group the NPT municipalities into four categories, A, B, C and D, based on various indicators of demographic, sociological, micro-economic, employment, personal income, and occupational status. We thus obtained a decision table that represents a model of preferences for the administrators of the NPT project.
6.1. The Potential of the DRSA
Using the DRSA, it is possible to identify precisely the most significant economic indicators for the purpose of making decisions regarding the development of Northern Quebec. We thus obtained a decision table that demonstrates the relationship between the various indicators studied. In addition, once new data have been compiled from future censuses, this tool will be of strategic value for the government, since it then will be possible to study trends, demographic changes and changes in municipality ratings, and to make predictions. Finally, DRSA could become a useful tool for measuring the effectiveness of efforts deployed within the framework of the NPT plan.
6.2. Future Research
The present research has revealed numerous avenues that may be examined in order to meet the challenge of the socio-economic development of the municipalities concerned. To pursue this line of research, we suggest listing the possibilities and creating a portfolio of possibilities for each municipality. The results of this exercise using the example of the municipality of Chapais are shown in Table 7. There are 68 possibilities for the upgrading of this municipality from an overall classification of category B to category A. These possibilities all stem from different combinations based on the decision rules described in this study. Once the portfolio is created, the next step is to focus on a criterion, evaluate the investment required in order to meet it for each of the possibilities in the portfolio, and choose the option that minimizes total investment costs. This method should allow identification and measurement of the optimal possibilities for a sub-region and perhaps for the studied territory as a whole. More precisely, it should allow the identification of the possibilities that should be given as a top priority, their costs and their likely socio-economic impact on this territory. This would allow the government to focus its projects more effectively, to predict their impact on the chosen indicators, and to administer more effectively the resources allotted to the projects and thus minimize investment costs.
We believe that the DRSA could be used on a larger scale for other regions of interest with similar socioeconomic characteristics. This tool has the potential to become an important decision aid for all levels of government.
References
- Pawlak, Z. (1982) Rough Set. International Journal of Parallel Programming, 11, 341-356.
- Pawlak, Z. (1991) Rough Sets: Theoretical Aspects of Reasoning about Data. Kluwer Academic Publishing, Dordrecht. http://dx.doi.org/10.1007/978-94-011-3534-4
- Pawlak, Z. and Slowinski, R. (1994) Rough Set Approach to Multi-Attribute Decision Analysis. European Journal Operational Research, 72, 443-459. http://dx.doi.org/10.1016/0377-2217(94)90415-4
- Pawlak, Z. (2002) Rough Set Theory and Its Applications. Journal of Telecommunications and Information Theory, 3, 7-10.
- Greco, S., Matarazzo, B. and Slowinski, R. (2001) Rough Sets Theory for Multi-Criteria Decision Analysis. European Journal of Operational Research, 129, 1-47. http://dx.doi.org/10.1016/S0377-2217(00)00167-3
- Zaras, K. (2004) Rough Approximation of a Preference Relation by a Multi-Attribute Stochastic Dominance for Deterministic, Stochastic and Fuzzy Evaluation Problems. European Journal of Operational Research, 159, 196-206. http://dx.doi.org/10.1016/S0377-2217(03)00391-6
- Zaras, K., Marin, J.-C. and Boudreau-Trudel, B. (2012) Dominance Rough Set Approach as a Decision-Making Method for the Selection of Sustainable Development Projects. American Journal of Operational Research, 2, 506.
- Gouvernement du Quebec, Ministere des Ressources naturelles et de la Faune (2011) Bibliotheque et Archives nationales du Quebec.
- Gouvernement du Quebec (2012) Le Plan Nord. http://www.plannord.gouv.qc.ca
- Gouvernement du Quebec (2012) Le Plan Nord. http://www.plannord.gouv.qc.ca/portrait/index.asp
- Statistiques Canada. Recensements 2006 et 2011.
Appendix A
References
Journal Menu >> |