Modern Economy
Vol.5 No.3(2014), Article ID:43893,13 pages DOI:10.4236/me.2014.53019
Price Transmission Analysis along the Food Chain in Kazakhstan
Yessengali Oskenbayev1,2, Gani Turabayev3
1Center for Development Research (ZEF), Bonn, Germany
2Horizon Research Center, Suleyman Demirel University, Almaty, Kazakhstan
3Department of Finance and Accounting, Kazakh National Pedagogical University Abai, Almaty, Kazakhstan
Email: oskenbay@gmail.com, gani@kaznpu.kz
Copyright © 2014 by authors and Scientific Research Publishing Inc.
This work is licensed under the Creative Commons Attribution International License (CC BY).
http://creativecommons.org/licenses/by/4.0/


Received 17 January 2014; revised 17 February 2014; accepted 24 February 2014
Abstract
Vertical price transmission between wheat and flour markets in Kazakhstan has been analyzed using monthly data during the period 2000-2010. We found evidence of global market price spikes and government policies as a response leading to the divergence of prices across regions of Kazakhstan, which is especially notable in the flour market. Strikingly, flour prices are significantly higher in some wheat producing regions.
Keywords
Price Transmission Analysis; Cointegration; Agricultural Policy; Kazakhstan

1. Introduction
Most empirical studies have shown that the nature of food price volatility has over recent decades (FAO [1] ). During the period 2007-2009, the food and financial crisis caused significant social problems and increased the global number of hungry people. The world price of grain, wheat, oilseeds and rice almost doubled between 2005 and 2007, and sky-rocketed again in 2008 and 2011. Evidently prices of oil and other energy products are a crucial factor in the increasing costs of agriculture products. Furthermore, a boost in the demand for biofuel products followed the oil products’ price increase, and will further raise prices for agriculture products (OECD [2] ). Recent FAPRI projection programs indicate that the price volatility will persist over the coming decade, not only for energy and main crops but also for all agriculture products (CRS Report for Congress [3] ).
Kazakhstan, along with Russia and Ukraine, accounted for 15% of global grain exports during the 2007-2009 period, and reached a record peak in wheat trade of 26% in 2008-2009 which left behind wheat exporting giants such as the US and EU (EBRD and FAO [4] ). These countries are thus becoming major exporters of grain worldwide. Like in other cases, one of these countries practiced banning grain exports to limit price volatility, particularly in the immediate aftermath of a fire accident in Russia last year. Although this could be a sound policy to mitigate price volatility, banning can lead to higher price volatility of agriculture goods as it lowers the profit margins of the farmers. Therefore such remedy policies typically cause uncertainty and represent a high risk in the long-run (William [5] ).
Many countries have employed administrative rather than economic tools to mitigate price fluctuations, and have responded through government interventions. Indeed, many countries adopted a wide range of government intervention policies to confront soaring food prices in the period 2007-2008 (FAO [1] ). The policy measures were characterized short-run, and varied across countries. Policy measures employed to mitigate price spikes included the reduction of import tariffs and quotas, import taxes on foods, export bans and restrictions, and domestic price administering (Gruininger and von Cramon [6] ).
Therefore, our study is structured as follows. In the following section, related literature of commodities price transmission along food chain is discussed. Subsequently, institutional arrangements in wheat sector and its consequences are considered to shed some light on impact of policies on wheat prices. Afterwards, panel econometrics model is applied to assess the prices transmission from wheat to flour market.
2. Literature Review
A broad range of literature exists regarding price transmission and market integration, and is mainly concerned with the level of impact transmitted from one market to another. In particular scientists studying vertical transmission have focused on the speed of adjustment, magnitudes and their nature (Vavra and Goodwin [7] ). This is due to the fact that researchers are eager to examine the influence of market agents’ behavior on price relationships which could be observed by asymmetric price transmission models. In their pioneering research on switching regression models, Baulch [8] suggested that using switching models such as the parity bounds model is more efficient in analyzing the comovements in different markets than conventional market integration models. In addition, McNew and Fackler [9] and Barret [10] argue that conventional cointegration methods of market integration are not informative and reliable. Thus, asymmetric price transmission must be interpreted as a law in economic theory (Peltzman [11] ).
Following arguments against linear cointegration methods, economists initiated much more reliable methods to account for asymmetric price comovements. Nonlinear methods such as the threshold cointegration model have been adapted in several studies. One of the studies (Goodwin and Piggot [12] ) used the threshold cointegration method to disclose the transaction costs’ impact on price transmission in spatially separate markets. In contrast with their study, Sephton [13] argued that the prices are not persistently spatially diverging, using multivariate threshold and nonlinear cointegration methods. Similarly, Meyer [14] applied a two-threshold model to test threshold significance in examining the of role transaction costs, as many previous studies have been criticized for ignoring this.
Subsequent studies (Gruininger and von Cramon-Taubadel [6] ) on price transmission have switched focus to its effect on policy decisions and welfare effects, and have also observed that regime switches depend on the increasing or decreasing nature of food prices.
3. Divergence of Flour Price across Regions in Kazakhstan
According to a FAO report [15] the Food Price Index rose 236 points in 2011, establishing a new record in nominal terms since 1990. According to statistics, this was due to price increases in wheat, rise and maize. Clearly, dramatic oil price fluctuations, and especially the increase in recent years, has worsened the situation.
Although FAO data indicates that June 2010 global food prices remained 22% below their June 2008 peak, national data shows that food prices in Ukraine, Russia, Turkey and Kazakhstan posted double-figure increases during this time. Recent developments, including scorching hot weather and drought in Russia and Kazakhstan, and too much rain in Ukraine (see the map below), are causing alarm for governments and observers in these countries. In the face of declining crop production, governments in Russia, Ukraine and Kazakhstan have undertaken similar steps to mitigate food price increases.
Dramatic increases in food prices have led to flour price divergence across regions, also the disintegration of the flour market in Kazakhstan. Figure 1 depicts flour and wheat price divergence, estimated as standard deviation of prices across regions (oblasts). It can be noted that the price divergence of flour (relative to wheat price
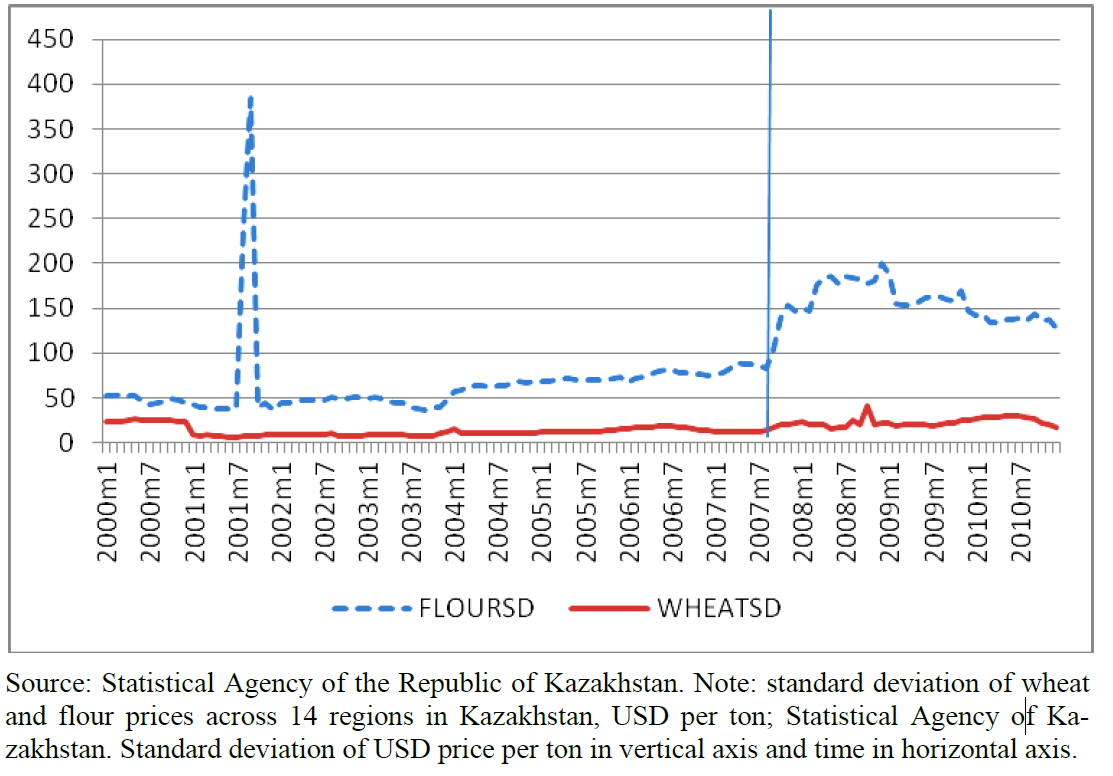
Figure 1. Wheat and flour price divergence across regions of Kazakhstan, 2000-2010.
divergence) has been sharply increasing since August 2007. Strikingly, flour prices reached a maximum level in the Akmola and Astana regions, while West Kazakhstan had the lowest level prices among all other regions. Akmola is one of three leading wheat producing regions in Kazakhstan, whereas the West Kazakhstan region, one of the largest oil producing oblasts, has one of the lowest indicators of agriculture production. The Almaty oblast is the same distance from the Eastern Kazakhstan regions as the West Kazakhstan oblast, is a leading wheat producing oblast and recorded significantly higher flour prices than other regions.
The dynamics and differences between domestic flour and wheat prices are depicted in Figure 2. It is observed from the Figure 1 that both wheat and flour prices started increasing sharply since August 2007. Interestingly, the price difference between flour and wheat prices (shown by the dashed line in Figure 1) started increasing concurrently. In August 2007 we observe a sharp increase in the difference between flour and wheat prices, reaching a maximum level in October 2008. Afterwards, there was an instant decrease in the difference until March 2009 and has been gradually falling since then.
For example, the grain price for 3rd class wheat (the highest class in Kazakhstan) increased from 200 to 350 USD per ton, representing an increase of 75% in 2007. It further increased to 410 USD per ton in March 2008, before declining in response to global price fluctuations (Robinson [16] ). Furthermore, it is discernible from Figure 2 that neither the export ban nor export licensing practice, aimed to shield domestic wheat and flour markets from global price fluctuations, succeeded. Indeed, in the period 2007-2008 domestic wheat prices increased by more than 100%, recording a peak in summer 2008 (D’Souza [17] ).
Two-sample t-tests with equal variances for wheat and flour prices across regions were applied to test the integration level of both markets (Tables 1-A and 2-A in the Appendix section). The test results indicate that the flour market is highly disintegrated, as prices significantly differ among regions in comparison to the wheat market. Furthermore, flour prices in Akmola region—one of the wheat planting regions of Kazakhstan—are significantly high than other neighboring wheat production leaders such as the North Kazakhstan and Kostanay oblasts. This pattern exists across all regions of Kazakhstan, even if those regions are close neighbors and are not advantaged in terms of transportation costs. Moreover, the flour market is less integrated than the wheat market, as prices significantly differ among regions. Why have flour and wheat prices not increased in parallel since 2007? Why is there a high divergence of prices across different regions in the flour market (in comparison with the wheat market)? What was the source of the rising price divergence across different regions in the flour market? Why have flour prices started to diverge dramatically since August 2007? Were government policies able to isolate the domestic market from the global price increase effect?
4. Government Response to Food Price Volatility
The policy reactions of European and Central Asian countries to the dramatic energy and food price increases in
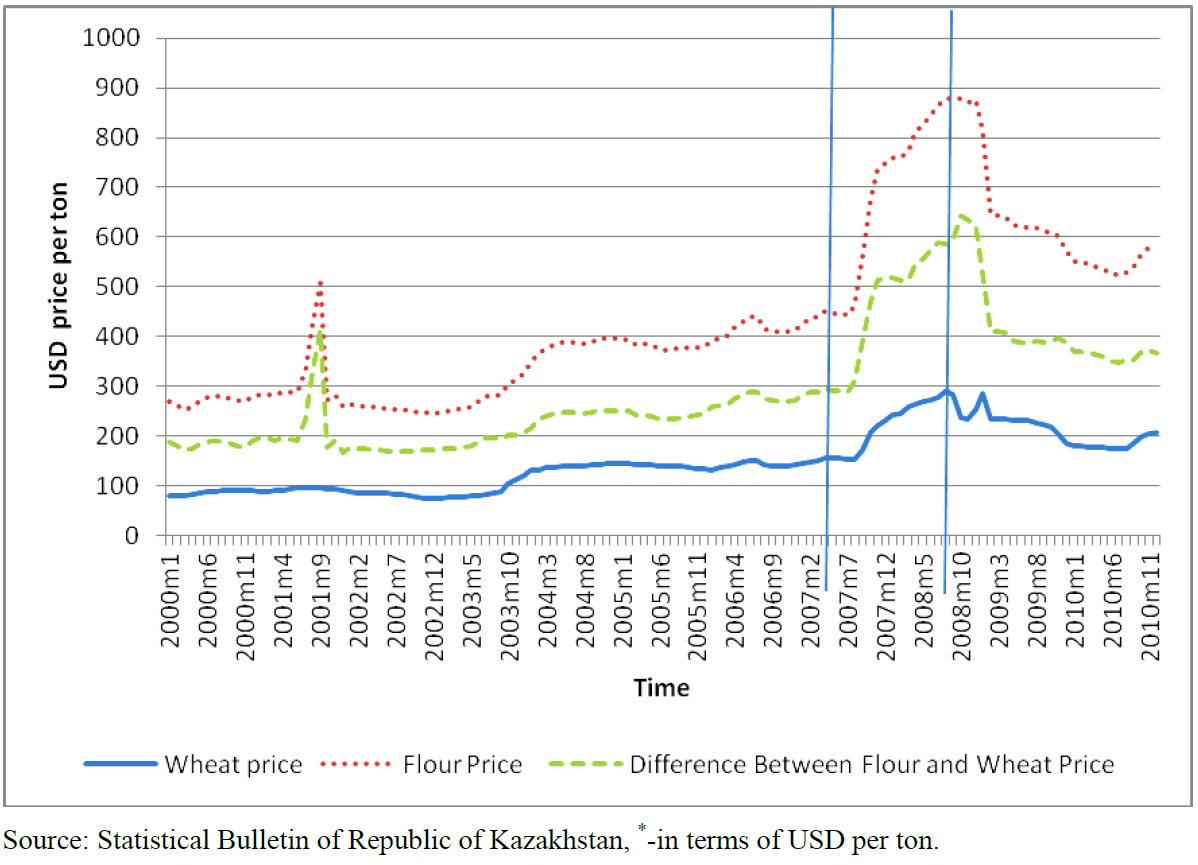
Figure 2. Domestic flour and wheat prices in Kazakhstan, 2000-2010*.
2007-2008 were varied. The majority of export-leading countries, including Argentina, India, Kazakhstan and Vietnam, had launched export restriction policies by mid-2008 (World Bank [18] ). However, these policies induce an adverse impact in the long run because they discourage producers and exporters. They could also be inefficient in the short-run, if case traders increase their margins and prices in domestic markets. The dominant policy measures during the 2007-2008 crises were as follows: food export restriction imposition by producing countries, VAT rate reductions for food imports, the employment of government intervention mechanisms to control prices (purchasing food and releasing food reserves), and the direct enforcement of price ceilings and sequential energy price adjustments. This set of policy measures have been exercised again in 2010-2011 (World Bank Report, [18] ).
However, they are not targeted to protect the poor from the combined negative effect of food oil price increases. Besides, VAT rate reduction dampens imported good prices and increases the budget deficit, whereas consumer prices usually remain unaffected. The subsidization of energy resources as an input subsidy is deviated by rent-seeking activities and only serves to increase the budget deficit. Export restrictions and price ceiling measures in the agriculture and energy sectors of the economy hinder the integration process with the global market. In Table 1 we present the main CIS net-exporting countries, Kazakhstan, Russia, and Ukraine, and the policy measures undertaken as a response to the food price increases in the 2007-2008 period.
According to Table 1, methods of response to the food price volatility in Kazakhstan often matched those undertaken in the Russian Federation. Trade restrictions, consumer subsidies, and increase supply strategies of response have been adopt by the governments of both Kazakhstan and Russia.
There is still a divergence among these countries in measures concerning trade liberalization policy, social protection and trade restriction. For instance, in contrast to Russia and Ukraine, Kazakhstan did not consider trade liberalization policy because of the different trade patterns they possess. Russia and Ukraine’s share of wheat exports to CIS countries accounts for only 10% (2007) and 2% (2009), while Kazakhstan exports 43% of wheat and wheat flour to CIS countries (2007) (FAO [19] ).
As a consequence of draught and fire in Russia and some regions of Kazakhstan, both countries introduced export bans from 2010 until the end of the 2011 harvest. In addition, the National Company of Food Contract Corporation proclaimed its decision to export wheat by commercial means to some partner countries (Homyak [20] ; USAID [21] ). On the other hand, export restrictions adversely influenced farmers’ income. The Single Commodity Transfer (SCT), a policy using fiscal tools such as taxes or subsidies, aimed to impact farmers’ and producers’ income. SCT exhibited negative values in 2007-2008, generating 28% and −24% respectively, revealing implicit taxation on wheat producers as a result of fixing domestic prices significantly below the international prices. In contrast to OECD countries which subsidized their producers at a rate of 34% - 55% percent,

Table 1. Government policy responses to food price volatility, 2007-2008.
Sources: Government responses: International Monetary Fund (IMF), World Bank (WB), Food and Agriculture Organization of the United Nations (FAO), and news reports, 2007-2008.
Russia, Ukraine and Kazakhstan taxed its producers at a rate of 16% - 20% (FAO [19] ).
The average annual inflation rate was 7.1% in 2010, exceeded 8% in 2011 following food price increases, and gradually increased as the country faced severe weather conditions. In order to control food prices, the government enacted laws concerning essential food item price ceilings (UN ESCAP [22] ).
5. Export Ban in Kazakhstan and Its Consequences: 15.04.2008-01.09.2008
The wheat export ban in Kazakhstan was introduced during the period from April 2008 to September 2008, as a response to inflationary pressure stemming from global skyrocketing prices for wheat and other agriculture products (Lillis [23] ). Several factors, such as drought, bio-fuels and increasing foodstuff demand have caused prices hikes. However, close wheat importing neighbors have suffered from the export ban, enduring price increases as a consequence.
Wheat exporters have also been hit badly. All existing contracts with partners abroad have been suspended, meaning that partners were exempted from liabilities on contracts. Naturally, such restrictions harm existing good relations with international partners. Exporters also had to sell their wheat, at a low government-set price rather than the high world price. For the purpose of comparison, wheat traders had realized respectable gains in 2008, with revenue in 2008 of $2.5 billion being 52% (or $0.8 billion) higher than in 2007 (Investkz [24] ).
Domestic and world wheat price co-movements are shown in Figure 3, in order to evaluate the impact of the export ban on wheat. It is observed that in the period of the export ban the difference between world and domestic wheat prices dramatically declined, largely due to the world price decrease. According to the data, the export ban did not succeed in reducing domestic wheat prices. Furthermore, the domestic wheat price gradually increased in the face of declining world wheat prices. It decreased in the two months immediately after the export ban abolition, yet continued increasing to almost reach the world price level until August 2009, when Kazakhstan recorded its highest harvesting since independence. The difference in prices reached its peak in March 2008, whereas in September 2009 it fell to the minimum level. Despite the fact that global wheat prices started declining in March 2008, domestic price kept gradually increasing.
Food prices rocketed in 2008, following by the global economic crisis provoking growing food security concerns worldwide. FAO statistics show that global food prices increased by 60% from January 2007 to June 2008, with further constant increases in subsequent years (Slay [25] ). Food prices increased more than 30% in Kazakhstan during an 18 month period in 2007-2008. On one hand, this price boost raised opportunities for grain and wheat producers, net exporting countries and wheat regions such as Kazakhstan. However on the other hand, the high prices implied an additional burden not only for the urban poor population, but also for net consumer households in provinces.
Since the abolition of the export ban the situation in the wheat market has reversed. As mentioned above, world wheat prices decreased sharply, due to sufficient wheat harvesting and production during that period. The direction of wheat exports from Kazakhstan has been altered to southern countries of Central Asia and the Caspian Region. In period from September 2008 to February 2009, 96% of wheat was exported to these countries, with Afghanistan being the leading wheat importing country in this trend (Investkz [24] ).
The government admitted that export ban policies caused serious problems. In an interview, Arman Evniyev, vice-minister of the Agriculture Ministry of Kazakhstan, reported that instead of export ban controls the government would simply “withdraw the needed stock of wheat from the market”. This practice is not applied annually, but from time-to-time depending on market conditions. Besides, since the period August 2008 to December 2011 the government has enacted export licensing laws to gain more control on the wheat market and internal prices, which will be discussed in the following section.
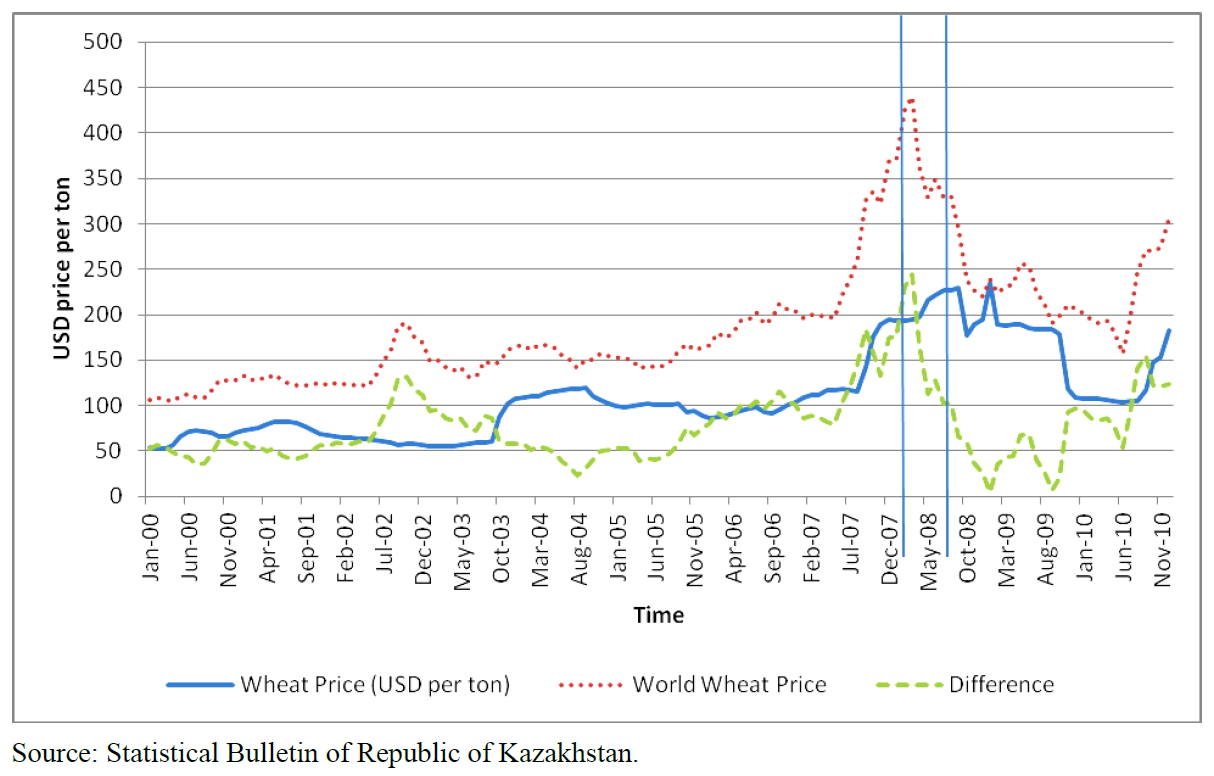
Figure 3. Wheat domestic price versus world wheat price development, USD per ton.
6. Export Licensing 08.2007-12.2011
In August 2007 Kazakhstan introduced a new law on grain export licensing, requiring farmers to submit all necessary documents and wait 10 days for the authority’s decision allowing them to export. Grain export licensing has since been cancelled in January 2012, under the constant demands of farmers and entrepreneurs (Zharmagambetova and Flake [26] ). The new law was introduced to control wheat and other grain prices that were constantly increasing in 2007, despite the good harvesting and optimistic forecasting of wheat production (APK Inform [27] ). The price increase and food security issues in Kazakhstan forced the adopting of urgent decisions.
However the export licensing impact has been reversed. Grain storage entrepreneurs and refineries in Kazakhstan could barely process wheat and other crops due to fact that the export licensing practice generated overwhelming stocks of wheat and other crops. In addition, as a result of export licensing practices with strict rules regarding storage and drying, milling and shipment of grain, 70% of grain buyers, small businesses and trading entrepreneurs abandoned the market (Agroacadem [28] ). The majority of these traders were exporting wheat in small amounts (approximately 50 - 100 thousand tons of grain) to neighboring regions of Russia.
This was worsened by the fact that most entrepreneurs heavily borrowed loans for harvesting campaigns, and the production of grain generated a huge loss as they were not able to sell their grain in the world market. Interestingly, the price level was relatively high when the export licensing was introduced and during the following period (Zakonkz [29] ). In order to preserve food security in the face of the 2007-2008 global food price increases, the price for bread was administratively fixed at a moderate level. For instance in the Kostanay region (oblast) —one of three major wheat producing regions of Kazakhstan—a standard loaf of bread was around 40 tenge, while its minimum cost of production, as households report, should be set at 47 tenge, taking into account that wheat prices reached 72 tenge/kg (Chernyshova [30] ).
On the other hand wheat prices continued rising as a result of global wheat and grain price increases. The licensing wheat exports policy enacted on 29th September 2007 further fueled the spike in domestic wheat prices, as farmers rushed to export their wheat to escape the licensing process burden. As stated by officials, the main purpose of export licensing is to introduce transparency in wheat exporting activities, such as the monitoring of tax collection. However in 2007 is was evident that exporters expecting the export ban on top of export licensing (identically to what happened in Russia earlier) decided to sell almost all of their wheat abroad. Official statistical data shows that 1 million tons of wheat was exported before mid-September 2007, which is twofold what had been exported a year earlier (Chernyshova [30] ).
The grain stock stabilization fund was formed in 2007 to mitigate domestic wheat price spikes. In some regards it played an important role in preventing the soaring price of bread. However, in other respects it failed owing to the absence of a transparent monitoring mechanism that guaranteed wheat prices would not be fully passed on to flour prices. Besides, there are plenty of other consumer goods that contain wheat as an input. For instance, the value added of wheat in pasta production accounts for 75% - 80%, bread—30%, eggs—60%, beef —20%, and chicken—60%, so the twofold increase of wheat prices transmitted proportionally to many consumer goods except bread (interview with Jumagali Bimenov, vice-president of “Zernovaya Industriya” company in 2007).
Officials clearly learned the lesson of what happened in Ukraine in 1998-2000, when it faced a deficit in domestic wheat supply whilst having good harvesting and was a net exporter, and decided to take appropriate policy measures (interview Sergiy Krysin). However, fearing the same expectation that export bans and licensing could take place, exporters attempted to sell their wheat pre-emptively, triggering wheat price levels before the policies came into effect. The majority of wheat was exported in the pursuit of greater revenue, causing a deficit in the domestic market and eventually pushing up the price of wheat in 2008 (Chernyshova [30] ).
7. Unauthorized Export Ban on Exports
The majority of wheat is exported in a north direction to world markets via Russian Railways. For some reason, the right to transport wheat and flour exclusively belongs to Russian Railways, including its subsidiaries such as “LP Trans” and “Rusagrotrans”. Russia enacted a grain export ban in 2010 as a consequence of extreme draught, while a wheat export ban was introduced during the period from 15th August 2010 to 31st December 2010 (BSSS News [31] ). Naturally this policy affected the domestic wheat and flour prices. Moreover, Russian officials could not establish an agreement with Kazakhstan for the introduction of a joint export ban, as Kazakh officials stated that there is plenty of wheat to supply both world and domestic markets. However Kazakh wheat exporters claim that Russian Railways artificially set an export ban on flour exported from Kazakhstan. Strikingly, oil, coal and wheat products were not subject to such unofficial export bans (Fortunova [32] ).
Two possible reasons could explain this unauthorized export ban. Firstly, railways companies preserve the interests of monopolies, or in some cases they belong to wheat and flour exporting monopolies. Secondly, Russia could put pressure on Kazakhstan in the face of increasing wheat and flour prices. Specialists strongly support the former reason as there were no cases of wheat export bans. Identical cases also occurred in the South direction as well (flour is a major exported product to Uzbekistan and other Central Asian countries). Experts claim that the export ban put into place by railways companies was unauthorized, and as a result tons of wheat were stuck in customs (Korneva [33] ).
8. Panel Cointegration Test
Prior to investigating the cointegration relationship between flour and wheat prices, we should confirm the integrational characteristics of the data series. To accomplish this task an IPS (Im, Pesaran and Shin [34] ) unit root test for panel data is executed. The statistical department data of wheat and flour prices in dollars per ton for 14 regions (oblasts) in Kazakhstan is used. As reported in Table 2, the main findings show that both wheat and flour prices are integrated of order one. It is observed that at levels, one is unable to reject the null hypothesis, while we can after the data series are differenced.
In the second stage, we examine cointegration tests to discover whether flour and wheat prices are integrated, namely whether they have a long-run relationship. The data series used in this research shows evidence of strong nonstationarity. Since we made sure that the data series are integrated of order one, cointegration tests could be examined. Two types of tests are utilized and presented in Table 3: the Pedroni [35] based residual test and the Westerlund [36] ECM panel cointegration test. The number of optimal lags for the model was chosen according to the Schwartz Bayesian Criterion. Panel cointegration tests results are reported in Table 3. The main findings suggest that the data series, flour and wheat prices are cointegrated.
The Panel VECM model for the data series and causality tests were performed as a following step and a causality test has been examined for the short-run and long-run relationship, as reported in Table 4. As a first step, the Panel VECM is estimated by employing system GMM estimator. The significance of causality tests are determined by F-statistics from the Panel VECM. The Wald test of causation examines the different sources of causation. We observe two-way causality in almost all cases, except for in the 2007-2010 period when wheat price is not good predictor of flour price. This is the implication of the flour price regime driven during the 2007-2010 period, as the export ban was set on flour rather than wheat.
9. The Pooled Mean Group (PMG) Method
In the dynamic panel regression, by contrast to cross-section, if the coefficients deviate from each other within
Table 2. Results of the IPS unit root tests for the full sample.
Note: Numbers in parentheses are lag levels determined by the Schwarz Bayesian Criterion. ***Indicates significance at the 1% level.
Table 3. Panel cointegration tests results.
Note: ***indicates significance at the 1% level. *Newey based automatic bad with selection and Bartlett Kernel.
Table 4. Wald F-statistics from Panel VECM estimation.
Note: p-values in paranthesis.
groups implying heterogeneity this causes the problem of inconsistency of estimates (Pesaran and Smith [37] ). Depending on the number of groups and length of time-span used in research, different methods are applied. For instance, in the case of large number of groups and short time span, cross-section estimates are consistent. On the contrary, when the time span is long fixed effects, instrumental variables and GMM pooled models provide consistent estimators unless slope coefficients are the same across groups (Pesaran and Smith [37] ).
In addition, an advantage of the PMG method is that it allows coefficients, error variances, and short-run dynamics to differ across groups, oblasts (regions of Kazakhstan) in this case (Pesaran, Shin, and Smith [38] ). The method assumes that variables are I (1) and have a long-run relationship, and thus it is recommended to examine unit root and cointegration tests (Im, Pesaran, and Shin [39] ). Having observed the existence of strong long-run relationship, coefficients were estimated using the PMG method for Regime 1: 01.2000-08.2007 period and Regime 2: 08.2007-12.2010 separately (Table 5).
Results of the PMG model show that adjustment coefficients are negative and strongly significant in both cases, which do not contradict the expectation. It implies price will decrease to restore to equilibrium. The adjustment coefficient is smaller in Regime 2, implying that it will take longer to adjust the equilibrium. However this difference is not significant as it takes 7 months to restore in Regime 2, and 6 months in Regime 1. However, if one pays close attention to the regions’ individual adjustment coefficients and their magnitudes, significant changes can be detected. For instance, in the case of Kostanay region (one of three largest oblasts in wheat pro
Table 5. The pooled mean group estimators.
Note: ***1% significance level, **5%, and *10%; t-statistics in parenthesis using heteroskedasticity consistent standard errors.
duction) the error correction term has fallen almost sixfold, meaning that it will take significantly longer to restore the equilibrium in Regime 2. Otherwise, in two other regions coefficients magnitudes have been increased. By contrast, in oil producing regions of the Aktobe, Atyrau, West Kazakhstan, Mangistau oblasts, the adjustment process takes longer under Regime 2, except the Atyrau oblast. Not only has the coefficient has fallen but also its significance has been disappeared in case of the Pavlodar oblast. Another interesting feature is the short-run dynamics across regions in wheat to flour price transmission, which has different patterns under different regimes.
As observed from the model results, in general under Regime 2 insignificant adjustment coefficients and low magnitudes dominate in most regions. Interestingly, some regions have suffered from this while others have benefited. In this regard the regime change impact does not exhibit a similar pattern for all regions, with the speculative character of the market representing the main source of this pattern. Wheat comprises a maximum onethird of production costs for bread, while a dominant portion of it belongs to further processing, fuel and trading costs. Thus, bread and flour prices could not perform spikes due only to grain price increases. In addition, grain and wheat prices declined in 2009 and 2010, while flour and bread prices remained at record levels set in 2008. Export bans and licensing practices failed and in fact reversed the effect on flour prices, as farmers decided to keep stocks and wait for better conditions. This increased prices even further as the supply decreased significantly. The price was also fueled as a result of the farmers’ expectations to export wheat in advance of the export ban and licensing coming into effect. With regards to the different patterns, it could be explained by the fact that regional officials were often obsessed with preserving regional food security by imposing undisclosed bans and regulations for flour, thus prompting flour price differences across regions and causing flour market disintegration.
10. Conclusions
Vertical price transmission between wheat and flour markets in Kazakhstan has been analyzed using monthly data during the period 2000-2010. Officials applied a wide variety of policies in response to global wheat price increases, often causing adverse and unintended effects on regional domestic wheat and flour prices. Overall, short-run policies aimed especially at mitigating wheat and flour prices were unsuccessful, causing greater instability and uncertainty in domestic market.
We found evidence of global market price spikes and government policies as a response leading to the divergence of prices across regions of Kazakhstan, which is especially notable in the flour market. Strikingly, flour prices are significantly higher in some wheat-producing regions. Regional administrative units were often obsessed with preserving regional food security, imposing undisclosed bans and regulations for flour, thus soaring flour price differences across regions caused flour market disintegration.
The results confirm that price transmission between wheat and flour switched over the period. The PMG model and Granger causality test were applied to examine vertical price transmission between wheat and flour. The PMG model was performed separately with the two regimes, and indicated that price transmission significantly altered under regime changes. Although overall coefficient differences in the two regimes are modest, the results across regions have different patterns in depicting huge differences in coefficients and magnitude. Moreover, the Granger causality test implies that the global wheat price is a good determinant of price differences across oblasts (regions).
References
- FAO (2008) Food Outlook. Global Market Analysis. FAO, Rome.
- OECD (2008) Rising Agricultural Prices: Causes, Consequences and Responses. Policy Brief, OECD Observer, Paris.
- Schnepf, R. (2008) High Agricultural Commodity Prices: What Are the Issues. CRS Report for Congress.
- EBRD and FAO (2009) Grain Markets in Kazakhstan, the Russian Federation and Ukraine. Report on World Grain Forum by Dmitri Prihodko.
- William, M.H. (2011) Price Outlook and Volatility in Global Grain Markets: Policies and Other Factors. Astana Economic Forum, Astana.
- Gruininger, M. and von Cramon-Taubadel, S. (2008) Competitive Agriculture or State Control—Ukraine’s Response to the Global Crisis. World Bank Document.
- Vavra, P. and Goodwin, B.K. (2005) Analysis of Price Transmission along the Food Chain. OECD Food, Agriculture and Fisheries Working Papers, No. 3, OECD Publishing, Paris.
- Baulch, B. (1997) Transfer Costs, Spatial Arbitrage and Testing for Food Market Integration. American Journal of Agriculture Economics, 84, 292-307.
- McNew, K. and Fackler, P.L. (1997) Testing Market Equilibrium: Is Cointegration Informative? Journal of Agriculture and Resource Economics, 22, 191-207.
- Barret, C. (2001) Measuring Integration and Efficiency in International Agriculture Markets. Review of Agriculture Economics, 23, 19-32. http://dx.doi.org/10.1111/1058-7195.00043
- Peltzman, S. (2000) Prices Rise Faster than They Fall. Journal of Political Economy, 108, 466-502. http://dx.doi.org/10.1086/262126
- Goodwin, B.K. and Piggot, N.E. (2001) Spatial Market Integration in the Presence of the Threshold Effects. American Journal of Agriculture Economics, 83, 302-317. http://dx.doi.org/10.1111/0002-9092.00157
- Sephton, P.S. (2003) Spatial Market Arbitrage and Threshold Cointegration. American Journal of Agriculture Economics, 85, 1041-1046. http://dx.doi.org/10.1111/1467-8276.00506
- Meyer, J. (2004) Measuring Market Integration in the Presence of Transaction Costs—Threshold Vector Error Correction Approach. Agriculture Economics, 31, 327-334.
- FAO (2011) Agricultural Commodities Trade and Export Policy in Kazakhstan. FAO Regional Policy Consultation on High Food Prices, Istanbul, 20-22 June 2011.
- Robinson, I. (2008) Food Markets and Food Insecurity in Tajikistan, Uzbekistan, Kyrgyzstan and Kazakhstan, WFP Regional Market Survey for Central Asia Regions. http://www.untj.org/docs/country_context/Reports/WFP_regional_market_survey-Central_Asian_Region.pdf
- D’Souza, A. (2011) Rising Food Prices and Declining Food Security: Evidence from Afghanistan. ERR-121, USDA, Economic Research Service. www.ers.usda.gov/ publications/err121/
- World Bank (2008) Double Jeopardy: Responding to High Food and Fuel Prices. World Bank, Washington DC.
- FAO (2008) Soaring Food Prices: Facts, Perspectives, Impacts and Actions Required. High-Level Conference on World Food Security: The Challenges of Climate Change and Bioenergy, Rome, 3-5 June 2008.
- Homyak, L. (2011) Kazakhstan: Kto Zarabotal na Letnih Prodazhah Zerna Prodcorporatsiey. KazakhZerno.kz, 36, 1.
- USAID (2010) Concerns Are Alleviated as Kazakhstan Announces Willingness to Export Wheat Flour to Afghanistan. Food Security Outlook, Afghanistan.
- UN ESCAP (2011) Kazakhstan: Global Launch, Country Breifing Note. http://www.unescap.org/survey2011/notes/kazakhstan.asp
- Lillis, J. (2008) Kazakhstan: Grain Export Ban Stokes Inflation Fears Elsewhere in Central Asia. http://www.eurasianet.org/departments/insight/articles/eav041608.shtml
- Investkz (2009) Eksport Zerna. Lutsche menshe, da lutsche! Kazakhstan’s International. Business Magazine, No. 1.
- Slay, B. (2010) Food Prices and Food Security: Gathering Storm, or Tempest in a Teapot. http://europeandcis.undp.org/uploads/public1/files/vulnerability/Senior%20Economist%20Web%20site/Publications/Food_security_20_08_10.pdf
- Zharmagambetova, Z. and Flake, L. (2012) Large Wheat Stocks to Continue to Support Kazakh Exports. USDA Foreign Agriculture Service Report.
- APK Inform (2007) Kazakhstan Introduced Grains Export Licensing. http://www.apk-inform.com/en/news/49202#.T64bnYEQbcs
- Agroacadem News (2012) Letsenziy na eksport zerna otmeneny. http://www.agroacadem.ru/?p=1932
- Zakonkz (2009) Pravitelstvo RK planiruet likvidirovat litsenzirovanie zerna. http://www.zakon.kz/152873-pravitelstvo-kazakhstana-planiruet.html
- Chernyshova, I. (2010) Kazahstanskoe Zerno Teryaet Svoih Postoyannih Klientov. KazakhZernokz, 41. http://kazakh-zerno.kz/index.php?option=com_content&view=article&id=27229:2010-11-26-06-05-26&catid=45:2009-12-26-04-23-03
- BSSS News (2010) Zakritie eksporta zerna prichernomorskimi stranami. http://www.bsss-group.com.ua/about/news/91/
- Fortunova, L. (2010) Rossia samovolna zapretila eksport zerna iz Kazahstana. http://www.kazakh-zerno.kz/index.php?option=com_content&task=view&id=21623
- Korneva, O. (2010) Kazahstan Temir Zholy obyavoli zapret na eksport zerna v Tajikistan. http://www.kazakh-zerno.kz/index.php?option=com_content&view=article&id=22874:-l-r-&catid=45:2009-12-26-04-23-03
- Im, K.S., Pesaran, M.H. and Shin, Y. (2003) Testing for Unit Roots in Heterogeneous Panels. Journal of Econometrics, 115, 53-74. http://dx.doi.org/10.1016/S0304-4076(03)00092-7
- Pedroni, P. (1999) Critical Values for Cointegration Tests in Heterogeneous Panels with Multiple Regressors. Oxford Bulletin of Economics & Statistics, 61, 653-670. http://dx.doi.org/10.1111/1468-0084.61.s1.14
- Westerlund, J. (2007) Testing for Error Correction in Panel Data. Oxford Bulletin of Economics and Statistics, 69, 709-748. http://dx.doi.org/10.1111/j.1468-0084.2007.00477.x
- Pesaran, M.H. and Smith, R. (1995) Estimating Long-Run Relationships from Dynamic Heterogeneous Panels. Journal of Econometrics, 68, 79-113. http://dx.doi.org/10.1016/0304-4076(94)01644-F
- Pesaran, M.H., Smith, Y. and Smith, R. (1999) Pooled Mean Group Estimation of Dynamic Heterogenous Panels. Journal of American Statistical Association, 94, 621-634. http://dx.doi.org/10.1080/01621459.1999.10474156
- Im, K.S., Pesaran, M.H. and Shin, Y. (1997) Testing for Unit Roots in Heterogeneous Panels. Department of Applied Economics, University of Cambridge, Cambridge.
Appendix
Table 1-A. Two-sample t test with equal variance for wheat market in Kazakhstan (first variable in the column, second variable in row).
Two-sided unpaired t-test for two samples (t-statistics in parenthesis). ***implies1%, **5%, *10% significance.
Table 2-A. Two-sample t test with equal variances for Flour Market in Kazakhstan (first variable in the column, second variable in row).
Continued
Two-sided unpaired t-test for two samples (t-statistics in parenthesis). ***implies 1%, **5%, *10% significance.