Journal of Biophysical Chemistry
Vol. 3 No. 4 (2012) , Article ID: 25026 , 9 pages DOI:10.4236/jbpc.2012.34032
Impact of petroleum refining activities on nitrate and nitrite content of edible vegetables and on their in vivo kinetics in albino rats
![]()
1Bioscience Center, International Institute of Tropical Agriculture, Ibadan, Nigeria; *Corresponding Author: akachigerry@gmail.com
2Department of Biochemistry, Michael Okpara University of Agriculture, Umudike, Nigeria
Received 25 May 2012; revised 20 September 2012; accepted 22 October 2012
Keywords: Pollution; Nitrate; Nitrite; Albino Rats; Edible Vegetables
ABSTRACT
The influence of pollution from petroleum refining activities on the levels of nitrates and nitrites in five edible vegetable species was investigated. Besides, the kinetics of nitrite and nitrate was studied in vivo using albino rats with focus on the possible influence of concentration difference on kinetics and implications to toxicity. Leaf samples of the five vegetable species were collected randomly from various locations within Eleme, a host community of Port Harcourt Refinery Company and the Indorama Petrochemical Company. Also, samples were collected from Umuahia, which served as pollution-free control. The leaf samples were analyzed for their nitrite and nitrate contents. Nitrite was determined spectrophotometrically while nitrate was determined after cadmium column reduction. Results showed that samples from Eleme had higher mean nitrate (349.20 mg/100g dry leaf mass; P < 0.05) and nitrite (63.12 mg/100g dry leaf mass; P > 0.05) as compared to the same samples from Umuahia. Solutions of nitrate and nitrite, equivalent in concentration to mean nitrate and nitrite content of the vegetable samples from the two locations were administered enterally to four groups of albino rats. Analysis of their blood levels were monitored five times at 30 minutes intervals following administration. Rates of change of blood nitrites and nitrates were found to be fairly constant in absorption as well as in the elimination phase. Their peak blood concentrations varied proportionately with their concentrations in administered solutions. However, peak blood nitrate was attained later in group of animals receiving higher amount of nitrate solution. Refining activities may pre-dispose people living within Eleme community to health hazards through contamination of edible vegetables.
1. INTRODUCTION
Nitrates and nitrites are abundant in the environment, both in biological and non-biological systems. Its occurrence may be due to natural or human activity related sources [1]. Natural occurrence of nitrates and nitrites is a consequence of the nitrogen cycle, in which atmospheric nitrogen and ammonium from organic matter are converted to nitrites and nitrates through the nitrification process. Nitrifying bacteria such as the free-living azotobacter contain enzymes which catalyze the oxidation of ammonia to soil nitrite and nitrate, which are taken up by plants predominantly as nitrates [2].
The use of commercial nitrogenous fertilizers and incorporation of wastes derived from animal husbandry or other sources into the soil may increase levels of nitrates and nitrites in surrounding soil and water resources. It has been observed that nitrate content of vegetables tended to increase with the increasing rate of nitrogen fertilizer application to the soil in which it is grown [3]. Only 10% of animal waste nitrogen is usually incorporated to the soil [4]. The rest poses a considerable environmental pollution threat. Another major human activeity-related source of nitrate and nitrite is industrial source. Industrial activities resulting in the emission of gaseous pollutants from the combustion of fossil fuel release considerable amount of nitrous oxides into the atmosphere [5]. Petroleum drilling and refining are the major Industrial activities in Nigeria. Both activities release huge amounts of poisonous gas mixtures. Recent report indicate that Nigeria flares 16% of total associated gas, the highest by any one country in the world [6]. Gas flaring in Nigeria is majorly attributed to the activities of oil extractive industries [6] and there is lot of data to that effect. However, there is a dearth of information on gas flaring resulting from petroleum refining. This fact notwithstanding, gas flaring from refineries is a dangerous reality to surrounding communities. The Port Harcourt Refinery company (PHRC) has been in operation for about forty five years now producing up to 210,000 barrels per stream day up from about 60,000bpsd production when it commenced operations [7]. Consistent daily production in such magnitude over the period of existence of the company is expected to have serious environmental implications for the host community. Nitrous oxide, an oxide of nitrogen is among the greenhouse gases released in gas flares from oil refineries [5] and results in increased soil acidity probably following acid rain in areas affected by flaring [8]. Significant amount of nitrogen is therefore added to the soil as nitrous and nitric acids in this manner. Elevated sub-soil nitrate would imply its increased uptake by and accumulation in plants.
Vegetables are major sources of nitrates in human nutrition [9]. Nitrate metabolism in the human body begins in the oral cavity. According to the Human Health Fact sheet [10], five percent of the nitrate taken in by healthy adults is reduced to nitrites by bacteria in saliva. Further nitrate conversion occurs in the alimentary canal. A number of studies have reported biotransformation of nitrate to nitrites by the nitrate reductase activity of the micro flora in the proximal intestine [11]. This biotransformation can be increased by certain conditions in the stomach specifically when the PH of the gastric juice is high enough to favor the growth of nitrate-reducing bacteria [10]. This process is of major concern particularly for infants whose gastrointestinal system is normally of higher PH than that of adults. In the presence of amines and thiocyanate catalysts, nitrites can be converted to the carcinogenic N-nitrosamines pre-absorption [12]. Ingested nitrate and nitrite is readily absorbed from the proximal small intestine [13] and rapidly equilibrates with body fluids. Circulating nitrate is actively secreted into saliva in humans [14,15] and into gastric and intestinal fluids in rats [16] in a dose-dependent manner [17]. Nitrates are mainly excreted in body fluids, urine, and sweat and in feces via biliary secretion.
Distribution of nitrates into plasma, erythrocytes saliva and urine has been demonstrated by [18]. In erythrocytes, nitrites oxidize the normal Fe2+ of hemoglobin to Fe3+ forming methaemoglobin. Fe3+ cannot transport oxygen, therefore resulting in poor oxygen supply to tissues. Cyanosis results from this [19,20]. Due to the poor oxygen supply to tissues, body cells release lesser energy from fuel molecules ultimately leading to symptoms which include shortness of breath, headache, fatique, and exercise-intolerance. Methemoglobin formation is not of major concern in normal adults because of the presence of a protective enzyme, NADH-methemoglobin reducetase which reduces the Fe3+ of methemoglobin into the normal Fe2+ of hemoglobin. However, ingestion of large dose of nitrate could over-stretch the enzyme and increase the blood level of met-Hb. Infants have poorly developed NADH-methemoglobin reductase and are therefore susceptible to methemoglobinemia commonly called Blue Baby Syndrome [21].
Human activity significantly contributes to the elevated environmental levels of nitrates and nitrites which can accumulate in crop plants [22]. This study examines the influence of petroleum refining and other downstream petroleum activities on the levels of nitrate and nitrate in vegetables cultivated and consumed by the people of Eleme, a host community of the Port Harcourt Refinery Company and the Indorama Petrochemical Company. In addition, it also investigates the kinetic properties of these compounds of nitrogen and the implication of these properties on toxicity.
2. MATERIALS AND METHODOLOGY
Nitrate and nitrate levels were assessed in five species of edible vegetables while the pharmacokinetic properties of nitrate and nitrite were studied using eight fiveweek old Albino rats.
2.1. Sample Collection of the Vegetable Species
Five vegetable species commonly consumed in the southeast and south-south regions of Nigeria were each randomly sampled from two different geographical locations. These locations are Alese (approximately 4˚47'N 7˚06'E) and the Port Harcourt Refinery road (between 4˚46'N 7˚06'E and 4˚45'N 7˚05'E) in Eleme Area of Port Harcourt for the South-south region (Figure 1) and Umuahia main town (approximately 5˚31'N 7˚29'E) for the South-East region.
The vegetable species were Amaranthus sp., Vernolia amygdalina, Telferia occidentalis, Piper guinensis and Gangronema latifolium. One set of these were sampled randomly from settlements approximately within fivekilometer radius of the Port Harcourt refinery and petrochemical company in the south-south. Another set of the vegetables were sampled from adjoining communities and suburbs of Umuahia in the south-east. For both locations, samples were taken only from fields not applied with fertilizers. Both sampling were done within the same season at an interval of two days.
2.2. Animal Rearing
A total of eight five-week old albino rats were bred together in standard rat litter cage for seven weeks. within

Figure 1. Screenshot of map showing areas where test samples were obtained as well as the surrounding refinery and petrochemical companies.
this period, the animals were fed with growers feed mash. The animals were then grouped according to their weights one week prior to administration of nitrate and nitrite solutions equivalent in concentration to the nitrate and nitrite content of the vegetables from any of both locations.
2.3. Kinetic study in the Experimental Animals
The albino rats were divided into four groups, two animals per group. Nitrate and nitrite solutions were administered to the groups as follows:
Group one: were administered with nitrate solution equivalent in concentration to the average nitrate concentration of samples from suburbs of Umuahia.
Group two: were administered with nitrate solution equivalent in concentration to the average nitrate concentration of samples from Eleme.
Group three: were administered with nitrite solution equivalent in concentration to the average nitrite concentration of samples from Eleme.
Group four: were administered with nitrite solution equivalent in concentration to the average nitrite concentration of samples from suburbs of Umuahia.
1ml solution of the appropriate nitrate and nitrite concentration equivalent was administered to each group of the albino rats enterally. Whole blood was withdrawn from the distal end of the tail at the following post-administration times: 10 minutes, 40 minutes, 70 minutes and 100 minutes. The blood samples were collected into 2ml of saline in vials. Blood was allowed to clot at 4˚C and subsequently centrifuged. Serum was collected and analyzed for nitrite.
2.4. Nitrate and Nitrite Determination
Nitrite was determined using spectrophotometry according to the method described by Follett and Ratcliff [23]. Nitrate was determined after reduction to nitrite in a cadmium column [23].
2.5. Statistical Analysis
The mean nitrate and nitrite content of vegetables from Eleme and Umuahia environs were compared statistically using the paired t-test.
3. RESULTS
3.1. Nitrite and Nitrate Contents of the Vegetables
Nitrite and nitrate levels in vegetable samples from two geographical locations with differential industrial pollution levels were determined. Nitrate and nitrite levels were consistently higher in all vegetable samples from Eleme except for Vernolia amydalina (Table 1). Average nitrate and nitrite content of Eleme-vegetables stands at 349.2 ± 326.9 mg/100 g and 121.98 ± 106.1 mg/100 g dry weight, while the average nitrate and nitrite content of vegetables from Umuahia environs are 63.1 ± 38.6 mg/100 mg and 15.84 ± 6.8 mg/100 g respectively (Table 2, Figure 2).
Statistical comparison of nitrate content of the five vegetable species from both locations by t-test shows that nitrate content was significantly higher in samples collected from Eleme (P < 0.05). There was however no statistically significant difference in nitrite levels of vegetables from both areas (P > 0.05).
3.2. Nitrate and Nitrite Kinetics in Albino Rats
The kinetic parameters of nitrites and nitrates were assessed following their administration enterally to each experimental group of albino rats, in concentrations equivalent to observed levels in the vegetable samples tested. Blood levels of nitrates were analyzed in groups one and two while nitrite level was analyzed in groups three and four. Both analytes were measured every 30 minutes at 10, 40, 70 and 100 minutes post-administration times in all the groups (Tables 3 and 4) The loge values of concentration values recorded at each of these times in each group of animals were plotted (Figures 3 and 4). Each of the graphs shows that blood nitrate and nitrite levels increased up to a peak value following administration, and started to drop beyond this value. This created two phases in the kinetics of nitrates and nitrites in the rats. These are the phases before and after the attainment of peak value which can be referred to as the absorption and elimination phases respectively. Peak concentrations varied proportionately across groups with administered quantities of nitrate and nitrite (Table 5). Animal groups which received higher nitrate and nitrite quantities had higher peak values of these analytes in their blood.
4. DISCUSSION AND CONCLUSION
Nitrate and nitrite levels varied in the two sets of vegetable samples collected from Eleme and Umuahia. While there was significantly higher mean nitrate in samples from Eleme, mean nitrite amounts were not significantly different statistically, as compared to samples from Umuahia. The significantly higher levels of nitrate in the vegetable samples collected from Eleme implies that the mean concentration of nitrate in all populations of the five vegetable species from this area is consistently higher than that for all populations of the same vegetable species within the suburban areas of Umuahia. Conversely, the non-significant difference in the levels of nitrite of both sample sets suggests that the mean nitrite concentration of all populations of the five vegetable species from the two locations does not differ significantly.
So many factors can influence the levels of nitrate and nitrites in vegetables but the most significant of these arises from two human activities such as agriculture and green house gas emission [8,24]. Agricultural activities add huge amounts of nitrates and nitrites to the soil from organic and inorganic fertilizer application [3] and this has been observed to increase the nitrate content of soils [2]. Green-house gases include oxides of nitrogen released into the atmosphere from industrial combustion of fossil fuels [5]. Heavy industrial activities such as petroleum refining involve large scale combustion of crude oil releases gases including nitrogen oxides (NO and NO2) that can undergo complex reactions with water vapor to form nitrates which later are deposited into the soil through acid rain and made available for absorption by plants [8].
Fertilizer application, a major manmade source of soil nitrate and nitrite was controlled in this study by the use of samples grown without fertilizer. The minor factors which could influence soil nitrate levels such as vehicular emissions, sampling time, leaf shading and cultivation method [25] are not expected to vary significantly between both locations and were therefore considered insignificant. For instance, sampling was carried out in the same season and the method cultivation of the vegetable species is not different in both locations. The significantly higher nitrate content of vegetables from Eleme may therefore be the result of the high emission of green house gases which includes oxides of nitrogen, from petroleum refining. This is consistent with the observation of a significantly higher soil nitrate in an area where gas is flared as compared to a different environment free from flaring [8]. Acidity of rain water has been reported in two gas flaring cities in Nigeria [26]. Oxides of nitrogen released in gas flares [5] could be a component of the mixture of anthropogenic gases often dissolved in the acidic rains of oil producing cities including Port Harcourt [8,16]. In this condition, substantial amounts of nitrate would be added to the soil and would accumulate in plants at concentrations comparatively higher than would be expected in the absence of acid rain. This is reflected in the comparatively higher mean concentration of nitrate observed in five vegetable species grown in the

Table 1. Nitrate and nitrite levels in five edible vegetable species.

Table 2. Mean nitrate and nitrite levels of vegetable sample sets from Eleme and Umuahia environs.
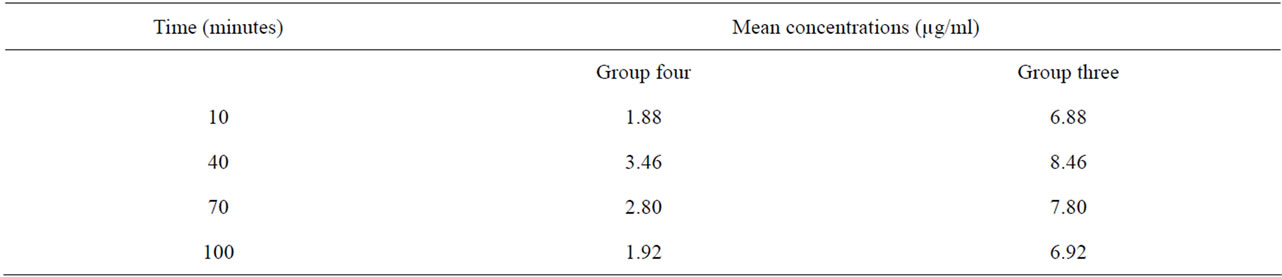
Table 3. Time-course change in mean blood concentration of nitrite in groups three and four.

Figure 2. Shows mean sample concentrations (mg/100 g) of nitrate and nitrite in five vegetable samples from Eleme and Umuahia environs.
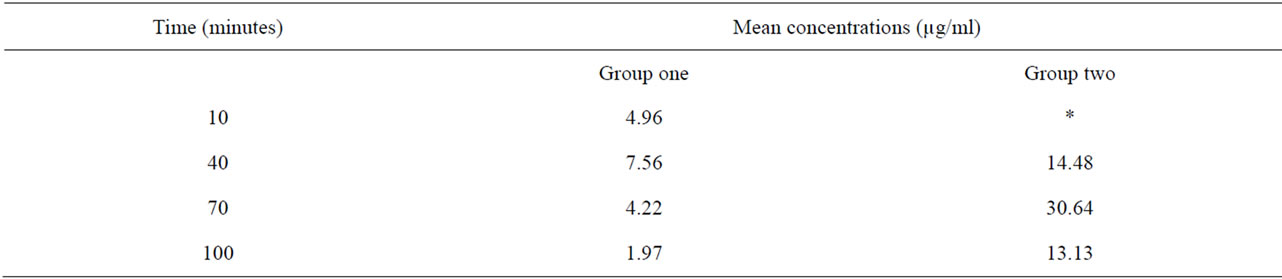
Table 4. Time-course change in mean blood concentration of nitrate in groups one and two.

Table 5. Mean peak blood concentrations (µg/ml) of nitrate and nitrite in groups one to four and the amounts of nitrate and nitrite solutions administered to each group.
host community of PHRC and the Indorama Petrochemical Company as against those grown in the suburbs of Umuahia where there is no gas flaring (Table 2 and Figure 2). This observation is consistent with the report of higher soil nitrate content in a Niger-Delta community affected by petroleum-related gas flaring compared with the soil nitrate content of another community which is free from gas flaring [8].
The insignificant difference between the mean nitrite levels of vegetable populations of both locations suggests that nitrite content of vegetables may not be dependent on the environment. Nitrite content of soils is known to be smaller compared to nitrate amounts because nitrates are more stable forms of environmental nitrogen [1]. This implies that the vegetables absorb predominantly nitrates from the soil. Much of the nitrite content of the analyzed samples could be attributed to the nitrate reductase activity of the nitrate assimilation pathway in plants. The nitrite content of samples may therefore not be dependent on the levels of environmental pollution but on the average level of activity of this enzyme in the two sample sets. The major concern for toxicity is therefore associated with level of nitrate consumed in these vegetables since nitrates are readily reduced to nitrites which can form the carcinogenic N-nitrosamines in the presence of amines and thiocyanate, in the gut as well as pre-dispose to methemoglobinemia [12,27]. The mean nitrate content of samples from the pollution-prone Eleme environs is higher than the upper permissible limit for vegetables in China [28] as well as the average for fresh spinach in Europe [29]. According to the Joint Expert Committee on Food and Agriculture (JECFA) and the European Commission’s Scientific Committee on Food (SCF), the upper limit of acceptable daily intake for nitrate is 3.7 mgkg-1 body weight [30-32]. Based on this, an averagely weighing adult of 60 kg should conume not more than 63.6 g per day, of the vegetable species produced in Eleme. Of particular note is the high variability in nitrate and nitrite levels of the five vegetable species within each of the locations which is shown by the high standard deviations from the sample means (Tables 1 and 2). This could reflect their differential capacity to accumulate nitrate which could be genetic [33]. The observed higher nitrite and nitrate concentraons of Amaranthus species are consistent with the classication of the vegetable among the high nitrate vegetables [24].
The time-dependent blood concentrations of nitrates and nitrites at the post-administration times revealed concentration increase to a peak value followed by a deeasing phase (Tables 3 and 4 Figures 2 and 3). The ineasing phase represents the absorption phase while the decreasing phase would represent the elimination phase.
In the absorption phase, blood levels of nitrate and nitrite increased at fairly constant rates up to a peak value, within each group. In the elimination phase, blood levels of nitrate and nitrite decreased at fairly constant rates from a peak value, within each group. These peak concentrations varied proportionately according to the concentration of nitrate or nitrite solution administered (Table 5). This fact suggests that greater risk of methemoglobinemia may be associated with increased exposure to sources of nitrate and nitrite compounds. In animal groups administered with nitrate solution, peak plasmanitrate was obtained at different post-administration times. Peak concentration was attained later in the group two which received higher concentration of nitrate (Table 4) which seems to suggest a longer retention time in the gut, a condition which enhances the chance of thiocynate-catalyzed formation of carcinogenic N-nitrosa mine [12]. However, further observation of fluctuations of blood nitrate in a higher number of animal groups would be required to validate this assumption. Peak concentration was attained at same time in groups three and four which have insignificantly different nitrite levels. From the foregoing, higher concentration of ingested nitrates and nitrites enhances the odds of Methemoglobin and N-nitosamine toxicity. While this is a likely scenario for nitrates and nitrites ingested in vegetables as well, irregularities in the absorption of nitrates and nitrites may arise in this case due to influence of vegetable matter in absorption. Otherwise, nitrates and nitrites tend to be more toxic at higher concentrations as shown in the kinetic results for administered nitrate and nitrate solutions (Figures 3 and 4).
The activities of oil refinery companies constitute a significant threat to health. The observed relationshipbetween concentration of administered nitrate and nitrite and their peak blood levels point to the higher risk of toxicity arising from consumption of nitrate-laden vege tables by inhabitants near the refinery and petrochemical
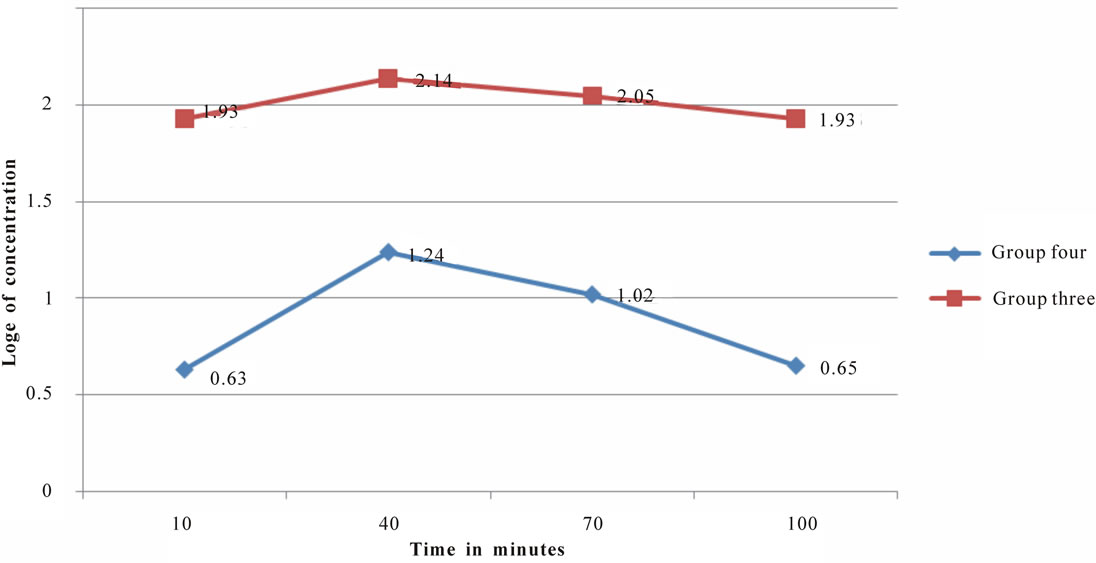
Figure 3. Time-course change in plasma concentration of nitrite in groups three and four.

Figure 4. Time-course change in plasma concentration of nitrate in groups one and two. Curves are fairly linear in the ascending and descending phases.
facilities.
5. ACKNOWLEDGEMENTS
We are indebted to the laboratory staff of Michael Okpara University of Agriculture especially Mr. Okwor for invaluable assistance. Also to Mr Girum Azmach, a PhD fellow at the Bioscience Center, International Institute of Tropical Agriculture, Ibadan for a thorough review of the manuscript and for useful comments and suggestions.
REFERENCES
- Beatson, C.G. (1978) Methaemoglobinaemia-nitrates in drinking water. Environ Health, 86, 31-33.
- Biocev, I.V. and Pocinkova, Z. (1972) Effect of applied artificial fertilizers on the soil, drinking water and foodstuffs of vegetable origin. Report on the International Congress of Country Hygiene, Varna (in Russian).
- Brown, J.R. and Smith, G.E. (1969) Nitrate accumulation in vegetable crops as influenced by soil fertility practices. Research Bulletin, 920, 43.
- Standford, G., England, C.B. and Taylor, A.W. (1970) Fertilizer use and Water quality. US Department of Agriculture, Agricultural Research Service, University Park.
- US Environmental Protection Agency (2010) Nitrous oxide: sources and emissions. HUhttp://www.epa.gov/nitrousoxide/sources.htmlUH.
- Dung, E.J., Bombom, L.S. and Agusomu, T.D. (2008) The effects of gas flaring on crops in the Niger-delta, Nigeria. Geojournal, 73, 293-305. HUdoi:10.1007/s10708-008-9207-zU
- NNPC (2011) NNPC Port Harcourt Refining Company Limited (PHRC). HUhttp://140.174.118.211/nnpc-group/phrcU
- Nwogu, L.A. and Onyeze, G.O.C. (2010) Environmental impact of gas flaring on ebocha-egbema, Niger Delta. 'Nigerian Journal of Biochemistry and Molecular Biology, 25, 25-30.
- Walker, R. (1990). Nitrates, nitrites and N-nitrosocompounds: A review of the occurrence in food and diet and the toxicological implications. Food Additives and Contaminants, 7, 717-768. HUdoi:10.1080/02652039009373938U
- Argonne National Laboratory, EVS (2005) Human health fact sheet. Nitrate and Nitrite. HUwww.ead.anl.gov/pub/doc/nitrate-ite.pdfU
- Hegesh, E. and Shiloah, J. (1982) Blood nitrates and infantile methemoglobinemia. Clinica Chimica Acta, 125, 107-115. HUdoi:10.1016/0009-8981(82)90187-5U
- Onyesom, I. and Okoh, P.N. (2006) Quantitative analysis of nitrate and nitrite contents in vegetables commonly consumed in Delta State, Nigeria. British Journal of Nutrition, 96, 902-905. HUdoi:10.1017/BJN20061915U
- Fritsch, P., de Saint Blanquat, G. and Derache, R. (1979). Absorption kinetics of nitrate and nitrite in the intestine of rats (author’s transl). Toxicological European Research, 2, 141-147
- Spiegelhalder, B., Eisenbrand, G. and Preussman, R. (1976) The influence of dietary intake of nitrate on the nitrite content in human saliva: A factor of possible relevance for in vivo formation of N-nitroso compounds. Food and Cosmetics Toxicology, 14, 545-548. HUdoi:10.1016/S0015-6264(76)80005-3U
- Tannenbaum, S.R., Weisman, M. and Felt, D. (1979) The effect of nitrate intake on nitrite formation in human saliva. Food and Cosmetics Toxicology, 14, 549-552. HUdoi:10.1016/S0015-6264(76)80006-5U
- Witter, J.P. and Balish, E. (1979) Distribution and metabolism of ingested NO3- and NO2- in germfree and conventional-flora rats. Applied and Environmental Microbiology, 38, 861-869.
- Cohen, B. and Myant, M.B. (1959) Concentration of Salivary iodide: A comparative study. Journal of Physiology, 145, 595-610.
- Cortas, N.K. and Wakid, N.W. (1991) Pharmacokinetic aspect of inorganic nitrate ingestion in men. Pharmacology & Toxicology, 68, 192-195. HUdoi:10.1111/j.1600-0773.1991.tb01221.xU
- Mensinga, T.T, Speijers, G.J.A. and Meulenbelt, J. (2003) Health implications of exposure to environmental nitrogenous compounds. Toxicological Reviews, 22, 41-51. HUdoi:10.2165/00139709-200322010-00005U
- Knobeloch, L., Salna, B., Hogan, A., Postle, J. and Anderson, H. (2000) Blue babies and nitrate-contaminated well water. Environmental Health Perspectives, 108, 675-678. HUdoi:10.1289/ehp.00108675U
- WHO-Environmental Health Criteria 5 (1978) Nitrates, nitrite and N-nitroso compounds. World Health Organization, Geneva.
- Brown, J.R., Marshall, C.S. and Smith, S.G. (1993) Nitrate in soils and plants. University of Missouri Extension. HUhttp://extension.missouri.edu/p/G9804UH
- Follett, I.A. and Ratcliff, P.N. (1963) Determination of nitrite and nitrate in meat products. Journal of the Science of Food and Agriculture, 14, 138-144. HUdoi:10.1002/jsfa.2740140302U
- Santamaria, P. (2006) Nitrate in vegetables: Toxicity, content, intake and EC regulation. Journal of the Science of Food and Agriculture, 86, 10-17.
- Wu, T. and Wang, Y. (1995) Effects of some environmental factors on nitrate content of Chinese cabbage (Brassica chinensis L.). Journal of the Chinese Agricultural Chemical Society, 33, 125-133.
- Nduka, J.K., Orisakwe, O.E., Ezenweke, L.O., et al., (2008) Acid rain phenomenon in Niger delta region of Nigeria: Economic, biodiversity, and public health concern. Scientific World Journal, 8, 811-818.
- McKnight, G.M., Duncan, C.W., Leifert, C. and Golden, M.H. (1999) Dietary nitrate in man: Friend or foe? British Journal of Nutrition, 81, 349-358. HUdoi:10.1017/S000711459900063XU
- Zhou, Z.Y., Wang, M.J. and Wang, J.S. (2000) Nitrate and nitrite contamination in vegetables in China. Food Reviews International, 16, 61-76. HUdoi:10.1081/FRI-100100282U
- EC (European Commission) (1999) Commission regulation (EC) No 864/99 of 26 April 1999 amending regulation (EC) No. 194/97 setting maximum levels for certain contaminants in foodstuffs. Official European Journal of Communication, 108, 16-18.
- Speijers, G.J.A. (1996) Nitrate, in Toxicological evaluation of certain food additives and contaminants in food. World Health Organization, Food Additives Series, Geneva.
- Speijers, G.J.A. and van de Brandt, P.A. (2003) Nitrate (and potential endogenous formation of N-nitroso compounds). WHO Food Additives Series 50. HUhttp://www.inchem.org/documents/jecfa/jecmono/v50je06.htmU
- SCF (Scientific Committee on Food) (1997) Assessment of dietary intake of nitrates by the population in the European Union, as a consequence of the consumption of vegetables. Reports on Tasks for Scientific Cooperation: Report of Experts Participating in Task 3.2.3, European Commission, Brussels.
- Maynard, D.N., Baker, A.V., Minotti, P.L. and Peck, N.H. (1976) Nitrate accumulation in vegetables. Advances in Agronomy, 28, 71-118. HUdoi:10.1016/S0065-2113(08)60553-2U