Psychology
Vol.05 No.14(2014), Article ID:50251,-31 pages
10.4236/psych.2014.514170
Sensory Evaluation Spectrum Method as a Descriptive Sensory Analysis
Department of Health Science, Prefectural University of Hiroshima, Hiroshima, Japan
Email: yamagata@pu-hiroshima.ac.jp, sugawara@pu-hiroshima.ac.jp
Copyright © 2014 by authors and Scientific Research Publishing Inc.
This work is licensed under the Creative Commons Attribution International License (CC BY).
http://creativecommons.org/licenses/by/4.0/


Received 3 July 2014; revised 1 August 2014; accepted 27 August 2014
ABSTRACT
Sensory evaluation is used to measure consciousness, and primarily developed in experimental and mathematical psychology. Sensory experiences can be reported using verbal (semantic) methods. This paper presents an overview of our semantic research achievements over the past decade, focusing on methodological attempts for substantiating the measure as a descriptive sensory analysis. Two types of studies that deserve particular attention are detailed: 1) evaluation of the efficacy of photo catalytic elimination of stains or bio-aerosols in air using TiO2 and photo catalytic deodorizing properties of a TiO2-type deodorizer; and 2) evaluation of the differential discrimination of perceived odor quality for a given aroma while inhaling the fragrances of essential oils. Both studies are based on semantic responses of participants. The perceived sensory attributes in the participants can be represented by a sensory spectrum: a bar graph whereby the mean of the impressions is plotted against the setting semantic impression descriptors. In the former study, we provide a background on the sensory evaluation spectrum method and discuss its implementation as a measure of descriptive sensory analysis. The latter study additionally demonstrates how statistical defects were overcome when spectra were not statistically significant.
Keywords:
Sensory evaluation, Photocatalytic elimination of bio-aerosol, Photocatalytic deodorizing efficacy of TiO2, Differential discrimination of perceived odor quality

1. Introduction
Sensory evaluation is a method used to measure consciousness, primarily developed in experimental and mathematical psychology (Coombs, 1964; Guilford, 1954; Kling & Riggs, 1972; Stevens, 1951; Torgerson, 1958). Sensory experiences can be reported using verbal (semantic) methods. To elucidate the relationship between mood change, odor, and associated psychophysiological effects in humans while inhaling the fragrances of essential oils, and linalool and its enantiomers ((R)-(−)-, (S)-(+)-, and (R,S)-(±)-forms), the authors developed a sensory (verbal) measure of the perceived odor quality for a given aroma and associated statistical analysis (Satoh & Sugawara, 2003; Sugawara, 2001; Sugawara et al., 1998a, 1998b, 1999, 2000, 2003, 2006, 2008, 2009a, 2009b, 2013). Additionally, methodological approaches were investigated for substantiating the measure as a descriptive sensory analysis (Sugawara et al., 2009a, 2009b).
This paper presents an overview of our semantic research achievements over the past decade, focusing on attempts undertaken for establishing methodological approaches. Of particular relevance are the following two types of investigations that were both based on the semantic responses of participants. One study evaluated the efficacy of the photo catalytic elimination of stains or bio-aerosols in an air using TiO2 and the photo catalytic deodorizing properties of a TiO2-type deodorizer. The other study assessed the differential discrimination between perceived odor quality of a given aroma after inhaling fragrances of essential oils, and linalool and its enantiomers.
In the first study of the former investigation, of which the primary object was to determine the performance of the photo catalytic elimination of stains or bio-aerosols in air using TiO2, the participants’ impressions were recorded on an 11-point scale using 13 contrasting pairs of adjectives. For this objective, we assembled a storeroom, in which one of the sliding doors of the storeroom was coated with a TiO2 emulsion, while the other door was not coated, and placed it in open air for two years. Two years later, the inquiry assessment was conducted twice: once for the TiO2-coated door and once for the uncoated door. The mean of the impression difference between the assessment for the TiO2-coated door and the assessment for the uncoated door was plotted against the descriptors. The resulting bar graph (sensory evaluation spectrum) showed an upward trend with a positive value against the descriptors. This suggests that the results involving the coated door were superior to that of the uncoated door related to the 13 setting semantic variables. In the second study of the former investigation, we examined the deodorizing efficacy of a TiO2-type deodorizer using the impression of refrigerator odors as the indicator when a TiO2-type deodorizer setting was in the participants’ respective home refrigerators. The assessment was conducted in three steps: 1) prior to the introduction of the deodorant in the refrigerator; 2) following storage of the deodorant in the refrigerator for 1 week; and 3) 1 week after removal of the deodorant from the refrigerator. The scores recorded in the first step assessment were subtracted from the corresponding values obtained in the second step assessment. Similarly, the scores registered in the second step assessment were subtracted from the corresponding values obtained in the third step assessment. It was shown that a pair of sensory spectra could represent a functional aspect of the deodorizing efficacy of the photo catalytic deodorant: one spectrum relating to the installation of the deodorant in the refrigerator and the other spectrum relating to the removal of the deodorant from the refrigerator.
In the second investigation, the differential discrimination between perceived odor quality of a given aroma in the presence of fragrances comprising essential oils, and linalool and its enantiomers was assessed in relation to different behavioral tasks assigned to the subjects; aroma perception was evaluated by a sensory test before and after the task. The behavioral tasks employed were as follows: 1) the participants were subjected to environmental natural sounds such as bird songs or the murmuring of a small stream for the auditory task; 2) the participants conducted mental arithmetic work involving adjacent rows of numbers (100 numbers per row) as the mental task; and 3) the participants were subjected to a physical task that involved stepping up and down a 20-cm step at a rate of 30 times per min for 5 min. The differences between the pre- and post-task scores were evaluated in terms of sensory evaluation spectrum. Inhalation of (R)-(−)-linalool or (R,S)-(±)-linalool in association with the auditory task produced a positive impression of odor quality, whereas this effect was not seen for (S)-(+)-linalool. In contrast, inhalation of (R)-(−)-linalool, (S)-(+)-linalool, and (R,S)-(±)-linalool in association with the mental arithmetic task all produced a negative impression of odor quality. This indicates that the enantiomers of linalool have different smells and that their perception is task dependent.
Incidentally, sensory analysis comprises a variety of tools and tests that can be used for subjective or objective evaluation of sensory properties. Our sensory test can be categorized as descriptive sensory analysis (Sugawara et al., 2009a, 2009b, 2013). Descriptive sensory analysis typically involves trained individuals (generally 6 - 12) to identify and quantify specific sensory attributes (Drake, 2004, 2007; Lawless & Heymann, 1988; Meilgaard et al., 1999). In contrast, our research involved untrained individuals as panelists. As such, factors such as interest in sensory target, sensitivity to stimuli, and susceptibility to fatigue vary among the panelists. This was obvious from the questionnaire, whereby the standard deviation of the responses was remarkably large compared with the value of the mean for the 13 descriptors, as described elsewhere (Sugawara et al., 1999, 2009a). Regardless, our findings demonstrate that the obtained sensory properties are identical to those obtained from a typical descriptive sensory analysis, comprising trained individuals as panelists (generally 6 - 12). Based on these findings, the present review aims to describe our sensory evaluation spectrum method, and its development and application as a measure of descriptive sensory analysis. In regard to its application, we demonstrate how statistical difficulties were overcome (specifically when spectra did not attain statistical significance) as well as other difficulties.
2. Sensory Evaluation Spectrum Method
The sensory evaluation spectrum method is first discussed in reference to one of our sensory studies, whereby the target sensory property was to determine the efficacy of the photocatalytic elimination of stains or bio- aerosols in an air using TiO2.
Since Matsunaga and coworkers (1985) reported the photocatalytic sterilization of microbial cells by TiO2 under illumination, it has been known that TiO2 possesses many functions not only towards the photocatalytic sterilization of microbial cells, but also towards the photocatalytic decomposition of organic compounds, photocatalytic removal of stains and mold in indoor environments, and photocatalytic elimination of bio-aerosols in air (Fox & Dulay, 1993; Glaze, 1986; Maness et al., 1999; Matsunaga et al., 1988; Mills et al., 1993; Pecchi et al., 2001; Watanabe et al., 2003; Zhang & Sun, 2004). Many groups have used this technology for a variety of medical applications and for incorporation into industrial goods.
In our sensory evaluation spectrum method, semantic responses from participants were used to determine the efficacy of photocatalytic elimination of stains or bio-aerosols in air by TiO2. It should be mentioned that untrained (inexperienced) individuals as panelists were employed though the sensory test used typically requires the use of trained individuals as per classification by the following scientists (Drake, 2004, 2007; Lawless & Heymann, 1988; Meilgaard et al., 1999). Our methodology follows the procedure developed for the evaluation of perceived odor quality of essential oils as described, involving untrained individuals as panelists (Satoh & Sugawara, 2003; Sugawara, 2001; Sugawara et al., 1998a, 1998b, 1999, 2000, 2003, 2006, 2008).
For the study, involving untrained individuals as panelists, one of the sliding doors (
Five judges were selected and chose 23 contrasting pairs of adjectives (Table 1) to assess the efficacy of the photocatalytic elimination of stains or bio-aerosols in air using TiO2. An additional five panelists were requested to stand in front of the storeroom and assign the applicable threshold values (scores) for each adjective pair listed in Table 1 as follows: 0—“unfavorable or unsuitable”; 1—“preferable to choose”; or 2—“favorable or suitable.” The following were deemed by the judges to be appropriate, that is, all judges marked them at more than level 1: bright—dark, clear—heavy, pure-sandy, clean—dirty, agreeable—disagreeable, comfortable— uncomfortable, likeable—dislikable, fresh—stale, fine—dusty, transparent—opaque, brilliant—stringy, glossy— gloomy, and slippery—coarse.
Two years later after leaving the storeroom in open air, the inquiry assessment (sensory test) was conducted twice using the 13 contrasting pairs of adjectives: 1) once fortheTiO2-coated door; and 2) once for the uncoated door. An 11-grade evaluation was made from −5 to +5, with 0 as the intermediate score and without any symbolic representation of the numbers in a similar way to the aforementioned applicable threshold values or the Linkert scale (Linkert, 1932). Fifty-two panelists completed the study. Among them, 18 were non-student volunteers with an age range from the 20s to 70s; they formed Panel A (non-student panel). The other 34 panelists were female students, ages 19 and 20 years, attending the Prefectural University of Hiroshima; they formed Panel B (student panel). No participants overlapped as a panelist in these inquiries.
In each panelist in each experimental run, the scores of the first inquiry for the coated door were subtracted from the corresponding scores of the second inquiry for the uncoated door, individually. As the inquiry assessment for the uncoated door used as the control (reference), the mean of the impression difference between the

Table 1. Twenty-three contrasting pairs of adjectives selected by five panelists for assessing the efficacy of photocatalytic elimination of stains or bio-aerosols in air using TiO2. Reproduced from Sugawara et al., 2009a.
 (a) (b)
Figure 1. Sensory evaluation spectra: impression changes of the subjects between the TiO2-coated door and the uncoated door. Reproduced from Sugawara et al., 2009a. Sensory evaluation spectra obtained from (a) a non-student panel (n = 18) and (b) a student panel (n = 34). The assessment by inquiry was conducted in two steps, involving the TiO2-coated door and the uncoated door. The resulting impression changes of the subjects between the two steps for the TiO2-coated door case study and the uncoated door case study are depicted against the 13 impression descriptors. The statistical significance for each descriptor was tested by Student’st-test, and descriptors regarded as statistically significant at a probability value of p < 0.05 are denoted with a single asterisk (*).
scores of the first assessment for the coated door and the second assessment for the uncoated door was plotted against the descriptors. The resulting bar graph (sensory evaluation spectrum) is shown in Figure 1. Figure 1(a) indicates the results obtained from Panel A and Figure 1(b) shows the results obtained from Panel B. Both figures demonstrate an upward trend with a positive value in terms of the 13 descriptors. This suggests that the results obtained from the coated door assessment were superior to those of the uncoated door assessment based on the viewpoints of “bright,” “clear,” “clean,” “likeable,” “fine,” “brilliant,” and the other setting descriptors. The statistical significance in the change of the scores between the first inquiry and the second inquiry was evaluated by Student’s t-test. The resulting statistical significance was indicated on each descriptor as follows: data marked with * denotes that the impression difference was significant with p < 0.05, and for the non-marked data, p ³ 0.05. As shown in Figure 1, the 13 descriptors were all regarded to be significant in both spectra as all items were marked (*). For an effective or positive correlation between the impression and the application of TiO2, the descriptors regarded as significant by the t-test have a positive value and appear above the horizontal axis. In contrast, negative values appear below the axis for an ineffective or negative correlation between the impression and the application of TiO2. Both spectra indicate a striking resemblance so that the improvement obtained by the application of TiO2 was demonstrated statistically.
Thus, we demonstrate that the sensory evaluation spectrum method may not only provide information for use in the assessment of the performance of TiO
3. Further Development of the Sensory Evaluation Spectrum Method for Application as a Descriptive Sensory Analysis
This section presents further development of the sensory evaluation spectrum method for application as a measure of descriptive sensory analysis. Based on our previous sensory assessments for detecting the deodorizing performance of a TiO2-type deodorizer using the impression of refrigerator odors as the indicator, the aims of the study in this section were to assess 1) as to whether the resulting sensory spectrum can be considered as statistically significant across the spectrograph; 2) the numbers of impression descriptors regarded as statistically significant among the 13 descriptors; and 3) the number of panelists (individuals) per group needed to identify and quantify specific sensory attributes if the study is employing untrained (inexperienced) individuals.
Based on the fact that the sensory evaluation spectrum method may provide information not only for use in the assessment of photo catalytic elimination of stains or bio-aerosols in air, but also for use in diverse TiO2-related applications, we attempted to evaluate the photocatalytic efficacy of a TiO2-type deodorizer using the perceptional changes of participants in assessing refrigerator odors. A commercially available deodorizer (Ohno Sekiyu Co. Ltd., Hiroshima, Japan) was used, and contains a surface layer coated with TiO2 powder obtained through a reaction process in which the aqueous colloid solution can be dried and calcined in an oven. The length, width, and height of the deodorizer were respectively, 9, 8, and
When setting the deodorant in the participants’ respective home refrigerators, a series of sensory tests were conducted using the impression of refrigerator odors as an indicator. The aforementioned 13 contrasting adjective pairs were used for the sensory evaluation, and each was scored on an 11-point scale (from −5 to +5). Three inquiry assessments (sensory tests) were conducted as follows: 1) prior to the introduction of the deodorant in the refrigerator; 2) following storage of the deodorant in the refrigerator for 1 week; and 3) 1 week after removal of the deodorant from the refrigerator.
Figure 2 shows the mean-deviation profile for the sensory tests. The following focuses on results obtained from Panel A (Figure 2(a)). The negative values of the scores for the first inquiry (i.e., the inquiry before installation of the deodorizer) appear below the horizontal axis, whereas the scores for the second inquiry (i.e., the inquiry after installation of the deodorizer) were positive values. This tendency was reversed for the third inquiry (i.e., the inquiry after removal of the deodorizer) with negative values appearing below the axis. However, in each inquiry, a large standard deviation value for each descriptor was noted relative to the mean; the second inquiry results showed a lower standard deviation trend when compared with that of the first and third inquiry results. No discrepancy was observed in the study obtained from Panel B (Figure 2(b)). These were statistically non-significant, considering the large standard deviation.

Figure 2. The mean ± standard deviation profile obtained by sensory test using the change of impression of refrigerator odors as the indicator. Reproduced from Sugawara et al., 2009a. The studies were undertaken in (a) 2003 (n = 21) and (b) 2004 (n = 35). The assessment by inquiry was conducted in three steps: 1) prior to the introduction of the deodorizer in the refrigerator; 2) following storage of the deodorant in the refrigerator for 1 week; and 3) 1 week following removal of the deodorant from the refrigerator. The resulting perceptional changes of the subjects related to refrigerator odors assessed by 13 contrasting pairs of adjectives on an 11-point scale (−5 to +5) are depicted. Open bars represent the first inquiry before installation of the deodorizer; diagonal-shaded bars represent the second inquiry after installation of the deodorizer; and filled bars represent the third inquiry following removal of the deodorizer.
The scores recorded in the first inquiry of each panelist were subtracted from the corresponding values obtained in the second inquiry. Similarly, the scores registered in the second inquiry were subtracted from the corresponding values in the third inquiry. Figure 3 depicts the resulting sensory evaluation spectrum. Both Figure 3(a) and Figure 3(c) show spectra indicating the impression difference between before and after installation of the deodorizer, whereas Figure 3(b) and Figure 3(d) give the impression difference between the installation of the deodorizer and removal of the deodorizer. These are represented by a bar graph, and the statistical change for each descriptor was assessed by the t-test, in which the statistical significance was marked (*) if the impression difference was significant at a probability value of p < 0.05. Results presented in Figure 3(a) and Figure 3(b) were obtained from Panel A, whereas those in Figure 3(c) and Figure 3(d) were obtained from Panel B.
In a sensory evaluation spectrum, if there is a positive correlation between the change of smell in the refrigerator and the installation of the deodorizer, the descriptors regarded as significant by the t-test have a positive value and are shown above the horizontal axis; negative values appear below the axis if there is a negative correlation between the change of the smell and the installation of the deodorizer or removal of the deodorizer. It can be seen in Figure 3 that both spectra a and c (i.e., Figure 3(a) and Figure 3(b)) show odor improvement when the deodorizer was placed in the refrigerator. However, the sensory features of spectra b and d (i.e., Figure 3(b) and Figure 3(d)) both showed opposite trends to those of spectra of a and c, respectively, indicating an intensified fouling smell following removal of the deodorizer from the refrigerator.
A question may arise as to whether the resulting sensory profile can be regarded as statistically significant across the variations in the spectrograph. This issue was addressed by applying the sign test with n = 13, corres-

Figure 3. Sensory evaluation spectra for the efficacy of a photocatalytic deodorizer. Reproduced from Sugawara et al., 2009a. The studies were undertaken in (a), (b) 2003 (n = 21) and (c), (d) 2004 (n = 35). Sensory spectra obtained (a), (c) when the deodorizer was placed in the refrigerator and following storage for 1 week, and (b), (d) after 1 week following removal of the deodorant from the refrigerator. The statistical significance for each descriptor was tested by the t-test: descriptors regarded to be significant at a probability value of p < 0.05 are indicated with a single asterisk (*); descriptors regarded to be significant with p £ 0.05 - 0.1 are indicated with ±; and descriptors regarded to be insignificant with p ³ 0.1 are unmarked.
ponding to the number of descriptors used in our sensory test. It should be noted that the resulting sensory spec- trum reached significance (p < 0.05) when the number of the descriptors regarded as significant at a probability value of p < 0.05 by the t-test was greater than 10. In contrast, when this value was less than three, a null hypothesis could be rejected.
This value can be calculated from Figure 3 as 11 for spectrum a, 13 for b, 13 for c, and 10 for d so that the change in the obtained spectra was significant (p < 0.05), excluding data of spectrum d. In spectrum d, the change was not significant statistically although 10 items were regarded as significant (p < 0.05) by the t-test. If we changed the level of significance from p < 0.05 to p < 0.1, two descriptors pure-musty and refined-vulgar would be significant (0.05 £ p < 0.1). If these are marked as ± in the graph (Figure 4(d)) and one considers the two ± would change to one +, the change in spectrum d would be significant across the variations in the spectrograph on the basis of the sign test (p < 0.05).
Hence, in our research, the statistical significance of each impression descriptor was marked and scored as follows: 1) * and significance score = 1 if the impression difference was regarded to be significant with p < 0.05; 2) ± and significance score = 0.5 if the impression difference was regarded to be significant with p £ 0.05 - 0.1; and 3) unmarked and significance score = 0 if the impression difference was regarded to be insignificant with p³ 0.1. Addition of these scores, defined as the total significance score S13i = 1 (significance score of descriptor)i, can be used as an indicator to assess the statistical significance of the resulting sensory profile across the variations in the spectrograph. This value is expected to be > 10 if the obtained sensory spectrum is significant (p < 0.05). At values < 3, a null hypothesis can be rejected.
The total significance score was calculated from each spectrum shown in Figure 3, and these were 11.0 for spectrum a, 13.0 for b, 13.0 for c, and 11.0 for d. According to the sign test (p < 0.05), all spectra were statistically significant across the variations in the spectrograph. Moreover, the results showed that a pair of sensory
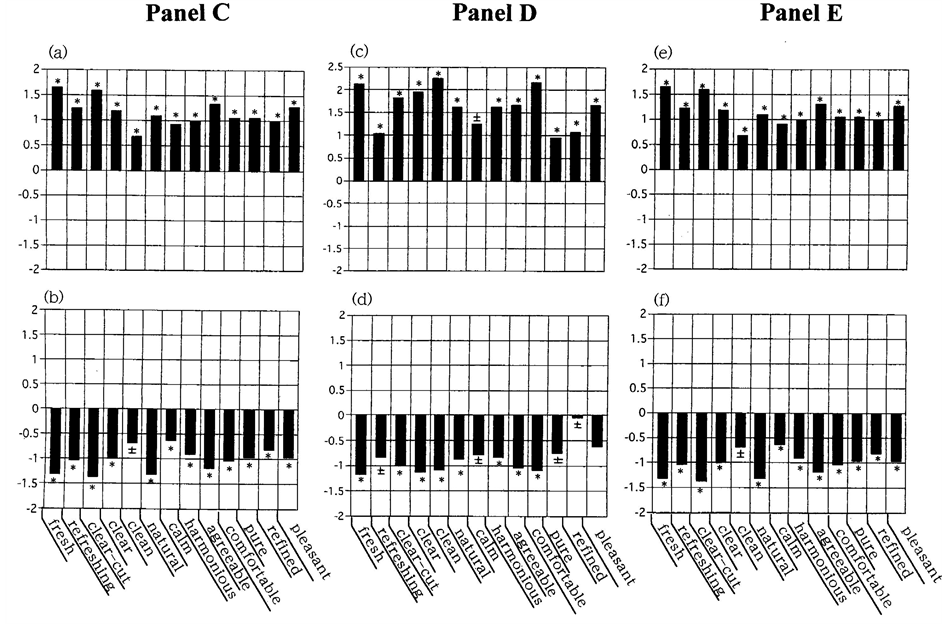
Figure 4. Sensory evaluation spectra for the efficacy of a photocatalytic deodorizer. Reproduced from Sugawara et al., 2009b. (a), (c), (e) Sensory spectra obtained when the deodorizer was placed in the refrigerator and following storage for 1 week using the participants impressions of smell within the refrigerator as indicator. (b), (d), (f) Spectra obtained 1 week following removal of the deodorant from the refrigerator. The number of panelists was 30 for Panel C, 31 for Panel D, and 21 for Panel C. The statistical significance for each descriptor is identical to that in Figure 3.
spectra could represent a functional aspect of the deodorizing efficacy of a photo catalytic deodorant: one was a spectrum relating to the installation of the deodorant in a refrigerator and the other spectrum relating to the removal of the deodorant. The former spectrum shows that the intensity of the odors decreased upon use of the deodorizer, whereas the latter spectrum indicates that the odors intensified upon removal of the deodorizer.
Additionally, Figure 4 illustrates the outcomes from another series of duplication experiments that included our sensory profiling data (Sugawara et al., 2009b). Here, 82 panelists were employed. Among them, 61 panelists were female students attending the Prefectural University of Hiroshima with ages from 18 to 20 years. Within this group, 30 students formed Panel C, whereas the remaining 31 students formed Panel D. The other 21 panelists were non-student volunteers with ages from the 20s to 60s, and formed Panel F (non-student panel). In Figure 4, the total significance score was calculated as follows: 11.0 for spectrum a, 12.5 for b, 12.5 for c, 10.0 for d, 13.0 for e, and 12.5 for f. It should be noted that the obtained spectra were regarded as statistically significant across variations in the spectrograph, excluding data from spectrum d. Because the total significance score associated with spectrum d was less than 10, the obtained sensory spectrograph was not regarded as significant (p < 0.05).
In regard to determining the number of panelists (individuals) per group required to identify and quantify specific sensory attributes using untrained (inexperienced) individuals, the following procedure was employed (Sugawara et al., 2009b). The sensory assessment by inquiry was conducted in two parts using the impression of refrigerator odors as indicator: prior to the introduction of the deodorant in the refrigerator and following storage of the deodorant in the refrigerator for 1 week. Thirty-two female students, all attending the Prefectural University of Hiroshima with ages from 18 to 20 years, participated in this experiment. The number of participants as panelists varied from n = 5 to n = 32, following the order of assignment randomized using a table of random numbers from the sensory data collected from the 32 participants.
Figure 5 shows the changes in the shape of individual graphs obtained when the number of panelists varied from n = 5 to n = 32. First, five participants were randomly selected from the original 32 sensory data; the resulting sensory spectrograph is shown in Figure 5(a). Then, an additional five participants were randomly selected from the remaining sensory data, and the resulting spectrograph is shown in Figure 5(b). Thus, Figure 5(b) contains the data of the five participants that were selected for constructing the spectrograph depicted in Figure 5(a). The procedure was repeated accordingly to generate the following spectra: Figures 5(c) (n = 15), 5(d) (n = 20), 5(e) (n = 25), and 5(f) (n = 32). The findings suggest a satisfactory-to-good agreement in reproducibility and consistency with sensory attributes in terms of shape and the total significance score of the obtained sensory spectrographs.
Figure 6 shows the changes in the total significance score (i.e., the total sum of the statistical scores of each descriptor: 1.0 for items denoted with *; 0.5 for items denoted with ±; and 0.0 for the unmarked items) as a function of the number of panelists (n = 5 - 32). As demonstrated, the total significance scores were all above 10, although a small exception was seen in case of the spectrograph of Figure 4(d) (i.e., the value of total significance score was just 10). Based on the sign test with n = 13 (whereby 13 pairs of impression descriptors were used in our sensory test), the value is expected to be greater than 10.
4. Differential Discrimination between Perceived Odor Quality in the Presence of a Group of Fragrances Constituting Essential Oils, and Linalool and its Enantiomers Using the Sensory Evaluation Spectrum as a Function of Behavioral Tasks Assigned to the Subjects
Humans can detect and discriminate a vast variety of odors. The number of distinctive perceived scents is estimated to be greater than 10,000 (Roderick, 1966; Firestein, 1991). Humans are capable of distinguishing even slight alterations in the structure of an odorous molecule. As for enantiomeric pairs of odorants, which possess the same molecular structure except for the chiral portion, it is known that these can lead to profound changes in perceived odor quality. For instance, it has been shown that (+)-carvone is characterized by a caraway-like scent, whereas (−)-carvone has a spearmint-like herbal odor (Friedman & Miller, 1971; Leitereg et al., 1971). The enantiomers of carvotanacetone and trans-dehydrocarvone, synthesized from (+)-carvone, have a caraway-like scent; those synthesized from (−)-carvone have a spearmint-like scent (Russell & Hills, 1971), and (+)- and (−)-linalool respectively have petitgrain- and lavender-like scents (Ohloff & Klein, 1962). How precisely can humans and their olfactory system detect and discriminate between diverse types of odors and subtle differences in the molecular structures?
As a measure (sensory profiling) of the perceived odor quality in participants after inhalation of a given aroma on the basis of the task-dependent sensory questionnaire assessments (discussed later), we employed a sensory evaluation spectrum. The present discussion demonstrates our research accomplishments relating to the application

Figure 5. Changes in the shape and total significance score relating to the efficacy of a photocatalytic deodorizer case study when the number of panelists was varied from n = 5 to n = 32. The total sum of the statistical scores of each descriptor is as follows: 1.0 for items marked with*; 0.5 for items marked with ±; and 0.0 for unmarked items. Reproduced from Sugawara et al., 2009b. (a) n = 5, (b) n = 10, (c) n = 15, (d) n = 20, (e) n = 25, and (f) n = 32. The corresponding total significance scores were calculated as follows: (a) 12.0, (b) 11.5, (c) 13.0, (d) 13.0, (e) 13.0, and (f) 12.5.
of the sensory evaluation spectrum method in assessing the participants ability to discriminate between perceived odor quality while inhaling the fragrance of essential oils, and linalool and its enantiomers and being subjected to behavioral tasks (Satoh & Sugawara, 2003; Sugawara, 2001; Sugawara et al., 1998a, 1998b, 1999, 2000, 2003, 2006, 2008, 2009a, 2009b, 2013).
As summarized in Table 2, the sensory features of the 21 essential oils, and one monoterpenoid (linalool) and its enantiomeric isomers are as follows: basil (Ocimum basilicum), bergamot (Citrus bergamia), cardamom
Table 2. Summary of the total significance scores obtained from statistical analysis on verbal (semantic) responses to odorant involving 21 essential oils, linalool and its enantiomeric isomers. Reproduced from Sugawara et al., 2013.
(Elettaria cardamomum), chamomile (Matricaria chamomilla), cinnamon (Cinnamomum zeylanicum), clove (Syzygium aromaticum), cypress (Cupressus sempervirens), geranium (Pelargonium graveolens), ho leaf/wood (Cinnamomum camphora), juniper (Juniperus communis), lavender (Lavandula angustifolia), lemon (Citrus limon), lime (Citrus latifolia), marjoram (Origanum majorana), orange (Citrus sinensis), palmarosa (Cymbopogon martini), peppermint (Mentha piperita), rosemary (Rosmarinus officinalis), sandalwood (Santalum album), spearmint (Mentha spicata), and ylang ylang (Cananga odorata).
In Table 2, 1631 subjects formed the sensory test panel and were involved in the study. Among the subjects, 90 were male students from Hiroshima University aged between 18 and 24 years. The remaining subjects were female students at either Hiroshima University, Hiroshima Prefectural Women’s University (Prefectural University of Hiroshima then, but renamed on April 1 2005), or Suzugamine Women’s College, aged between 18 and 22 years. Hence, the proportion of male participants was only about 5%. No participants overlapped as a panelist.
The essential oils were purchased from Fleur (London, UK) and linalool was purchased from Kanto Kagaku Co., Ltd. (Tokyo, Japan). To identify the optimal concentration of each odorant for the inhalation experiments, preliminary sensory tests were performed according to the method described by Sugawara et al. (1999, 2006, 2008, 2013). Serially diluted solutions (1/1, 1/5, 1/10, 1/50, 1/100, 1/1000, and 1/10 000) of the odorants in deodorized diethyl phthalate were presented to several judges (usually five) via an inhalator composed of a glass inhalator device and a 300-mL flask with a ground-glass stopper. The inhalator flask was loaded by applying 200 μL of diluted odorant to a small strip of filter paper placed at the bottom of the flask. The flask was sealed with a ground-glass stopper and moistened with odorant.
Optically active linalools ((R)-(−)-, (S)-(+)-, and (R,S)-(±)-forms) were obtained by subjecting lavender oil, coriander oil, and commercial linalool to repeated flash column chromatography on silica gel (solvent: hexane/ethyl acetate, 9:1, v/v) (see Sugawara et al., 2000 for details). For example, lavender oil (

Figure 6. Plot of the total significance score as a function of the number of panelists (n = 5 - 32) for the efficacy of a photocatalytic deodorizer case study. Reproduced from Sugawara et al., 2009b. Based on the sign test with n = 13 (13 pairs of impression descriptors were used in the sensory test), the required value is expected to be more than 10.
yield of 74.5%, a (S)-form content of 49.1%, and a (R)-form content of 50.9% based on GLC, and a specific rotation of [α]D = 0˚ was re-purified from commercial linalool. For the sensory profiling, we used 20 mg/mL of the enantiomers solutions because this concentration was classified as level 3 and above (“weak odor but the odor can be readily detected”) by the judges when they were presented with 50, 20, 10, 1, and 0.1 mg/mL solutions
Aroma perception was evaluated by the following 13 descriptors, consisting of contrasting pairs of adjectives: fresh-stale, soothing-activating, airy-heavy, plain-rich, natural-unnatural, elegant-unrefined, soft-strong, pleasant-un- pleasant, warm-cool, comfortable-uncomfortable, woodsy-not woodsy, floral-peppery, and lively-dull. The Uchida-Kraepelin test was used as the mental arithmetic task; the auditory task involved listening to environmental (natural) sounds; and the physical task consists of going up and down a step. In the Uchida-Kraepelin test, the subjects are provided with adjacent rows of numbers (100 numbers per row) and perform simple additions using numbers within a row. The subjects are allocated 40 s before changing to the next row (the test lasts for 5 min). For the auditory task (duration of 5 min), the subjects are seated and subjected to natural sounds such as bird songs and the murmuring of a small stream using a compact disc player. For the physical task, the subjects are requested to step up and down a 20-cm step at a rate of 30 times per min for 5 min. The sensory questionnaire assessment was conducted before and after the task. The 13 descriptors were scored on an 11-point scale (−5 to +5). The difference between the pre- and post-task scores (post-task scores minus pre-task scores) for each of the descriptors was evaluated by the t-test. The mean difference in the score of each descriptor was plotted against the 13 descriptors, generating the sensory evaluation spectrum.
Typical examples are shown in Figure 7, in which the differential discrimination between the enantiomers of linalool is demonstrated as a function of the behavioral task assigned (mental arithmetic and auditory). For each spectrograph in Figure 7, descriptors regarded as significant by the t-test with a positive value and shown above the horizontal axis suggest a positive (or favorable) correlation between the fragrance of a given aroma and the type of task from the viewpoints of “fresh,” “airy,” “elegant,” “pleasant,” “comfortable,” and the other setting descriptors. In contrast, descriptors with negative values appearing below the axis suggests anunfavorable (negative) correlation between the fragrance and the type of task in terms of “stale,” “heavy,” “unrefined,” “unpleasant,” “uncomfortable,” and the other setting descriptors. As observed, inhalation of (R)-(−)-linalool while listening to environmental (natural) sounds seemed to produce a favorable impression in the sensory (verbal) tests, and this feature was comparable to the corresponding spectrum of (R,S)-(±)-linalool but not with that of (S)-(+)-linalool. In contrast, inhalation of (R)-(−)-linalool associated with a mental arithmetic task showed an unfavorable sensory feature, similarly to results obtained with (S)-(+)-linalool and (R,S)-(±)-linalool. The resulting total significance scores were as follows: 7.0 for (R)-(−)-linalool, 4.0 for (S)-(+)-linalool, and 6.5 for (R,S)-(±)-linalool in the presence of the auditory task; and 4.5 for (R)-(−)-linalool, 3.5 for (S)-(+)-linalool, and 4.0 for (R,S)-(±)- linalool in the presence of the mental arithmetic task. These values demonstrate that none of the spectra shown in Figure 7 reached statistical significance because the total significance scores were all £10. However, based on these findings and the fact that Ohloff and Klein (1962) suggested that (+)- and (−)-linalool have a petitgrain- like scent and a lavender-like scent, respectively, it is interesting to speculate that the different enantiomers of linalool may evoke distinct odor perception according to the task undertaken.
Likewise, among the 72 case studies, no sensory spectra with total significance scores of >10 were obtained, as clearly shown in Table 2, based on the statistical analysis on verbal (semantic) responses to the odorant of the 21 essential oils, and linalool and its enantiomeric isomers studied. This is because of the large deviation of both the pre- and post-task descriptor scores (Sugawara et al., 1999, 2009a).
5. Discussion
The above sections detailed our semantic research achievements over the past decade, focusing on methodological attempts for substantiating the measure as a descriptive sensory analysis. Two types of studies that deserve emphasis were conducted. In the first study, we assessed the performance of the photo catalytic elimination of stains or bio-aerosols in air using TiO2 as well as the photo catalytic deodorizing efficacy of a TiO2-type deodorizer. In the second study, we evaluated the differential discrimination between perceived odor quality of a given aroma within a group of fragrances constituting essential oils, and linalool and its enantiomers.
As mentioned earlier, sensory analysis comprises a variety of tools and tests that can be used for subjective or objective evaluation of sensory properties. Among these, the descriptive sensory analysis employs a group of trained individuals (generally 6 - 12) to identify and quantify specific sensory attributes (Drake, 2004, 2007;

Figure 7. Sensory spectra of enantiomers of linalool ((R,S)-(±)-, (R)-(−)-, and (S)-(+)-forms) as a function of behavioral task. Reproduced from Sugawara et al., 2013. (a) (R,S)-(±)-linalool, (b) (R)-(−)-linalool, and (c) (S)-(+)-linalool when the participants were subjected to a mental arithmetic task, and (d) (R,S)-(±)-linalool, (e) (R)-(−)-linalool, and (f) (S)-(+)-linalool when the participants were subjected to an auditory task. The concentration of each enantiomer was 20 mg/mL (in diethyl phthalate), and 200 μL of each enantiomer solution was loaded and moistened in an inhalator (300 mL). The number of subjects was (a) 18, (b) 23, (c) 26, (d) 21, (e) 24, and (f) 23.
Lawless & Heymann, 1988; Meilgaard et al., 1999). In contrast, our sensory analysis involved untrained individuals as panelists, resulting in variations in e.g., interest in sensory target, sensitivity to stimuli, and susceptibility to fatigue. This was evident from our questionnaire, whereby the standard deviation of the responses was remarkably large when compared with the value of the mean for the 13 descriptors studied (Figure 2). Regardless, Figure 1 and Figures 3-5 demonstrate that the obtained sensory spectra represent specific sensory attri- butes.
The target sensory property in Figure 1 was related to determining the efficacy of the photocatalytic elimination of stains or bio-aerosols in air using TiO2; the participants impressions were recorded on an 11-point scale using 13 contrasting pairs of adjectives. The inquiry assessment was conducted in two steps that involved a TiO2-coated door and an uncoated door. The mean of the impression difference between the scores of the first inquiry for the TiO2-coated door and the second inquiry for the uncoated door was plotted against the descriptors. The resulting bar graph (sensory evaluation spectrum) showed an upward trend with a positive value against the descriptors. This suggests that the results of the investigation involving the coated door were superior to those of the study involving the uncoated door as a function of the 13 setting semantic variables examined.
Likewise, the results in Figures 3-5 were obtained from the sensory tests that were used to evaluate the photocatalytic deodorizing performance of a TiO2-type deodorizer before and after setting the deodorant in the participants’ respective home refrigerators using the impression of smell within the refrigerator as the indicator. In each experimental run, the assessment (composed of 13 contrasting adjective pairs) was conducted in three steps: 1) prior to the introduction of the deodorant in the refrigerator; 2) following storage of the deodorant in the refrigerator for 1 week; and 3) 1 week following removal of the deodorant from the refrigerator. The scores obtained from the first step assessment were subtracted from those obtained from the second step assessment, and the scores from the second step assessment were subtracted from those of the third step assessment. Thus, for each run, two functional sensory spectra were obtained: one spectrum representing the change in perception after installation of the deodorant and the other spectrum representing the change after removal of the deodorant. The first spectrum showed a positive effect on the perception of smell in the refrigerator, as consistent with the removal of odors by the deodorizer. The second spectrum showed a negative effect in perception, indicating that the odors were intensified upon removal of the deodorizer. Even though the standard deviation was large when compared with the mean (Figure 2), both functional spectra were significant (p < 0.05), as indicated by the total significance scores that were greater than 10 (Figure 3).
Additionally, Figure 4 and Figure 5 demonstrate that our sensory evaluation spectrum method displayed satisfactory-to-good agreement in reproducibility and consistency both in terms of the shape and the total significance scores of the spectrographs. Moreover, based on the outcomes shown in Figure 5, the total significance scores (i.e., the sum of the statistical scores of each descriptor in a given sensory evaluation spectrum: 1.0 for items denoted with *; 0.5 for items denoted with ±; 0.0 for items that are unmarked) were plotted against the number of panelists (n = 5 - 32), Figure 6, to emphasize that the number of panelists required is similar to that required in conventional descriptive sensory analyses. The traditional analyses involve groups of trained individuals (generally 6 - 12) to identify and quantify specific sensory attributes to afford reproducibility and consistency.
The results of the latter study that examined the application of the measure to assess the differential discrimination of perceived odor quality of a given aroma, as shown in Figure 7 and Table 2, differ considerably from the results obtained from the former study using TiO2. No sensory spectra with a total significance score of >10 among the 72 case studies listed in the Table 2 were obtained.
Hence, a multi-channel skin thermometer measurement study was conducted to detect possible physiological changes that may complement the sensory evaluation spectra (Figure 8). This was performed because emotional excitement or apprehension is known to induce a slight increase in the human skin temperature (Elam & Wallin, 1987; Oka et al., 2001; 2008; Yamakoshi et al., 2007; Ziegler & Cash, 1938). Because the perception and response to odors are intimately related to both emotional expression and genesis of emotion, skin temperature changes can serve as an effective indicator to establish the relationship between odor and its emotional and physiological effects in humans. The details of our multi-channel skin thermometer measurement study can be obtained in the following publications: Flavour and Fragrance Journal (Sugawara et al., 2006), International Journal of Essential Oil Therapeutics (Sugawara et al., 2008), and Molecules (Sugawara et al., 2013).
Although changes in the skin temperature, owing to emotional stress, have been demonstrated by several authors (Elam & Wallin, 1987; Oka et al., 2001; 2008; Yamakoshi et al., 2007; Ziegler & Cash, 1938), the mechanisms by which odorants induce such changes are unknown. Regardless, our findings showed that the essential oils could be classified into two groups: those that respectively caused an increase or decrease in the fingertip skin temperature (Figure 8). If feelings of excitement or apprehension induce slight increases in the skin temperature (Elam & Wallin, 1987; Oka et al., 2001; 2008; Yamakoshi et al., 2007; Ziegler & Cash, 1938), it is reasonable to assume that essential oils can be regarded as having either distressing/agitating properties (associated with increases in the skin temperature) or relaxing/sedating properties (associated with decreases in the skin temperature).
Accordingly, as clearly seen in Figure 8, the spectra reflect subtle aspects of olfactory discrimination, and when the perception of odorants is tested under different behavioral conditions, the resulting spectra also illustrate fine nuances of psychophysiological expressions. Among the case studies, for instance, both behavioral tasks in combination with the inhalation of ylang ylang were accompanied by relaxation/sedation (skin temperature decrease), however, they showed contrasting sensory evaluation spectra (Figure 8).
In regard to the study of ylang ylang, an intriguing observation was made by Hongratanaworakit and Buchbauer in 2004 and 2006 (Hongratanaworakit & Buchbauer, 2004, 2006). In their first study (Hongratanaworakit & Buchbauer, 2004), the authors demonstrated that the effect of inhalation of ylang ylang could be characterized as

Figure 8. Illustration of the methodology employed to avoid drawbacks (i.e., when statistical significance of a spectra is not achieved) encountered upon application of the sensory evaluation spectrum method to assess the differential discrimination of perceived odor quality of a given aroma. Reproduced from Sugawara et al., 2013. A multi-channel skin thermometer measurement study is employed to detect possible physiological changes that may complement the sensory evaluation spectra. The number of subjects used for the different fragrances in association with a mental arithmetic task case studies was 18 for peppermint, 17 for spearmint, 20 for linalool, and 18 for ylang ylang, The number of subjects used for the different fragrances in association with an auditory task case studies was 20 for peppermint, 18 for spearmint, 20 for linalool, and 20 for ylang ylang.
harmonizing rather than relaxing/sedating. The authors also reported that inhalation of ylang ylang led to a decrease in blood pressure and pulse rate, however, increased subjective attention and alertness. Thus, the concept of “harmonization” is consistent with otherwise contradictory psychophysiological outcomes. In their subsequent report (Hongratanaworakit & Buchbauer, 2006), the authors reported that transdermal absorption of ylang ylang caused a decrease in blood pressure and an increase in subjective calmness and relaxation compared with the control experiment. Based on these findings, the authors suggested that ylang ylang has a relaxing/sedating effect under transdermal absorption.
Based on this viewpoint, our findings appeared to show that ylang ylang had a relaxing/sedating effect using physiological and psychological measures combined with the auditory task (Figure 8). However, the effect of ylang ylang was in good agreement with the concept of “harmonization” when the mental arithmetic task was used (Figure 8). Here, we attempt to expand the definition of harmonization to include the conditions from our study. This would allow understanding of the finer nuances of the contradictory changes observed for the two tasks. Using the graphs obtained for ylang ylang for the two tasks as a reference, we identified other odorants with similar properties (Figure 8). We found that peppermint and spearmint essential oils and linalool could be categorized as exerting “harmonization” effects based on the task-dependent sensory spectra and skin temperature changes. A small exception was observed for the linalool-mental arithmetic task data, whereby the subjects experienced a small increase in fingertip skin temperature (within the measurement error) rather than a decrease. The sensory spectra for purified linalool (Figure 7(a), Figure 7(d)) showed similar task dependence of perception to that of the commercial linalool as shown in Figure 8. The total significance score of purified linalool was 4.0 for the mental arithmetic task (Figure 7(a)) and 6.5 for the auditory task (Figure 7(d)). This was also in good agreement with the scores obtained using commercial linalool shown in Figure 8, and were 5.5 for the mental arithmetic task and 5.0 for the auditory task.
As observed in Figure 7, using (R,S)-(±)-linalool as reference (purification of commercial linalool generated (R,S)-(±)-linalool, identified as a racemic mixture of the (R)-form (50.9%) and (S)-form (49.1%) with [α]D = 0˚), the spectra obtained after performing the mental arithmetic task (Figures 7(a)-(c), left hand side) showed negative values. This indicated that the perceived odor quality of (R)-(−)- and (S)-(+)-linalools and the racemic mixture of the (R)- and (S)-forms was less favorable after task completion. In contrast, following completion of the auditory task (Figures 7(d)-(f), right hand side), the spectra showed mostly positive values. Furthermore, closer examination of the spectra obtained following the auditory task revealed that the sensory spectrum of (R)-(−)-linalool was identical to that of the reference (R,S)-(±)-linalool, rather than that of (S)-(+)-linalool, of which half of the significant descriptors were positive and the other half negative. Taking into account that Ohloff and Klein (1962) suggested that (+)- and (−)-linalool respectively have petitgrain-like and lavender-like scents, these findings demonstrated that the enantiomeric isomers of linalool could be regarded as significantly different odors in accordance with the type of enantiomer and on the task assigned to the subjects.
In terms of the verbal (sensory evaluation spectrum) and non-verbal (skin temperature changes) responses following inhalation of fragrances of essential oils, and linalool and its enantiomers as a function of behavioral task, we are currently examining task-dependent psychophysiological responses to odors. These studies will potentially contribute to the research fields on the assessment of psychological and physiological effects of essential oils and the study of human chemoreception to further understand the working principles of the highly sophisticated olfactory system. Although sensory perception and physiological endpoints are rarely recorded within the same study, this approach has the potential to be highly informative.
The unique features at the entrance of the olfactory system have been extensively studied and documented accordingly (Axel, 1995; Buck, 1996; Buck & Axel, 1991; Li et al., 2008; Mombaerts, 1999; Yoshida & Mori, 2007; Zhang & Firestein, 2002), however, little is known about processes operating upstream. Thus, further work is required to characterize the framework for the discrimination of odorous molecules beyond entrance of the olfactory system. Such information may provide clues to the following long-standing issues. How does the brain ultimately identify more than 10 000 odorants? How does the perception of odors associate with pleasant or unpleasant emotions? How does the brain instigate the range of emotional or behavioral responses that smells often provoke? To what extent is behavior or mood influenced by the perception of odors?
6. Conclusion
1) This paper presents an overview of our verbal (semantic) research achievements over the past decade, focusing on methodological attempts for substantiating the measure as a descriptive sensory analysis.
2) Two types of studies are presented herein: a) the assessment of the efficacy of the photo catalytic elimination of stains or bio-aerosols in air using TiO2 and the photo catalytic deodorizing properties of a TiO2-type deodorizer; and b) the evaluation of the differential discrimination of perceived odor quality of a given aroma within a group of fragrances constituting essential oils, and linalool and its enantiomers.
3) In the former first study, the target sensory property was to determine the efficacy of the photo catalytic elimination of stains or bio-aerosols in air using TiO2. The participants’ impressions were recorded on an 11-point scale using 13 contrasting pairs of adjectives. The assessment was conducted in two steps, involving a TiO2-coated door and an uncoated door. The mean of the impression difference between the scores obtained from the first and the second assessments was plotted against the descriptors. The resulting bar graph (sensory evaluation spectrum) showed an upward trend with a positive value against the descriptors. This suggests that the results of the assessment involving the coated door were superior to those of the assessment involving the uncoated door as a function of the 13 setting semantic variables.
4) In the former second study, we examined the deodorizing efficacy of a TiO2-type deodorizer using the impression of refrigerator odors as an indicator when a TiO2-type deodorizer was setting in the participants’ respective home refrigerators. The results showed that a pair of sensory spectra could represent a functional aspect of the deodorizing efficacy of the photo catalytic deodorant: a spectrum relating to the installation of deodorant in the refrigerator and another spectrum relating to the removal of the deodorant. Based on the findings, we tried to determine the statistical significance of the resulting sensory spectrum across variations in the spectrograph based on the number of impression descriptors regarded as statistically significant among the 13 descriptors studied; and the number of panelists (individuals) required to identify and quantify specific sensory attributes employing untrained (inexperienced) individuals as panelists.
5) The second study is related to the application of the current sensory evaluation method and associated measures adopted to overcome statistical defects when no spectra reached statistical significance. A multi-channel skin thermometer measurement study was conducted to detect possible physiological changes that may complement the sensory evaluation spectra. In terms of the verbal (sensory evaluation spectrum) and non- verbal (skin temperature changes) responses following inhalation of fragrances of essential oils, and linalool and its enantiomers as a function of behavioral task, we are presently examining task-dependent psychophysiological responses to odors. This study will potentially contribute not only to the assessment of psychological and physiological effects of essential oils, but also the investigation of human chemoreception to further understand the working principles of the sophisticated olfactory system.
References
- Coombs,
- Drake,
- Drake,
- Elam, M., & Wallin,
- Fox,
- Firestein, S. (1991). A Noseful of Odor Receptors. Trends in Neurosciences, 14, 270-272. http://dx.doi.org/10.1016/0166-2236(91)90135-H
- Glaze, W. H. (1986). Reaction Products of Ozone: A Review. Environmental Health Perspectives, 69, 151-157. http://dx.doi.org/10.1289/ehp.8669151
- Guilford,
- Hongratanaworakit, T., & Buchbauer, G. (2004). Evaluation of the Harmonizing Effect of Ylang-Ylang Oil on Humans after Inhalation.
- Hongratanaworakit, T., & Buchbauer, G. (2006). Relaxing Effect of Ylang Ylang Oil on Humans after Transdermal Absorption. Phytotherapy Research, 20, 758-763. http://dx.doi.org/10.1002/ptr.1950
- Kling,
- Lawless,
- Leitereg,
- Li, W.,
- Linkert, R. (1932). A Technique for the Measurement of Attitudes. Archives of Psychology, 140, 44-53.
- Maness, P., Smolinski, S.,
- Matsunaga, T., Tomoda, R., Nakajima, T., & Wake, H. (1985). Photoelectrochemical Sterilization of Microbial Cells by Semiconductor Powders. FEMS Microbiology Letters, 29, 211-214. http://dx.doi.org/10.1111/j.1574-6968.1985.tb00864.x
- Matsunaga, T., Tomoda, R., Nakajima, T., Nakamura, N., & Komine, T. (1988). Continuous-Sterilization System That Uses Photo Semiconductor Powders. Applied and Environmental Microbiology, 54, 1330-1333.
- Meilgaard,
- Mills, A.,
- Mombaerts, P. (1999). Molecular Biology of Odorant Receptors in Vertebrates. Annual Review of Neuroscience, 22, 487-509. http://dx.doi.org/10.1146/annurev.neuro.22.1.487
- Ohloff, G., &
- Oka, T., Oka, K., & Hori, T. (2001). Mechanisms and Mediators of Psychological Stress-Induced Rise in Core Temperature. Psychosomatic Medicine, 63, 476-486. http://dx.doi.org/10.1097/00006842-200105000-00018
- Oka, T., Hayashida, S., Kaneda, Y., Takenaga, M., Tamagawa, Y., Tsuji, S., & Hatanaka, A. (2008). Green Odor Attenuates a Cold Pressor Test-Induced Cardiovascular Response in Healthy Adults. BioPsychoSocial Medicine, 2, 2. http://dx.doi.org/10.1186/1751-0759-2-2
- Pecchi, G.,
- Roderick,
- Satoh, T., & Sugawara, Y. (2003). Effects on Humans Elicited by Inhaling the Fragrance of Essential Oils: Sensory Test, Multi-Channel Thermometric Study and Forehead Surface Potential Wave Measurement on
- Sugawara, Y. (2001). Odor Distinctiveness between Enantiomers of Linalool. Current Topics in Analytical Chemistry, 2, 201-210.
- Sugawara, Y., Hara, C., Tamura, K., Fujii, T., Nakamura, K., Masujima, T., & Aoki, T. (
- Sugawara, Y., Tomota, T., & Tamura, K. (1998b). Perceived Fragrance of Essential Oils in Relation to Type of Work. Journal of Home Economics of Japan, 49, 1281-1290.
- Sugawara, Y., Hino, Y., Kawasaki, M., Hara, C., Tamura, K., Sugimoto, N., Yamanishi, U., Miyauchi, M., Masujima, T., & Aoki, T. (1999). Alteration of Perceived Fragrance of Essential Oils in Relation to Type of Work: A Simple Screening Test for Efficacy of Aroma. Chemical Senses, 24, 415-421. http://dx.doi.org/10.1093/chemse/24.4.415
- Sugawara, Y., Hara, C., Aoki, T., Sugimoto, N., & Masujima, T. (2000). Odor Distinctiveness between Enantiomers of Linalool: Difference in Perception and Responses Elicited by Sensory Test and Forehead Surface Potential Wave. Chemical Senses, 25, 77-84. http://dx.doi.org/10.1093/chemse/25.1.77
- Sugawara, Y., Nishimoto, M., Kobayashi, Y., Hasegawa, R., Okimoto, A., & Aoki, T. (2003). Repeatability of the Measure Required for Perceptional Changes of the Fragrance of Essential Oils Was Tested in Terms of Sensory Evaluation Spectrums. Bull.Fac. Human Life Environ. Sci. Hiroshima Women’s Univ., 9, 21-36.
- Sugawara, Y.,
- Sugawara, Y., Maruyama, S., Nakagawa, N., Yamada, E., Seto, M., Sumihiro, S., Aoi, N., Nishimoto, M., Kobayashi, Y., & Hirano, M. (2008). Verbal and Non-Verbal Responses to Odorants in Humans While Inhaling the Fragrance of Peppermint and Spearmint Essential Oils and Linalool. International Journal of Essential Oil Therapeutics, 2, 111-121.
- Sugawara, Y., Sugimoto, C., Minabe, S., Iura, Y., Okazaki, M., Nakagawa, N., Seto, M., Maruyama, S., Hirano, M., & Kitayama, I. (
- Sugawara, Y., Sugimoto, C., & Minabe, S. (2009b). Sensory Evaluation of the Deodorizing Efficacy of a Titanium Oxide- Type Deodorant. Journal of Home Economics of Japan, 60, 353-362.
- Sugawara, Y., Shigetho, A., Yoneda, M., Tuchiya, T., Matumura, T., & Hirano, M. (2013). Relationship between Mood Change, Odour and Its Physiological Effects in Humans While Inhaling the Fragrances of Essential Oils as Well as Linalool and Its Enantiomers. Molecules, 18, 3312-3338. http://dx.doi.org/10.3390/molecules18033312
- Torgerson,
- Watanabe, N., Horikoshi, S.,
- Yamakoshi, T., Yamakoshi, K.,
- Yoshida, I., & Mori, K. (2007). Odorant Category Profile Selectivity of Olfactory Cortex Neurons. The Journal of Neuroscience, 27, 9105-9114. http://dx.doi.org/10.1523/JNEUROSCI.2720-07.2007
- Zhang, X., & Firestein, S. (2002). The Olfactory Receptor
- Zhang, A., & Sun, Y. (2004). Photocatalytic Killing Effect of TiO2 Nanoparticles on Ls-174-Thuman Colon Carcinoma Cells. World Journal of Gastroenterology, 10, 3191-3193.