Journal of Environmental Protection
Vol.06 No.11(2015), Article ID:61044,22 pages
10.4236/jep.2015.611107
Assessing Cleaner Energy Alternatives for Bus Transit in Rio de Janeiro: A Life Cycle Inventory Analysis
Márcio de Almeida D’Agosto1*, Cintia Machado de Oliveira1,2, Fabiana do Couto Assumpção1, Ana Carolina Peixoto Deveza1
1Programa de Engenharia de Transportes, Instituto Alberto Luiz Coimbra de Pós-Graduação e Pesquisa em Engenharia (COPPE), Universidade Federal do Rio de Janeiro, Rio de Janeiro, Brazil
2Centro Federal de Educação Tecnológica Celso Suckow da Fonseca, Engenharia Industrial Mecânica, Uned, Itaguaí, Brazil

Copyright © 2015 by authors and Scientific Research Publishing Inc.
This work is licensed under the Creative Commons Attribution International License (CC BY).


Received 28 July 2015; accepted 9 November 2015; published 12 November 2015

ABSTRACT
From 2003 to 2009 in Brazilian municipalities of over 60,000 inhabitants, buses accounted for more than 25% of urban trips. This trend is not expected to change in the medium term. Worldwide, buses rely on petroleum diesel as fuel. In Brazil, alternative fuels such as biodiesel, natural gas and ethanol are available and the choice among them should depend on the assessment of the entire life cycle of such fuels. This paper uses a Life Cycle Inventory, which is essential to the implementation of a Life Cycle Assessment, to assess six energy alternatives: petroleum diesel, biodiesel, petroleum diesel with 5% of biodiesel, compressed natural gas, additivated hydrous ethanol and dual-fuel system composed by petroleum diesel with 5% of biodiesel and compressed natural gas. In saving total energy consumption, pure petroleum diesel or mixed with 5% biodiesel and dual-fuel systems stand out, in that order. If renewable energy use and net carbon dioxide emissions reduction are the goals, ethanol and biodiesel should be given preference. The addition of 5% of biodiesel in petroleum diesel increases the share of renewable energy in the supply chain of petroleum diesel by 47.5% with an increase of 0.58% in total energy consumption and a reduction of 3.8% in net CO2 emissions during the life cycle. In the case of biodiesel, the addition of 5% of biodiesel in petroleum diesel increases the share of renewable energy in the supply chain by 51.15% with an increase of 0.03% in the total energy consumption and a decrease of 7% in net CO2 emissions in the life cycle. The use of 5% of biodiesel in petroleum diesel does not significantly affect the use of renewable energy (+0.69%) or total energy consumption (+0.04%) in ethanol supply chain, which already shows a great use of renewable energy input. However, a decrease of 9.29% in the net CO2 emissions in the supply chain occurs, which reaches 5.28% in the life cycle.
Keywords:
Renewable Energy, Total Energy, Public Transportation, Biofuels, Life Cycle

1. Introduction
Brazilian transportation sector accounted for 28% of the country’s total energy consumption in 2009. Road transportation represented 92%, of which 76.3% was petroleum fuels (diesel and gasoline). However, keeping the trend for the past 10 years, 20.5% comprised biofuels (ethanol and biodiesel) and natural gas (3.2%) (EPE, 2010) [1] .
In 2009, nearly 87% of passenger commutes by collective modes in Brazil occurred by the use of standard petroleum diesel powered buses, which were responsible for the emission of 27.8 million t of CO2 (D’Agosto et al., 2013) [2] .
In 2008, the Brazilian government mandated the addition of biodiesel to the petroleum diesel sold in Brazil reaching 5% in January 2010. Furthermore, alternative to diesel technologies allow the use of natural gas in Brazilian buses, dedicatedly or in conjunction with petroleum diesel, and additivated hydrous ethanol (D’Agosto, et al., 2013) [2] .
The public’s growing awareness of sustainable development points to the study of energy alternatives using Life Cycle Assessment (LCA), a technique that considers inputs and environmental impacts throughout the life cycle of these alternatives.
A Life Cycle Inventory (LCI) is a part of the LCA that is essential to its implementation. This study applies a LCI procedure (D’Agosto and Ribeiro, 2009) [3] to analyze the total energy consumption, renewable energy use and net CO2 emissions of six energy alternatives for bus transit in the municipality of Rio de Janeiro. 1) D100-PSD100, petroleum diesel (D100) in a conventional propulsion system (PSD100); 2) CNG-PSCNG, compressed natural gas (CNG) in a dedicated propulsion system (PSCNG); 3) B5-PSB5, a mixture of 95% petroleum diesel and 5% soybean biodiesel (B5) in a conventional propulsion system (PSB5); 4) B5CNG-PSDG, B5 and CNG in a diesel-gas propulsion system (PSDG); 5) B100-PSB100, soybean biodiesel (B100) in a conventional propulsion system (PSB100); and 6) E95-PSE95, additivated hydrous ethanol (E95) in a dedicated propulsion system (PSE95).
The study has the following objectives: 1) to identify the advantages of renewable (B100-PSB100, E95- PSE95) or cleaner (CNG-PSCNG) fuels compared with D100-PSD100; 2) to evaluate the use of B5 in D100- PSD100, B100-PSB100 and E95-PSE95; and 3) to understand how the use of CNG can be enhanced with the diesel-gas system.
The relevant data were collected, including a database with 10 years of energy-consumption results on the life cycle of Brazilian fossil fuels (natural gas and D100) (D’Agosto and Ribeiro, 2009) [3] and the results of Brazilian recent experiments using B100, E95 and PSDG (D’Agosto et al. 2013) [2] .
In Section 2, the LCI procedure is briefly described. Section 3 presents the LCI assessment and its results. This section is subdivided according to the four phases that compose the LCI procedure (Figure 1). Section 4 offers conclusions. The figures and tables are complementary. Therefore, their interpretation should be made simultaneously.
2. The LCI Procedure
The LCI procedure (Figure 1) considers four phases to analyze the inputs and environmental burdens on the life cycle of fuel for transportation. Phase 1: Objective and scope is subdivided into two steps: Extent and Dimensions. Phase 2 Inventory analysis presents data for the alternative’s supply chains and end use phases. Phase 3 shows the data evaluation and Phase 4 has the comparison of results and discussion for total energy consumption, renewable energy use and net CO2 emissions.
Starting with a definition of the study’s objective and scope, fuel alternatives formed of energy sources (ES) paired with propulsion systems (PS) are identified. They meet the geographic, temporal and technological constraints and, when combined with the study dimensions, create life cycle models (LCM) that are the base for the LCI. In the LCM, the collected data comprise the life cycle matrices [F] with the representative flows of inputs

Figure 1. Life Cycle Inventory procedure.
and environmental burdens. After the evaluation, [F] will constitute [F’], the matrices of consistent flows, which will be compared to each other to highlight the best alternative. In the following, the results are reported.
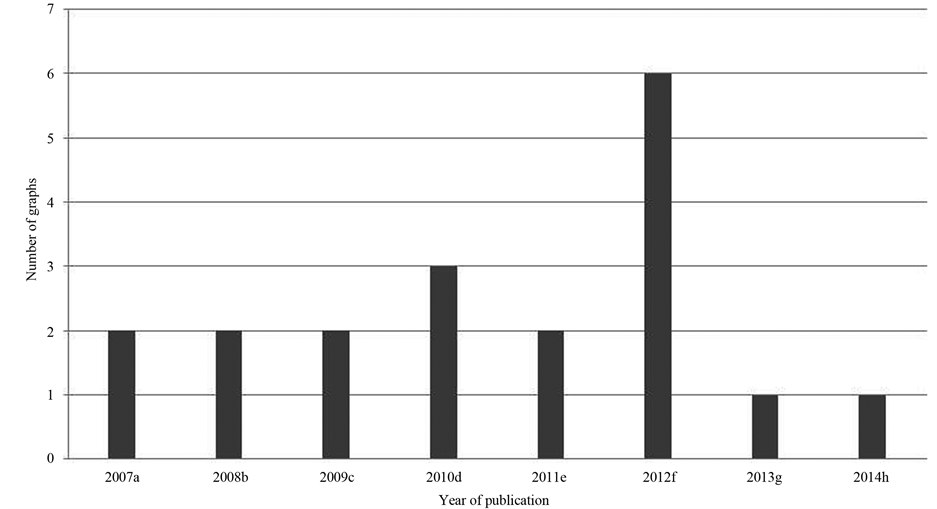
Although recent research in LCA for transportation energy sources has evolved in depth, as it is possible to see in Figure 2, D’Agosto and Ribeiro, (2009) [3] contribution to LCI for energy sources for transportation keeps its importance as far as it considers a particular modular structure for preparing the LCMs with three depth levels, in the form of macro-stages, mid-stages and micro-stages, permitting successive refinements and guaranteeing the equivalence among the levels. The procedure also takes into consideration the energy source distribution stage in deep and functional units that are transportation specific ones what makes possible comparison among alternatives.
3. LCI Procedure’s Application to the Municipality of Rio de Janeiro’s Bus Transit
Figure 1 summarizes the procedure’s application. Additional considerations shall be presented when necessary.
3.1. Phase 1: Objective and Scope
To evaluate the energy alternatives (purpose), they were applied to buses (application) as a function of passenger movement, deriving the functional unit of 1 passenger km (pass・km).
3.1.1. Phase 1, Step 1: Extent
The municipality of Rio de Janeiro was adopted as the geographic area to be covered. The energy sources and propulsion system alternatives were selected according to their market availability, legal and technological feasibility and data availability in 2009 and 2010. Table 1 shows the result of Phase 1-Step 1, which are justified as follows.
In the municipality of Rio de Janeiro, since 1968, the percentage of public transportation passengers traveling by bus surpassed 60%. In 2003, the last year in which this type of data was consistently collected (SMTr, 2006) [23] , the figure was 68%. Except for localized interventions that sought to improve rail and road integration (electronic tickets and unified fares), nothing was observed that could justify the change in this percentage. In 2010, 51% of the municipality’s bus fleet was composed of Type I urban buses (Souza et al., 2013) [24] .
 Notes:(a) Beer and Gant (2007) [4] ; Blottnitz and Curran (2007) [5] ;(b) Leng et al. (2008) [6] ;(c) Kendall and Chang (2009) [7] ; Yan and Crookes (2009) [8] , Luo et al. (2009) [9] ; Nanaki, and Koroneos (2009) [10](d) Ometto and Roma (2010) [11] ; Nguyen et al. (2010) [12] ; Morais et al. (2010) [13] ;(e) Khatiwada and Silveira (2011) [14] ; Hou et al. (2011) [15] ;(f) Moriizumi et al. (2012) [16] ; Iglesias et al. (2012) [17] ; Silalertruksa et al. (2012) [18] ; Jørgensen et al. (2012) [19] ; Kochaphum et al. (2012) [20] ;(g) Gil et al. (2013) [21] ;(h) Rajaeifar et al. (2014) [22]
Figure 2. Evolution of recent research in LCA for transportation energy sources.
Due to the plentiful availability of natural gas in the state of Rio de Janeiro, in 2010, 25% of the state’s cars and light duty vehicles fleet used CNG (Souza et al., 2013) [24] . However, the use of natural gas in buses has not been established. The state government desires to adopt CNG as a partial substitute for B5, which may be used dedicated (CNG) or as a dual-fuel (CNG+B5) (D’Agosto et al., 2013) [2] . The PSDG allows flexibility in fuel choice (CNG or B5), eliminating dependence on a fuel that is difficult to store and prone to shortages (CNG) and ensuring the vehicle’s autonomy and allowing an eventual second life in a location that is not supplied with CNG.
Because biodiesel is renewable and miscible with D100, the Brazilian government desires to expand biodiesel’s use. In 2010, the quantity of biodiesel added to D100 reached 5% and recent tests results indicated the possibility of adopting B100 in market segments where the product is available at an attractive price compared with B5 (D’Agosto et al., 2013) [2] .
Due to ethanol’s availability in Brazil and the fuel’s widespread use in cars and light duty vehicles, buses powered by E95 have been tested since 2008 and it represents a new energy alternative for bus transit (D’Agosto at al., 2013; [2] Jansen et al., 2010 [25] ).
3.1.2. Phase 1, Step 2: Dimensions
Figure 3-5 present the life cycle models. The life cycle is composed of 5 mid-stages: raw material production, raw material transportation, energy source production, energy source distribution and end use.
For each micro-stage, the total energy flow, renewable energy and net CO2 emissions are considered. For biofuels (ethanol and biodiesel), these life cycle models are generally comparable to the works of Leng et al. (2008) [6] , Kendall and Chang (2009) [7] , Ometto and Roma (2010) [11] and Tsoutsos et al. (2010) [26] although they don’t take into consideration the energy source distribution stage in deep and their functional units are not transportation specific ones as it is in the present article.

Table 1.Characterization of altematives.

Figure 3. Life Cycle Model for the primarily fossil alternatives: D100-PSD100, CNG-PSCNG, B5CNG-PSDG and B5- PSB5.
 Notes―(1): Energy embodied in seedlings = 96.06 MJ/tsb; fertilizers = 435.84 MJ/tsb; lime = 137.51 MJ/tsb; herbicides = 353.22 MJ/tsb and insecticides = 29.78. MJ/tsb; (2): Diesel for transporting seedlings, organic and chemical fertilizers equal 51.79 MJ/tsb (Sheehan et al. 1998) [32]
Figure 4. Life Cycle Model for soybean biodiesel: B100-PSB10.
 Notes―(1): Energy embodied in seedlings = 5.87 MJ/tc; fertilizers = 66.49 MJ/tc; lime = 7.14 MJ/tc; herbicides = 11.26 MJ/tc and insecticides = 0.79 MJ/tc. (D’Agosto and Ribeiro, 2009) [3] ; (2): Diesel for transporting seedlings, organic and chemical fertilizers equal 8.20.8 MJ/tc (D’Agosto and Ribeiro, 2009) [3] ; (3) ED95 is made of 89% hydrated ethanol and 11% lubricant and explosive aditive - mass/mass (Jansen et al, 2010) [25]
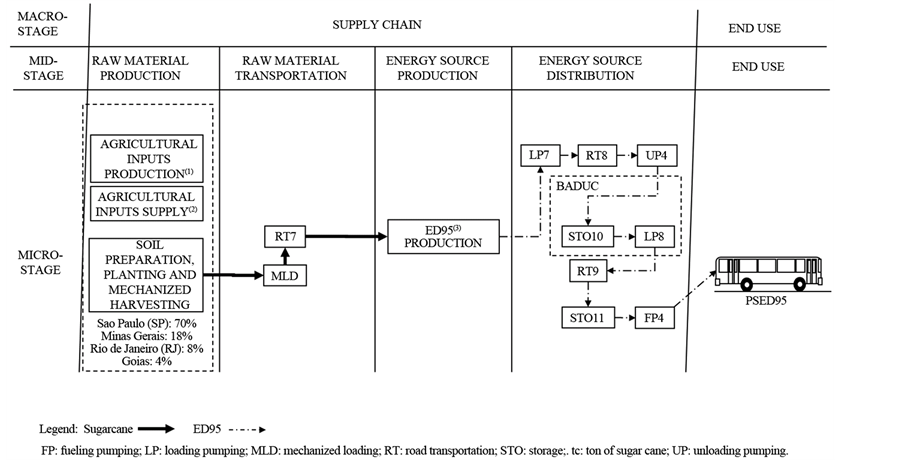
Figure 5.Life Cycle Model for additivated hydrous ethanol: E95-PSE95.
Life Cycle Model for the primarily fossil alternatives: D100-PSD100, CNG-PSCNG, B5CNG-PSDG and B5-PSB5
Because sales of petroleum fuels in the state of Rio de Janeiro represent 56% of the oil processed at the Duque de Caxias Refinery (REDUC), it is assumed that all of the municipality of Rio de Janeiro’s D100 originates from REDUC (ANP, 2010a) [27] .
Onshore oilfields of the Middle East provide 42% of the municipality of Rio de Janeiro’s processed petroleum. The remainder comes from offshore oilfields located on the coast of the state of Rio de Janeiro (D’Agosto and Ribeiro, 2009) [3] .
It is assumed that the maritime transportation distance for imported petroleum is 8,746 ± 262 nmi (Dobson and Beresford, 1989) [28] in ships of 300,000 DWT, the well-to-terminal transport distance in the Middle East is 145 ± 15 km in pipelines, and the terminal-to-refinery transport distance in Brazil is 125 km by pipeline. The well-to-refinery transport of domestic petroleum is conducted exclusively by pipeline (334 km). In the domestic terminals, the petroleum is kept warm for pumping (D’Agosto and Ribeiro, 2009) [3] .
After refining, the D100 is pumped to fuel-distribution base tanks near the refinery (BADUC), which adds 5% of B100, producing B5. This fuel is loaded in tank trucks (30,000 L) (Freitas, 2010) [29] that distribute the fuel (27.6 ± 9.7 km) to bus-garage filling stations (Menezes, 2004) [30] .
The natural gas associated with domestic petroleum can be re-injected into the well, burned, consumed (as fuel on drilling platforms) or made available for public use (D’Agosto and Ribeiro, 2009) [3] . In 2009, sales of CNG in the state of Rio de Janeiro represented 16% of the natural gas available in the Campos Basin (ANP, 2010b) [31] . It is assumed that all CNG for automotive use in the municipality of Rio de Janeiro is derived from the Campos Basin.
The available natural gas is transported by pipeline (452 km) to the processing unit and then it is distributed by pipeline to the stations (638 km), where it is compressed (22.3 MPa) and supplied to buses (D’Agosto and Ribeiro, 2009) [3] .
Life Cycle Model for soybean biodiesel: B100-PSB100
The state of Rio de Janeiro does not produce a representative volume of raw material for biodiesel production, and in 2009, it imported 85% of its demand from São Paulo, Goiás and Mato Grosso (Freitas, 2011) [33] , where soybean oil is the predominant raw material (70%) and alcoholic transesterification with methanol and potassium hydroxide the main production process (95%) (ANP, 2010a) [27] to produce the soybean-oil methyl ester, herein called B100.
The amount received from each producer state was estimated considering the representative plants (Figure 4) that had continuous production between January and November of 2009 (ANP, 2010a) [27] . Thus, 15% of the state of Rio de Janeiro’s demand is met by Rio de Janeiro, 63% by São Paulo, 15% by Goiás and 7% by Mato Grosso.
The average distance between the soybean-oil extraction plants and the B100 producers, the latter weighted by participation percentage, was estimated to be 203.6 ± 14.5 km. The extracted oil is transported by tanker truck (18,000 L) (Freitas, 2011) [33] .
Once produced, B100 is transported 753.4 ± 53.5 km by tanker truck (30,000 L) (Freitas, 2010) [29] to BADUC, a distance that again is weighted by the producer-plant participation percentages.
Life Cycle Model for additivated hydrous ethanol: E95-PSE95
The raw material for ethanol production is sugar cane, which is transported by truck (23 t) for 25 ± 5 km to the production plants. For São Paulo, it is assumed 45% of the sugar-cane harvest is mechanized, while is 15% in other states. The remaining harvest is manual with mechanized loading (D’Agosto and Ribeiro, 2009) [3] .
The state of Rio de Janeiro meets 8% of its demand for ethanol, acquiring the remainder from São Paulo (70%), Minas Gerais (18%) and Goiás (4%) (Freitas, 2011) [33] .
To produce E95, 5% in volume of an additive with lubricant and explosive properties is admixed at the plant (Jansen et al., 2010) [25] .
The weighted distance between the E95 producer plants and BADUC was estimated to be 736.1 ± 36.8 km. Tanker trucks are used (30,000 L) (Freitas, 2010) [29] . From BADUC, the distribution of E95 is similar to that of B5.
3.2. Phase 2: Inventory Analysis
Tables 2-7 present the LCI result for each ES and PS considered in this study. In these tables, the supply chain stages are firstly presented, followed by the mean for the total supply chain, the end use phase and the mean for the total life cycle. Storages except in raw material transportation do not have relevant values and were not included in calculations.
The lower heating value (LHV) was adopted to estimate the energy content of the fuels and the embodied energy was discounted because its identification is a result of the study.
Arithmetic means of historical data series, the sample standard deviation and the coefficient of Student’s t-distribution (90% significance) were used to estimate the range of data (Coelho, 1994) [34] . Data available in the form of ranges had their average determined by the interval center and variation by amplitude divided by two.
Net emissions of CO2 ( ) were calculated using Equation (1) applied to fossil fuels. It is assumed that the CO2 emitted by the fraction of biofuels that are derived from biomass (sugar-cane straw and bagasse, E95 and B100) is reabsorbed in the production of raw material. The CO2 emission from hydroelectric energy was disregarded because the emission is a second-level flow (D’Agosto and Ribeiro, 2009) [3] .
 (1)
(1)
where:
CEC―energy content [MJ/t];
Fcon―conversion factor [tC/MJ];
Fcorr―conversion factor from HHV to LHV (0.90―gases; 0.95―liquids);
Fox―oxidized carbon proportion factor (0.995―gases; 0.99―liquids);
 ―conversion factor from C to CO2 (3.67 [tCO2/tC]).
With the exception of the D100 supply chain, which is considered as a reference, the fuel used in farm equip- ment and trucks is B5, as is mandatory by law in the entire Brazilian territory. For comparison with the use of B5, the total energy consumption, renewable energy use and net emission of CO2 for the B100 and E95 supply chains, using D100, were estimated.
3.2.1. Supply Chain for the Primarily Fossil Alternatives: D100-PSD100, CNG-PSCNG, B5CNG-PSDG and B5-PSB5
The quantity of D100 and natural gas consumed in the production of petroleum and domestic natural gas was

Table 2. Life Cycle Inventory: D100-PSD100.
Legend: FP: fueling pumping; LP: loading pumping; MT: maritime transportation PP: pipeline pumping; RT: road transportation; STO: storage; UP: unloading pumping. Notes: 1) Vflow: flow percentage variation based on the mean; 2) Wflow: weight of the alternative in the total flow.
obtained from D’Agosto and Ribeiro (2009) [3] . Mass division was used as a criterion of allocation (0.043 kg of natural gas - 1 kg of petroleum). The D100 consumed in exploration and the re-injected natural gas was allocated exclusively to petroleum since they are used to obtain it. The values obtained were: 0.0042 ± 0.0005 toe/t (exploration) and 154 ± 11 MJ/barrel (production) for petroleum and 2004 ± 140 MJ/t (production) for natural gas.
For imported petroleum, 0.0075 ± 0.0004 toe/t was adopted for onshore exploration, and 97 ± 5 MJ/barrel for Persian Gulf production. D100 was used in the exploration and natural gas in the production (Sheehan et al. 1998) [18] .
Domestic petroleum pumping (PP2, PP3 and PP4) consumes 0.0311 ± 0.0031 kWh/t・km of hydroelectric energy and (1.79 ± 0.23). 10 - 4 toe/t for the heating in the terminals (STO2 and STO3) with fuel oil and natural gas (D’Agosto and Ribeiro, 2009) [3] . For the petroleum pumping in the Middle East (PP1) (Sheehan et al. 1998) [32] a value of 0.0144 ± 0.0007 kWh/t・km of natural gas was adopted and the Brazilian domestic data for the heating in the terminals (STO1).
For maritime transportation (MT), the fuel-oil consumption of 1.54 to 1.64 g/t・nmi was adopted for shipping and 3.5 to 3.7 t/h for loading and unloading (LP1 and UP1) (D’Agosto and Ribeiro, 2009) [3] .
The consumption of fuel oil, natural gas, refinery gas, coke, and hydroelectric power for refining petroleum and processing natural gas was obtained from (PETROBRAS-CONPET, 2003) [35] . The production for D100 and derivatives was obtained from (ANP, 2010b) [31] , and it was possible to calculate the energy efficiency range of the process (89% to 91%) and the mass and energy balances (6% and 8%). The hydroelectric power and natural gas consumed by the petroleum derivatives and the dry natural gas mass and other fuels were divided only
Table 3. Life Cycle Inventory: B5-PSB5.
Legend: FP: fueling pumping; LP: loading pumping; MT: maritime transportation; PP: pipeline pumping; RT: road transportation; STO: storage; UP: unloading pumping. Notes: 1) Vflow: flow percentage variation based on the mean; 2) Wflow: weight of the alternative in the total flow.
Table 4. Life Cycle Inventory: CNG-PSCNG.
Legend: FC: fueling compression; NC: not considered; PC: pipeline compression. Notes: 1) Vflow: flow percentage variation based on the mean; 2) Wflow: weight of the alternative in the total flow.
Table 5. Life Cycle Inventory: B5CNG-PSDG.
Legend: FC: fueling compression; FP: fueling pumping; LP: loading pumping; MT: maritime transportation; PC: pipeline compression; PP: pipeline pumping; RT: road transportation; STO: storage; UP: unloading pumping. Notes: 1) Vflow: flow percentage variation based on the mean; 2) Wflow: weight of the alternative in the total flow.
by the petroleum derivatives. The values obtained were 3798 ± 190 MJ/t (D100) and 509 ± 25 MJ/t (natural gas).
The energy consumption for internal movement or product transfer by pipelines between REDUC and BADUC (PP5) was internalized in REDUC because of limitations on data availability.
The loading of tanker trucks for distribution (LP3 and LP4) consumes 2.17 ± 0.13 MJ/t of hydroelectric energy for D100 and B5. The fuel economy values for tanker trucks (RT2 and RT3) vary between 1.81 and 2.25 km/L. The consumption of hydroelectric energy adopted in the fuelling process (FP1 and FP2) was 0.654 ± 0.033 MJ/m3. The base storage (STO4 and STO6), the unloading of tanker trucks (gravity) and the filling-station storage (STO7 and STO8) do not use energy. Leakages and evaporative emissions are not within the scope of this study (D’Agosto and Ribeiro, 2009) [3] .
The hydroelectric power consumed in the transportation of natural gas to processing (PC1) was 30 ± 0.9 MJ/t. The same value was used for the distribution of natural gas (PC2) because specific data were unavailable. For the fueling compression (FC1), a value of 1021 ± 94 MJ/t was adopted (D’Agosto and Ribeiro, 2009) [3] .
3.2.2. Supply Chain for Soybean Biodiesel: B100-PSB100
Values of a total of 2.4 ts/ha (ts: ton of soybeans) for the production of soybeans and 18% for the weight of the oil in the seed are assumed (ANP, 2010b) [31] .
For the purpose of consistency with the practice presented by D’Agosto and Ribeiro (2009) [3] , the embodied energy in the agricultural inputs and the use of energy for their supply, even though the inputs are second-level flows, were considered. The energy consumption required for the raw material production amounted to 5613 ± 328 MJ/tB100 (tB100: ton of B100).
The soybeans are transported (RT4) to the crusher by tractors (capacity of 12 t and a fuel economy of 1.34 km/L) for a distance of 8 ± 1 km (Silveira, 1991) [36] .
It is assumed that all the energy required for the production of soybean oil (reception and storage, preparation, oil extraction, oil recovery, oil degumming, solvent recovery, bran processing and waste treatment) is obtained from the burning of 351.28 kcal/ts of fuel oil, use of 182.6 kcal/ts of vapor and 72.5 kWh/ts of hydroelectric energy (Sheehan et al., 1998 [32] and Morais et al., 2010 [13] ).
The energy costs for transporting (RT5) the soybean oil to the B100 production plants and loading and unloading (LP5 and UP3) the oil were similar to those for B5.
The B100 production plants consume 2347 ± 10 MJ/tB100, and the embodied energy of the methanol is considered to be 2,663 MJ/tB100 (Boustead and Hancock, 1979) [37] .
The transport (TR1), loading (LP2), unloading (UP2), storage at BADUC (STO5), loading for distribution (LP6), urban distribution (RT6), filling-station storage (STO9) and buses fueling (FP3) were treated as for B5.
3.2.3. Supply Chain for Additivated Hydrous Ethanol: E95-PSE95
The yield of 65 tc/ha is assumed (tc: ton of sugar cane) for the production of sugar cane. In São Paulo, the yield of 85.4 Leh/tc was adopted (Leh: liter of hydrous ethanol) and 73.0 Leh/tc for other states (D’Agosto and Ribeiro, 2009 [3] ).
The embodied energy in the agriculture inputs and the use of energy for their supply were considered for the same reason presented for B100. The sugarcane growing cycle lasts 5 years, with planting (once), regrowth from stumps (3 times) and mechanized harvesting (4 times) using equipment that consumes B5 (25.10 ± 2.25 MJ/tc). The energy consumption for the production of raw material amounted to 1993 ± 59 MJ/teh (teh: ton of ethanol) (D’Agosto and Ribeiro, 2009) [3] .
The mechanized loading (MLD) and the transport (RT7) of the sugar cane to the mills use loaders and trucks that consume B5 (16.25 ± 1.62 L/ha and 0.0220 ± 0.0011 L/t・km, respectively), totaling 492 ± 25 MJ/teh (D’Agosto and Ribeiro, 2009) [3] .
All the energy required for ethanol production (grinding, fermentation, distillation and power generation) is obtained from the burning of 232 kg/tc of bagasse (LHV = 1650 kcal/kg) with a vapor-conversion efficiency of 78%. The surplus 8% of bagasse is considered a co-product because of the material’s potential to generate marketable energy. An energy efficiency of 58% was obtained in the process, with 7% for the mass balance, 0.3% for the energy balance and 13,058 ± 668 MJ/teh (D’Agosto and Ribeiro, 2009) [3] .
For the production of E95, an additive is used with 26,276 MJ/t (Jansen et al., 2010) [32] of embodied energy.
Similarly to B5, a value of 464 ± 72 MJ/tE95 was obtained for the loading, unloading (LP7 and UP4) and transport from the distillery to the BADUC (RT8), and a value of 48.6 ± 9 MJ/tE95 was obtained for the urban distribution (LP8 and RT9) and fueling (FP4).
3.2.4. End Use
Table 1 presents end use parameters and fuel economy values of the PS. The parameters were converted to the functional unit kg/pass・km using fuel’s specific mass and vehicle average occupancy. For D100, B5, B100 and PSDG, the same engine energy efficiency was assumed, where the mass fuel consumption varied as a function of energy content.
3.3. Phase 3: Data Evaluation
Following D’Agosto and Ribeiro (2009) [3] , Wmin (minimum weight) = 20% and Vmax (maximum variation) = 10% were adopted.
In Tables 2-7, 20 flows were observed where Wflow ≥ 20%, and 11 present values for Vflow ≥ 10%. No
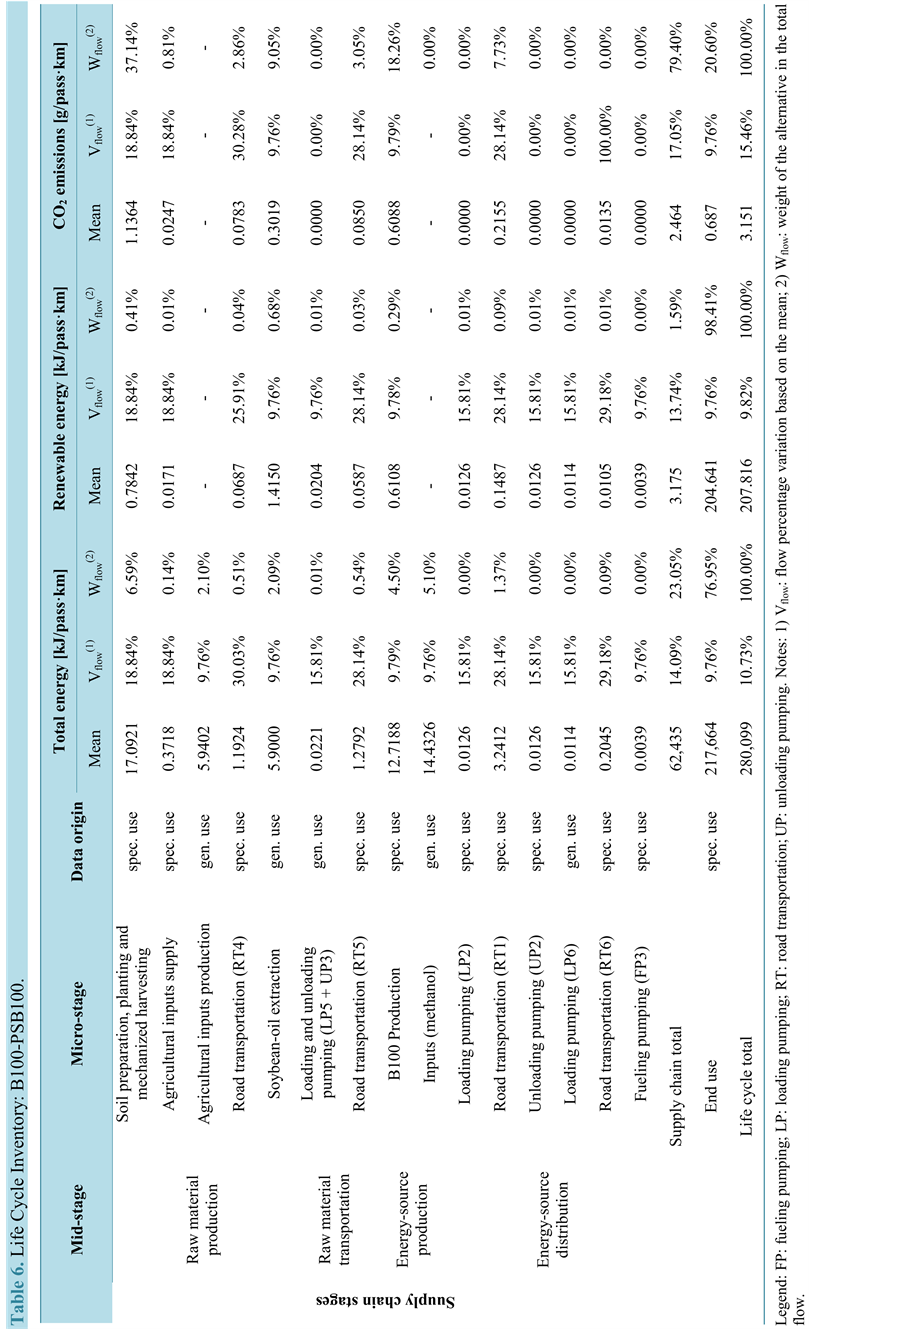
Table 6.Life Cycle Inventory:B100-PSB100.

Table 7.Life Cycle Inventory:E95-PSE95.
value reflects data of general use that is non-critical and opts for maintenance. The main aspect to be ascertained is the data’s consistency.
Values greater than Wmin occur for flows related to the consumption of renewable energy in the micro-stages PP3, PP4 and refining. This fact arises from the combination of pumping distance (334 km) and the variability of the data obtained in PETROBRAS-CONPET (2003) [35] , which is considered characteristic of those micro- stages.
Variations above Wmin and Vmax are observed in the total energy consumption and net CO2 emissions in the end use of CNG-PSCNG and in the total and renewable energy consumption and net CO2 emissions in the end use of E95-PSE95. In the case of CNG-PSCNG, the high energy efficiency of the CNG supply chain and the low energy yield of PSCNG enhance the weight of the consumption of fossil energy in this alternative’s end use. Additionally, the energy yield field data of PSCNG composed a sample that provided a broad range of variation for 90% significance.
For the consumption of renewable energy in the compression of CNG in the filling stations (FC1), only references for average values (D’Agosto and Ribeiro, 2009) [3] could be obtained. The refinement of these data, considering their variation, presents an opportunity for improvement in this study.
In the case of E95-PSE95, the heavier weights and flow variations of the end use are associated with PSE95’s low fuel economy and the amount of data available.
Due to the dependence on B5, the net CO2 emission flows for soil preparation, cultivation and mechanical harvesting of B100-PSB100 and the transport of sugar cane (RT7) for E95-PSE95 presented unfavorable conditions of weight and variation. The same is true for the total energy consumption in the production of E95 because it is energy intensive and the energy content of the additive that comprises E95.
3.4. Phase 4: Comparison of Results and Discussion
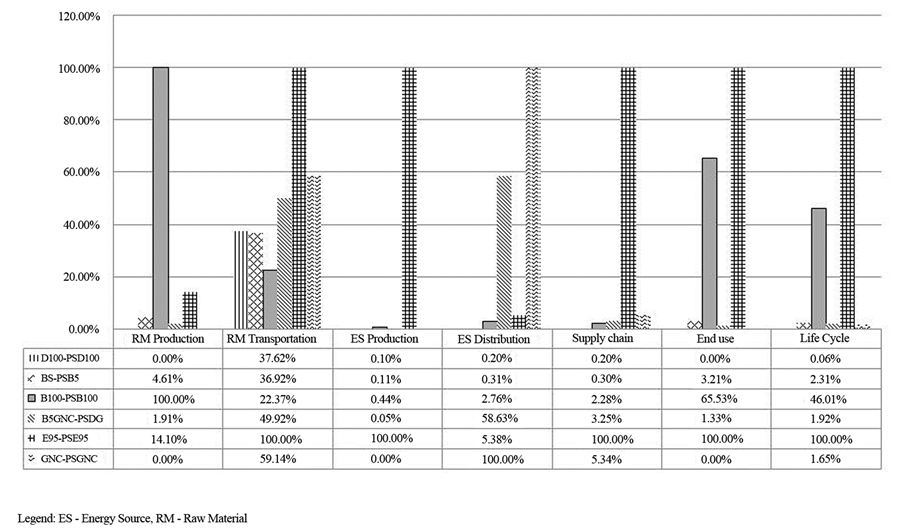
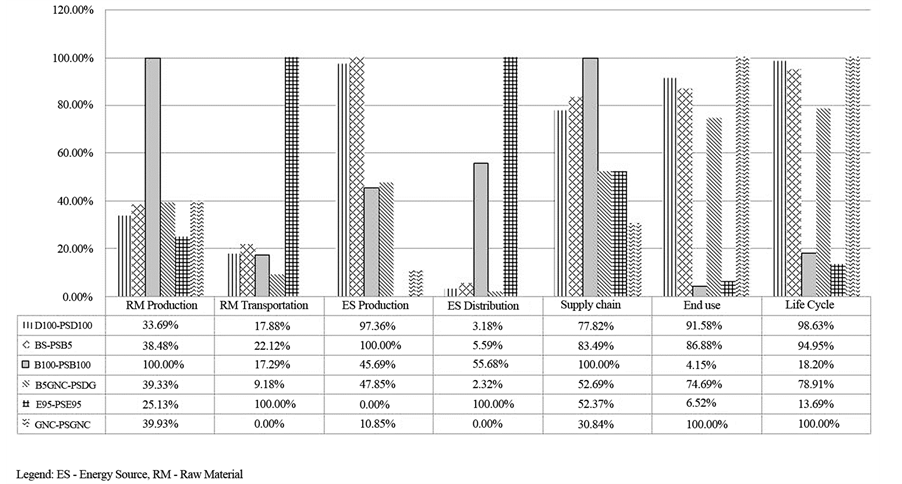
A parametric comparison was chosen for the analysis (Figures 6-8), where for each alternative in Table 1, the largest flow value is considered as a reference. In total energy consumption and net CO2 emissions, the highest values represent the worst performances. The inverse is true for the renewable energy use. In these figures, the supply chain stages are firstly presented, followed by the mean of the total supply chain, the end use phase and the mean of the total life cycle.
3.4.1. Total Energy Consumption
Due to the low productivity of the transformation of sugar cane to ethanol (from 73.0 to 84.5 Leh/tc) E95-PSE95 presents the highest total energy consumption (44 times higher than that of the best alternative, CNG-PSCNG) of all supply chains and life cycles and the highest total energy consumption in the raw-material transportation.
As for total energy consumption, D100-PSD100, B5-PSB5 and B5CNG-PSDG can be considered similar in the total supply chain and exhibit no differences within a range of ±1.5%.
B100-PSB100 presents the highest total energy consumption for the raw-material production by aggregating the micro-stages of agricultural production, the embodied energy in production inputs and the extraction of soybean oil. Similarly, E95-PSE95 is the second most energy-intensive with respect to the raw-material production. However, the alternatives that require the largest quantity of fossil fuels (D100, B5 and CNG) or the PSDG consume 55% and 64% less total energy at the mid-stage.
By using pipelines, CNG-PSCNG presents the best result in the raw-material transportation, 15% to 16% better than the alternatives that require the transport of petroleum and soybean oil, where more than 75% of the transported raw material is converted into the ES or co-products of commercial value.
The alternative CNG-PSCNG requires from 13% to 16% of the total energy consumption for the energy source production compared with D100-PSD100, B5-PSB5 and B100-PSB100. Because natural gas is associated with petroleum and the processing is performed adjacent to the refinery, identifying the amount of energy consumed was difficult, and adopted values were underestimated and require improvement.
The need to compress the natural gas for supply leads to CNG-PSCNG requiring the highest total energy consumption for energy source distribution, negatively affecting B5CNG-PSDG.
The total energy consumption for the energy source distribution of B100-PSB100 and E95-PSE95 is affected by the long over-the-road transfer distances required for B100 and E95 between the production plants and the BADUC.
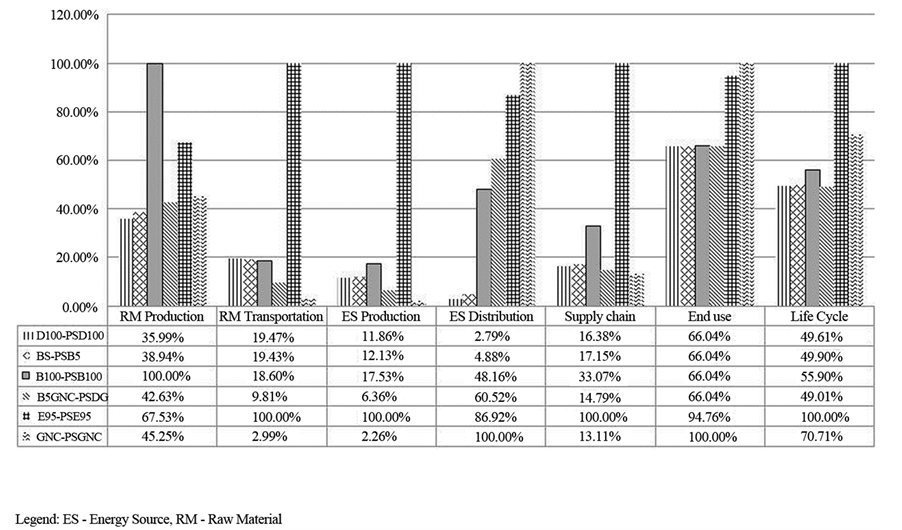 Note: Alternatives D100-PSD100, B5-PSB5, B100-PSB100, B5GNC-PSDG, E95-PSE95 and GNC-PSGNC as defined in Table 1.
Figure 6. Total energy consumption.
 Note: Alternatives D100-PSD100, B5-PSB5, B100-PSB100, B5GNC-PSDG, E95-PSE95 and GNC-PSGNC as defined in Table 1.
Figure 7. Renewable energy use.
The lowest total energy consumption of the alternative CNG-PSCNG in the supply chain reflects the results obtained in three of the four mid-stages. The inverse occurs with E95-PSE95. The alternative B100-PSB100 is in an intermediate position, with 1/3 of the total energy consumption of the worst alternative, whereas D100- PSD100, B5-PSB5 and B5CNG-PSDG approach the best alternative with variations lower than 4%.
 Note: Alternatives D100-PSD100, B5-PSB5, B100-PSB100, B5GNC-PSDG, E95-PSE95 and GNC-PSGNC as defined in Table 1.
Figure 8. Net CO2 emissions.
Due to the low energy yield of PSCNG and the high lower heating value of CNG, CNG-PSCNG demonstrated the worst total energy consumption for end use. For similar reasons, E95-PSE95 produced a result (−5.24%) similar to that of the worst alternative.
In end use, D100-PSD100, B5-PSB5, B100-PSB100 and B5CNG-PSCNG are analogous because the energy yield of diesel-cycle engines that used D100, B5, B100 and PSDG are the same.
As for the life cycle, D100-PSD100, B5-PSB5 and B5CNG-PSCNG demonstrate lower total energy consumption and can be considered equivalent.
The best result in supply-chain total energy consumption of CNG-PSCNG does not compensate for it being the worst in end use, and this alternative is the second worst in life cycle.
For D100-PSD100 and CNG-PSCNG, the supply chain consumes 12% and 7%, respectively, of the life cycle’s total energy. These values are comparable with those obtained by IEA (1999) [38] , EUCAR (2007) [39] and Yan and Crookes (2009) [8] . The latter value for developing countries varies from 8% to 20% for D100 and from 7% to 24% for CNG. For B100-PSB100, the supply chain consumes 22% of the life cycle’s total energy. This value is comparable with a European result (21% to 22%) (EUCAR, 2007) [29] . However, the value is lower than the best American, Italian and Chinese values (30% to 49%) (Yan and Crookes, 2009) [8] .
The bio-energy yield to fossil energy (no-renewable energy) input ratios for E95-PSE95 is 6.3 (all mid-stages of supply chain are considered) and 7.2 (all stages but energy source distribution are considered). Those figures are comparable to the Brazilian experience found in Blottnitz and Curran (2007) [5] research work presenting a rate of 7.9 when all stages but energy source distribution are considered. The number is over four times better than the average value for temperate weather countries (USA and Great Britain) what ratifies one of the conclusions of Blottnitz and Curran (2007) [5] to make ethanol from sugar crops in tropical countries.
3.4.2. Renewable Energy Use
Regarding renewable energy use, E95-PSE95 produced the best results for two mid-stages of the supply chain and end use, which puts it in a prominent position with higher values than the other alternatives. This result is mostly due to the use of sugar cane bagasse as an energy source in E95 production for the mid-stage of higher energy intensity and the use of B5 in the agricultural production and raw-material transportation. An ever better position could be achieved if renewable fuels (such B100) could be used in tractors and trucks as stayed by Ometto and Roma (2010) [11] .
For D100-PSD100, B5-PSB5 and B5CNG-PSCNG, where oil derivatives are predominant, little contribution from renewable energy in the mid-stages of the supply chain occurs being it associated with the use of hydroelectric energy or B5 for oil and its byproducts transportation.
The addition of 5% B100 in D100 increases the share of renewable energy in the supply chain of D100- PSD100 by 47.5% with an increase of 0.58% in total energy consumption and a reduction of 3.8% in net CO2 emissions during the life cycle. In the case of B100-PSB100, the use of B5 increases the share of renewable energy in the supply chain by 51.15% with an increase of 0.03% in the total energy consumption and a decrease of 7% in net CO2 emissions in the life cycle.
The use of B5 does not significantly affect the use of renewable energy (+0.69%) or total energy consumption (+0.04%) in E95-PSE95’s supply chain, which already shows a great use of this energy input. However, a decrease of 9.29% in the net CO2 emissions in the supply chain occurs, which reaches 5.28% in the life cycle.
The use of hydroelectric energy in the extraction of soybean oil is reflected in the best result of B100-PSB100 with respect to the use of renewable energy in the production of raw material. With the other alternatives, the use of renewable energy for the raw-material production is due to the use of B5.
For CNG-PSCNG, because hydroelectric energy is used to transport and distribute CNG, the mid-stages comprise the greatest share of renewable energy in the CNG supply chain.
In end use, E95-PSE95 and B100-PSB100 present the two best values in the use of renewable energy because these two alternatives use biofuels. This result is reflected throughout the life cycle.
The share of fossil fuels in the supply chains of D100-PSD100 and CNG-PSCNG is approximately 12% and 5%, respectively, less than the values found by (Yan and Crookes, 2009) [8] for D100 (19% to 26%) and CNG (15% to 21%) because hydroelectric energy is used in Brazil.
For B100-PSB100 and E95-PSE95, 21% and 9%, respectively, of the consumed energy in the life cycle is of fossil origin. These values are comparable with (EUCAR, 2007) [39] and (Yan and Crookes, 2009) [8] , with 21% to 22% (B100) and 12% to 48% (ethanol) (Luo et al., 2009 [9] and Khatiwada and Silveira, 2011 [14] ), the latter from Asian experiences.
3.4.3. Net CO2 Emissions
Net CO2 emissions are associated with the consumption of fossil fuels in the life cycle mid-stage. Thus, B100- PSB100 has the highest net CO2 emissions for raw-material production because the alternative depends on the use of B5 for agricultural production and on grain transport and fuel oil for the soybean-oil extraction. Even though, the use B100-PSB100 appears to be attractive if compared to D100-PSD100 since its use results in 81% reductions of CO2 life cycle emissions, what is aligned to conclusions of Nanaki and Koroneos (2012) [10] .
In opposition, the alternatives that rely mainly on fossil fuels (D100-PSD100, B5-PSB5, B5CNG-PSCNG and CNG-PSCNG) in the raw-material production demonstrate significant net CO2 emissions.
Due to the low yield in the road transportation of sugar cane, E95-PSE95 has the highest net CO2 emissions in the raw-material transportation. Due to the higher energy efficiency of their transport modes and the conversion of their raw materials to a commercially valuable co-product, the other alternatives present lower net CO2 emissions in raw-material transportation even when they depend on fossil fuels for their transport.
By using only hydroelectric energy for the raw-material transportation and energy source distribution, no net CO2 emissions are found in CNG-PSCNG mid-stages.
Because they depend mostly on petroleum derivatives for the production of their energy source, D100- PSD100 and B5-PSB5 demonstrate the highest net CO2 emissions.
In contrast, because E95-PSE95 uses exclusively sugar cane bagasse to produce steam and electricity for the production of ethanol, this alternative has zero net CO2 emissions. The advantageous CO2 emissions savings in using byproducts to generate steam during ethanol production were also observed in Moriizumi et al. (2012) [16] and Gil et al. (2013) [21] , but in that case the impact of co-location was limited because cassava Thai starch factories were not energetically self-sufficient. On the other hand, Brazilian experience in self-sufficient production of steam and electricity for ethanol refinery ratifies the conclusion of Nguyen et al. (2010) [12] concerning CO2 emissions reduction.
The long road-transport distances in energy source distribution for B100-PSB100 and E95-PSE95 results in the two worst positions for these alternatives in net CO2 emissions. However, alternatives related to fossil fuels (D100-PSD100, B5-PSB5 and B5CNG-PSCNG) demonstrate marginal emissions, which amount to less than 6% of the worst alternative.
In the supply chain, B100-PSB100’s result for the raw-materials production, energy source production and distribution achieves a low position in net CO2 emissions, followed by the alternatives that depend mostly on petroleum derivatives (D100-PSD100 and B5-PSB5). In the macro-stage, the alternative that performs best is CNG-PSCNG due to the use of hydroelectric energy for transporting and distributing the CNG and the low fraction of energy from fossil origins associated with the source-energy production.
As for the end use, the fossil fuels demonstrate the highest net CO2 emissions, the worst results for CNG- PSCNG due to PSCNG’s low energy yield affecting the life-cycle result.
The D100-PSD100 and CNG-PSCNG supply chains are responsible for 11% and 4% of the net CO2 emissions of these alternatives, respectively, lower values than the ones found in (EUCAR, 2007) and (Yan and Crookes, 2009) [8] (20%). This outcome reflects the privileging positions of exploration and productions sites and the use of hydroelectric energy.
For the production of B100, (Hou et al. 2011) [15] presents the following values for net CO2 emissions by the mid-stage: for raw material production, 32%; for raw material transportation, 2%; for energy source production, 60% and for energy source transportation, 1%. For B100-PSB100, these values are 48%, 3%, 19% and 7%, respectively. Because the use of hydroelectric energy and natural gas minimize net CO2 emissions for Brazilian energy source production and because in Brazil B100 is transported a distance 200 times greater than in China, the two first mid-stages show more adherence.
Still considering the net CO2 emissions in B100 supply chain, the work of (Rajaeifar et al., 2014) [22] obtains the same conclusion of this paper: raw material production is responsible for the largest amount of emissions. Nevertheless, biodiesel transportation has less weight in the total supply chain (1.17% in the abovementioned paper versus 6.14% in the present research). This can be explained by the differences in transportation distances (515 km versus 753 km).
4. Conclusions
The LCI procedure allowed for the systematic and critical analysis and comparison of total energy consumption, renewable energy use and net CO2 emissions for six fuel alternatives for the Municipality of Rio Janeiro’s urban public transportation. It also contributes to the development and dissemination of knowledge of the life cycle of fuel alternatives for transportation in developing countries. To the best of our knowledge, the results are unprecedented.
The best alternative depends on the aspects valued. In total energy, D100-PSD100, B5-PSB5, B5CNG-PSDG and B100-PSB100 stand out, in that order. If the use of renewable energy and the reduction of net CO2 emissions are the goals, E95-PSE95 and B100-PSB100 are the best. CNG-PSCNG does not stand out in any comparisons.
The LCM (Figures 3-5) and the LCI (Tables 2-7) fit the circumstances of the state of Rio de Janeiro with respect to the life cycle of petroleum derivatives, natural gas and biofuels that can be used in most types of transportation mode end use. Therefore, the strength and flexibility of the procedure are highlighted in view of the different applications.
The results also highlight the suitability of the procedure to identify, over the life cycle of each alternative, specific advantages, particularly regarding the use of B5 (sub-item 3.4.2) and PSDG, which are part of the objectives of this study.
However, the results obtained are limited to the scope of the model (the municipality). Within this scope, D100-PSD100, B5-PSB5, CNG-PSCNG and B5CNG-PSDG are favored for their proximity to the raw material production, entirely or in part, and end use place. Such results should not be adopted as national averages, which would involve the determination of a different extent for the LCM.
The LCM established for the natural gas associated with petroleum favors the alternatives CNG-PSCNG and B5CNG-PSDG in relation to the total energy consumption in the supply chain. Inaccurate data on the production and distribution of CNG may have led to underestimating the total energy consumption for these mid-stages. The last two items represent opportunities for improvement in the study.
The present work is limited to a preliminary approach regarding the realization of the LCI. A detailed assessment of the data to evaluate other environmental effects, such as local air pollutants, other greenhouse gases, water and productive inputs is recommended.
This first approach did not consider the costs and financial viability of the most recent alternatives CNG- PSCNG, B5CNG-PSDG and E95-PSE95 in their end use, which is another suggestion for future studies.
Acknowledgements
Acknowledgements to Conselho Nacional de Desenvolvimento Científico e Tecnológico (CNPq), Confederação Nacional do Transporte (CNT), Serviço Social do Transporte (SEST) and Serviço Nacional de Aprendizagem do Transporte (SENAT).
Cite this paper
Márcio de AlmeidaD’Agosto,Cintia Machado deOliveira,Fabiana do CoutoAssumpção,Ana Carolina PeixotoDeveza, (2015) Assessing Cleaner Energy Alternatives for Bus Transit in Rio de Janeiro: A Life Cycle Inventory Analysis. Journal of Environmental Protection,06,1197-1218. doi: 10.4236/jep.2015.611107
References
- 1. EPE (2010) Brazilian Energy Balance. Energy Research Company, Ministry of Mines and Energy, Brasilia, DF. (In Portuguese)
- 2. D’Agosto, M. de A., Ribeiro, S.K. and Souza, C.D.R. (2013) Opportunity to Reduce Greenhouse Gas by the Use of Alternative Fuels and Technologies in Urban Public Transport in Brazil. Environmental Sustainability, 5, 177-183.
- 3. D’Agosto, M. de A. and Ribeiro, S.K. (2009) Assessing Total and Renewable Energy in Brazilian Automotive Fuels: A Life Cycle Inventory (LCI) Approach. Renewable and Sustainable Energy Reviews, 13, 1326-1337.
http://dx.doi.org/10.1016/j.rser.2008.08.008 - 4. Beer, T. and Grant, T. (2007) Life-Cycle Analysis of Emissions from Fuel Ethanol and Blends in Australian Heavy and Light Vehicles. Journal of Cleaner Production, 15, 833-837.
http://dx.doi.org/10.1016/j.jclepro.2006.07.003 - 5. Blottnitz, H.V. and Curran, M.A. (2007) A Review of Assessments Conducted on Bio-Ethanol as a Transportation Fuel from a Net Energy, Greenhouse Gas, and Environmental Life Cycle Perspective. Journal of Cleaner Production, 15, 607-619.
http://dx.doi.org/10.1016/j.jclepro.2006.03.002 - 6. Leng, R., Wang, C., Zhang, C., Dai, D. and Pu, G. (2008) Life Cycle Inventory and Energy Analysis of Cassava-Based Fuel Ethanol in China. Journal of Cleaner Production, 16, 374-384.
http://dx.doi.org/10.1016/j.jclepro.2006.12.003 - 7. Kendall, A. and Chang, B. (2009) Estimating Life Cycle Greenhouse Gas Emissions from Corn-Ethanol: A Critical Review of Current US Practices. Journal of Cleaner Production, 17, 1175-1182.
http://dx.doi.org/10.1016/j.jclepro.2009.03.003 - 8. Yan, X. and Crookes, R.J. (2009) Life Cycle Analysis of Energy Use and Greenhouse Gas Emissions for Road Transportation Fuels in China. Renewable and Sustainable Energy Reviews, 13, 2505-2514.
http://dx.doi.org/10.1016/j.rser.2009.06.012 - 9. Luo, L., van der Voet, E. and Huppes, G. (2009) Life Cycle Assessment and Life Cycle Costing of Bioethanol from Sugarcane in Brazil. Renewable and Sustainable Energy Reviews, 13, 1613-1619.
http://dx.doi.org/10.1016/j.rser.2008.09.024 - 10. Nanaki, E.A. and Koroneos, C.J. (2009) Comparative LCA of the Use of Biodiesel, Diesel and Gasoline for Transportation. Proceedings of the 1st International Energy, Life Cycle Assessment, and Sustainability Workshop & Symposium (ELCAS), Nisyros, 4-6 June 2009.
- 11. Ometto, A.R. and Roma, W.N.L. (2010) Atmospheric Impacts of the Life Cycle Emissions of Fuel Ethanol in Brazil: Based on Chemical Energy. Journal of Cleaner Production, 18, 71-76.
http://dx.doi.org/10.1016/j.jclepro.2009.09.003 - 12. Nguyen, T.L.T., Gheewala, S.H. and Sagisaka, M. (2010) Greenhouse Gas Savings Potential of Sugar Cane Bio-Energy Systems. Journal of Cleaner Production, 18, 412-418.
http://dx.doi.org/10.1016/j.jclepro.2009.12.012 - 13. Morais, S., Mata, T.M., Martins, A.A., Pinto, G.A. and Costa, C.A.V. (2010) Simulation and Life Cycle Assessment of Process Design Alternatives for Biodiesel Production from Waste Vegetable Oils. Journal of Cleaner Production, 18, 1251-1259.
http://dx.doi.org/10.1016/j.jclepro.2010.04.014 - 14. Khatiwada, D. and Silveira, S. (2011) Greenhouse Gas Balances of Molasses Based Ethanol in Nepal. Journal of Cleaner Production, 19, 1471-1485.
http://dx.doi.org/10.1016/j.jclepro.2011.04.012 - 15. Hou, J., Zhang, P., Yuan, X. and Zheng, Y. (2011) Life Cycle Assessment of Biodiesel from Soybean, Jatropha and Microalgae in China Conditions. Renewable and Sustainable Energy Reviews, 15, 5081-5091.
http://dx.doi.org/10.1016/j.rser.2011.07.048 - 16. Moriizumi, Y., Suksri, P., Hondo, H. and Wake, Y. (2012) Effect of Biogas Utilization and Plant Co-Location on Life-Cycle Greenhouse Gas Emissions of Cassava Ethanol Production. Journal of Cleaner Production, 37, 326-334.
http://dx.doi.org/10.1016/j.jclepro.2012.07.035 - 17. Iglesias, L., Laca, A., Herrero, M. and Díaz, M. (2012) A Life Cycle Assessment Comparison between Centralized and Decentralized Biodiesel Production from Raw Sunflower Oil and Waste Cooking Oils. Journal of Cleaner Production, 37, 162-171.
http://dx.doi.org/10.1016/j.jclepro.2012.07.002 - 18. Silalertruksa, T., Bonnet, S. and Gheewala, S.H. (2012) Life Cycle Costing and Externalities of Palm Oil Biodiesel in Thailand. Journal of Cleaner Production, 28, 225-232.
http://dx.doi.org/10.1016/j.jclepro.2011.07.022 - 19. Jørgensen, A., Bikker, P. and Herrmanna, I.T. (2012) Assessing the Greenhouse Gas Emissions from Poultry Fat Biodiesel. Journal of Cleaner Production, 24, 85-91.
http://dx.doi.org/10.1016/j.jclepro.2011.11.011 - 20. Kochaphum, C., Gheewala, S.H. and Vinitnantharat, S. (2012) Environmental Comparison of Straight Run Diesel and Cracked Diesel. Journal of Cleaner Production, 37, 142-146.
http://dx.doi.org/10.1016/j.jclepro.2012.06.023 - 21. Gil, M.P., Moya, A.M.C. and Domínguez, E.R. (2013) Life Cycle Assessment of the Cogeneration Processes in the Cuban Sugar Industry. Journal of Cleaner Production, 41, 222-231.
http://dx.doi.org/10.1016/j.jclepro.2012.08.006 - 22. Rajaeifar, M.A., Ghobadian, B., Safa, M. and Heidari, M.D. (2014) Energy Life-Cycle Assessment and CO2 Emissions Analysis of Soybean Based Biodiesel: A Case Study. Journal of Cleaner Production, 66, 233-241.
http://dx.doi.org/10.1016/j.jclepro.2013.10.041 - 23. SMTr (2006) Transportation Master Plan of the City of Rio de Janeiro. Municipal Transport, City Hall of Rio de Janeiro, Rio de Janeiro. (In Portuguese)
- 24. Souza, C.D.R., Silva, S.D., Silva, M.A.V., D’Agosto, M.A. and Barboza, A.P. (2013) Inventory of Conventional Air Pollutants Emissions from Road Transportation for the State of Rio de Janeiro. Energy Policy, 53, 125-135.
http://dx.doi.org/10.1016/j.enpol.2012.10.021 - 25. Jansen, R., Rutz, D., Hofer, A., Santos, J.M., Coelho, S.S., Velasquez, S., Capaccioli, S., Landhal, G. and Ericson, J. (2010) Bioethanol as a Sustainable Transport Fuel in Brazil and Europe. Proceedings of the Eighteenth European Bio-mass Conference and Exhibition, Lyon, 3-7 May 2010.
- 26. Tsoutsos, T., Kouloumpis, V., Zafiris, T. and Foteinis, S. (2010) Life Cycle Assessment for Biodiesel Production under Greek Climate Conditions. Journal of Cleaner Production, 18, 328-335.
http://dx.doi.org/10.1016/j.jclepro.2009.11.002 - 27. ANP (2010) Brazilian Statistical Yearbook of Petroleum, Natural Gas and Biofuels. National Agency of Petroleum, Natural Gas and Biofuels, Rio de Janeiro. (In Portuguese)
- 28. Dobson, H. and Beresford, A. (1989) Maritime Atlas of World Ports and Shipping Places. Lloyd’s of London Press Ltd., London.
- 29. Freitas, R.C. (2010) Profile of Liquid Fuel Fleet. Supply Superintendency—SAB, National Agency of Petroleum, Natural Gas and Biofuels, Rio de Janeiro. (In Portuguese)
- 30. Menezes, H.L. (2004) Operating Procedures at the Caxias Core (DPPI). Personal Communication, Head of Caxias Core, Brazilian Oil Company Ipiranga, Distribution Base, Duque de Caxias. (in Portuguese)
- 31. ANP (2010) Data of Production and Fuel Consumption. National Agency of Petroleum, Natural Gas and Biofuels, Rio de Janeiro. (In Portuguese)
- 32. Sheehan, J., Camobreco, V., Duffield, J., Grabowski, M. and Shapouri, H. (1998) Life Cycle Inventory of Biodiesel and Petroleum Diesel for Use in an Urban Bus. Final Report, National Renewable Energy Laboratory, Golden, Colorado.
http://dx.doi.org/10.2172/658310 - 33. Freitas, R.C. (2011) Data on Biofuels Supply (Ethanol and Biodiesel) in the State of Rio de Janeiro. Supply Superintendency—SAB, National Agency of Petroleum, Natural Gas and Biofuels, Rio de Janeiro. (In Portuguese)
- 34. Coelho, S.T., Oliveira Jr., S. and Zylbersztajn, D. (1997) Thermoeconomic Analysis of Electricity Cogeneration from Sugarcane Origin. Proceedings of the Third Biomass Conference of the Americas, Montreal, 24-29 August 1997, 1631-1640.
- 35. PETROBRAS-CONPET (2003) Report on Energy Conservation in the Petrobras System C-CONPET. Petroleo Brasileiro SA, Rio de Janeiro. (In Portuguese)
- 36. Silveira, G.M. (1991) The Machines to Harvest and Transport. Editora Globo S.A, São Paulo. (In Portuguese)
- 37. Boustead, I. and Hancock, G.F. (1979) Handbook of Industrial Energy Analysis. John Wiley and Sons Inc., New York, 391.
- 38. IEA (1999) Automotive Fuels for the Future: The Search for Alternatives. Office of Energy Efficiency Technology and R&D, International Energy Agency, Paris.
- 39. EUCAR (2007) Well-to-Wheels Analysis of Future Automotive Fuels and Powertrains in the European Context. European Council for Automotive R&D, European Commission, Version 2c.
List of Abbreviation
NOTES

*Corresponding author.