Journal of Environmental Protection
Vol.4 No.8A1(2013), Article ID:35304,7 pages DOI:10.4236/jep.2013.48A1001
When Air Quality Becomes Deleterious—A Case Study for Kigali, Rwanda

Department of Physical Geography, University of Kaiserslautern, Kaiserslautern, Germany.
Email: sascha.henninger@ru.uni-kl.de
Copyright © 2013 Sascha M. Henninger. This is an open access article distributed under the Creative Commons Attribution License, which permits unrestricted use, distribution, and reproduction in any medium, provided the original work is properly cited.
Received June 13th, 2013; revised July 13th, 2013; accepted July 20th, 2013
Keywords: Urban Air Quality; Particulate Matter; Urban Climate; Mobile Measurements
ABSTRACT
Rwanda is a landlocked republic in Equatorial Africa. The capital Kigali (1˚57'S, 30˚04'E) can be mentioned as a typical African city due to its rising population and the rising rate of motorization. Different pollutants produced e.g. by a highusage rate of mopeds or open fireplaces burning wood for cooking and household chores could be detected. Climatological parameters as well as air pollutants were measured within the urban area. Additionally, highly frequented spatial and temporal mobile measurements of particulate matter were taken during different dry seasons regarding different conditions. These values indicated an urban heat island, which tended to rise for the last four decades. A temporary phenomenon for the air pollution indicators is visible during clear and calm weather situations, e.g. the distinctive relief caused an accumulation within small valleys called “Marais” in the night time. Unfortunately, these are the favourite places for living and agriculture. So there is no infrequence in values of PM10 > 1.000 µg·m−3. The origin of the different airborne particles was verified by using a scanning electron microscope and it could be mentioned that most particles were from the combustion of biomass and traffic.
1. Introduction
Kigali (1˚57'S, 30˚04'E), the capital of the Equatorial African country Rwanda, indicates, comparable to other sub-Saharan African countries, a fast growing population of at least one million inhabitants. This rising population and the coherent rising rate of motorization were a reason for a sustainable degradation of the urban air quality. Poorly maintained, aged mopeds, motorcycles and vehicles causes an increasing concentration of different air pollutants [1,2]. Apart from the traffic emissions there is another source of air pollution representative for the developing world: the usage of simple stoves and open fireplaces. Burning wood, dung or kerosene for domestic energy, cooking and household chores produces a lot of emission, indoor and outdoor [2,3]. Kigali is situated in the central highlands of Rwanda, and so this distinctive relief is also reflected in the geomorphology of the urban area. The main business and residential districts as well as the governmental quarters are on top of the ridges, which are enclosed by small valleys called “Marais”. The lack of space forces more and more people to settle along the slopes and on the bottom of the hills. These former marsh and wetlands are not only the largest residential area, but there are also large parts of subsistence farming.
Though the existence of air pollution depends on the spatial distribution and of course on the intensity of the sources. But pollution is not necessarily bound within the area of the strongest emission. Topographical and meteorological conditions could have a very strong influence on spatial climatic modifications and the spatial distribution of air quality. So Kigali with its distinctive relief is a good example for these matters of facts [4,5].
2. ReCCiR Project
Analysing the urban meteorological conditions and air quality of Kigali is one part of the so-called ReCCiRProject (Recent Climate Change in Rwanda). The initiation of the ReCCiR project was in 2009. So first of all, the primary project’s aim was to conduct a regional climatic analysis covering all of Rwanda and to visualise it on new maps [6]. Now, the aim of this part of the project is to analyse the development of meteorological conditions and air quality especially for the Rwandan capital. One important issue of the Kigali-part of the project is to map the temporal and spatial variations of air pollutions within the urban area and to show how it is affected by meteorological parameters. For Kigali it is the question of air quality which humans were exposed to. Most of the housing units in the city are using firewood and leaves as fuel material, also dung and kerosene [4,7].
Another part of ReCCiR is the aspect of human health. There is an investigation about the influence of global warming on the behaviour of malaria for the whole country [8]. One problem for Kigali is the present location within the climatic region of the East-Rwandan hot and dry lowland zone, which shifts from east to west [6]. The temperature trend for the urban area of Kigali was analysed by data from three meteorological stations maintained by the “Service Meteo du Rwanda”. Having a common measuring period of all three meteorological stations, the years between 1971 and 2011 were observed and indicated an increasing annual mean temperature of 2.6 K for the period of the last 40 years. Mainly, for the last decade a warming in Kigali is evident. In the first instance, this development could be attributed to global warming because more or less rising temperatures could be recognizes all over Rwanda during the last decades, due to the shift of the East-Rwandan hot and dry lowland zone. But this development could also be related to the ongoing urbanisation, because the temperature trend of Kigali is much higher and faster than in other parts of the country [6]. All three stations displayed a mean urban temperature modification of more than 2 K in relation to the rural stations outside of Kigali [4]. These modifications of the local temperature could have an additional impact on the air quality because of changing terms of air circulation processes, such as an increase in clear and calm weather conditions.
3. Measuring and Analytical Methodology
Initially, air quality and meteorological measurements within the urban area of Kigali were taken during February and March. This process revealed that episodical occurrent meteorological conditions had a significant impact on the already fraught air quality situation within the urban canopy layer.
Air quality measurements and the climatological ones were taken by a mobile laboratory as well as by different stationary measurement devices. This methodology allows measuring air quality and meteorology on one special type of land use, but also at different locations, which is a great advantage in comparison to stationary measurements because it is possible to have not only a spatial but also a temporal image of the climatological an air quality situation within the investigation area respectively (WXT 5000; co. Driesen & Kern). The aim of this measuring methodology was to determine the diurnal course of the different air pollutants’ concentration in relation to the meteorological conditions within the urban area of Kigali (Figure 1). Thus, it should be possible to prove the daily air quality and how it was influenced by different external influencing factors [9].
The analytical equipment allowed, in addition to the particulate matter PM10, PM2.5 and PM1, a continuous determination of the air quality indicators carbon monoxide (CO) and carbon dioxide (CO2) (DustTrak 8534 DRX; co. TSI Incorporated/TSI 7545; TSI Incorporated). The air quality indicators were determined by a suction device of the mobile laboratory at 1.50 m above ground level (a.g.l.). The air sampling was done on the righthand side of the mobile laboratory to reduce the influence of passing motor vehicles. In addition to the air quality indicators the meteorological values air temperature and air humidity were measured in the front of the mobile lab at 2 m a.g.l., also barometric pressure, solar radiation and UV radiation on the rooftop of the vehicle [10].
In consequence that the different air quality indicators were based on diverse analytical methods the equipment had to be calibrated before every measuring trip. Air quality analysers as well as the equipment for meteorology were calibrated with a measuring frequency of 1 Hz, which made temporal corrections of all data less complicated. The maximum driving speed was 30 km·h−1 along streets (8 m·s−1). In spite of the known delay times of the analysers and a measuring frequency of 1 Hz the spatial resolution of the measurement was 8 m. Regarding the delay times of the different instruments and the low driving speed of the mobile lab measurements could be made approximately in real time. At the end of each measuring trip the analysers kept running for 30 seconds. Due to this the delay times of all analysers were considered. This subsequent temporal correction of the measured values for PM10, PM2.5, PM1, CO2, CO but also for the meteorological parameters enabled most accurate and representative results of the air quality and meteorology along the transect. In addition to the measured values also GPS coordinates (measurement frequency of 1 Hz) allowed to relate every recorded value of the air quality indicators to its GPS-point along the measuring route [10]. The mobile measurements were done at three different times of the day (9 a.m.-10 a.m.; 4 p.m.-5 p.m.; 2 a.m.-3 a.m.). The measuring route was subdivided in different route sections in dependence of the different types of land usage along the transect (residential-, business-, industrial areas etc.) [4,10].
In addition to the mobile measurements three steadily measuring stations were located within the urban area. Out there air temperature, air humidity, global radiation, wind speed and direction, as well as the particulate matter, were taken, but also precipitation (Figure 1).
Getting an impression what could be the source of the airborne particles determined within the urban canopy layer air samples were taken with the aid of an filter weighing (Mettler Toledo XP2U; co. Mettler Toledo), in addition to the air quality and meteorological analysis at the three urban stations [11]. The following analysis of the samplings was done in Germany. Using scanning electron microscope (SEM) conclusions should be given of the above mentioned origin of the determined airborne particles. For the determination of the cold air flow and its dynamics a gas chromatograph (AUTO-TRAC 101; co. TracerTech) was used to analyse traces of emitted sulphur hexafluoride.
4. Results
4.1. Particulate Matter within the Urban Atmosphere
The results of the particulate matter analysis of the urban canopy layer of Kigali become more obvious, if the short-time critical limit of 50 µg·m−3 for PM10, defined by the World Health Organisation (WHO), is complementally listed in Figure 2 (dashed black line; [12]). Exemplarily, the results of the mobile PM10 measurements along the measuring route are shown in Figure 2. It offers the mean PM10 concentration in dependence to the route section for all mobile measurements taken at different times of the day along the measuring route within the urban area of Kigali. Indeed, it is obvious that it is absolutely irrelevant which time of the day is chosen. For the representation of the results in Figure 2 all mobile measurements were taken into account.
Measurements between 9 a.m. and 10 a.m. (Figure 2, dotted & solid line) possess a slightly lower concentration in comparison to the mobile measurements in the afternoon (4 p.m.-5 p.m.; double line & dashed line). In dependence of the route section the concentration varies between 50 µg·m−3 and 690 µg·m−3. The course of the transect through the urban area of Kigali is well reproducible by the means of the determined concentration patterns. The highest concentration is reached between the route sections 10 to 16. This is where the transect directs over the ridges of the business and governmental quarters with richest people of Kigali. But this is also the
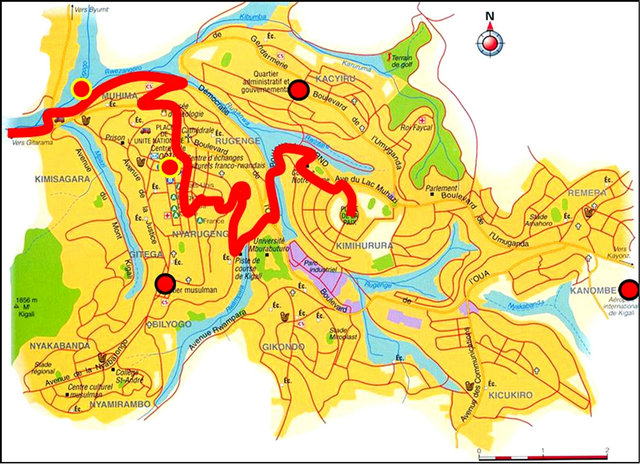
Figure 1. City map of Kigali, Rwanda, showing the mobile air quality measuring route (red line) as well as the location of the three fixed air quality and meteorological station (red dots) within the urban area.
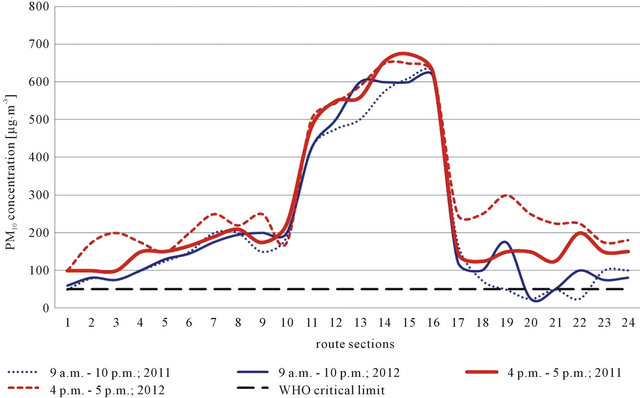
Figure 2. Mean PM10 concentration in dependence on the route section for all mobile measurements taken before and after noon along the measuring route within the urban area of Kigali, Rwanda.
part of the city where the traffic offers its highest frequency. Comparable with the measurements during the morning hours the measurements of the afternoon hours show an inverse course. However, PM10 concentration is slightly increasing up to 282 µg·m−3 (comp. morning hours: 219 µg·m−3). Finally, Figure 2 indicates a very good reproducibility of the results along the whole measuring route with an almost congruent course of concentration before as well as after noon [4].
A significant degradation of the air quality situation within the urban canopy layer could be registered for clear and calm weather conditions with an average wind speed of less than 1 m·s−1 (two-thirds of all measurements). The typical course of concentration shown in Figure 2 is also visible, but even during the morning measurements the PM10 concentration raises due to the limited air exchange from 175 µg·m−3 up to 900 µg·m−3. Comparable to the afternoon measurements in Figure 2 there are the higher values again similar to clear and calm weather conditions. Indeed, this difference explains itself in an increasing concentration between a rate of 1400 µg·m−3 of more than 2000 µg·m−3 [4,5]. This pointed out that the exchange of the near surface air circulation is limited in an extreme way, so that there is a steadily consecutive accumulation of the airborne particles emitted by different sources in the course of the day. Surprisingly, highest concentration were determined where the streets are paved and in a good shape. In an absolute contrast to an analysis of suspended particulate matter within the urban area of Ouagadougou (Burkina Faso) there is no direct correlation between the dispersed airborne particles of the unpaved earth route and the concentration visible [13,14]. Rather this is a distinct advice on the devastating state of the used vehicles. The data of the continuous measuring stations are confirming the mobile measuring results.
4.2. Cold-Air Dynamics
Hazardous measuring trips could be detected for night time measurements with clear and calm weather conditions (2 a.m. - 3 a.m.). The urban surface could heat up extremely because of high temperatures, high solar radiation and a non-typical missing cloud cover. And this could be held responsible for the production of cold air masses and a cold-air flow respectively the most of the ridges and the slopes down to the “Marais” (Figure 3; [4]).
Exemplarily, the results of the mobile night time measurements are shown in Figure 4. It is visible that the PM10 concentration reached the highest levels of the day during night time hours. But the cold-air flow takes away the suspended particulate matter from the ridges, which tends to accumulate within the “Marais” on the bottom of the hills, the places where most residential neighbourhoods could be found and agricultural fields were used. This transportation effect of the cold-air dynamics could be proved by taking the distinctive relief into account (s. black line in Figure 4). Of course this is not the rule, but it is also no snap-shot, because these phenomena showed up in more than 40% of all measuring trips [8].
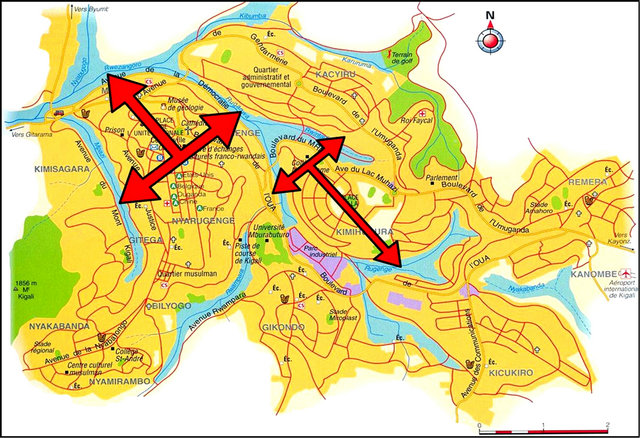
Figure 3. Visualised cold-air dynamics from the ridges down to the “Marais” during night time hours.

Figure 4. Mean PM10 concentration in dependence of the route section for all mobile measurements taken for the night time hours along the measuring route within the urban area of Kigali, Rwanda. Additionally visualised is a simplified model of the distinctive relief along the transect (black line).
4.3. Analysing the Particle Samples
As a matter of fact the critical limit of PM10 defined by the WHO was multiply exceeded in the housing areas of the wealthy population as well as for those of the poor ones. This could be an indication, that not only the traffic density, but also domestic coal must be taken responsible for the fatal pollution of the near surface urban atmosphere. Likewise it was assumed that there must be a high portion of natural inorganic airborne particles due to the warm and dry weather conditions during the measuring periods.
Thereupon, carried out analyse of the taken airborne particle samples using the scanning electron microscope enabled a fast and reliable classification of the suspended particulate matter, which could be filtered out of the urban atmosphere of Kigali. Using the SEM-method the scanned surface of the determined aerosols indicated partially significant and distinct results. It was possible and very simple to differ fly-ash, originating by the combustion of biomass and the carbon particulate-matter produced by diesel engines. Similarly, organic particles as well as inorganic dust could be classified. As it is displayed in Figure 5, it is obvious for the whole investigation area that airborne particles from anthropogenic sources dominate nearly two-thirds of the aerosols of the urban atmosphere. Though, these results proved the primarily conceived assumptions, that the increasing population pressure and the ongoing motorisation rate must have a significant and strong impact on the air quality of the urban canopy layer of Kigali. Most dominating anthropogenic airborne particles were diesel exhaust particulates (29%; due to the high density of aged vehicles using diesel engines), fly-ash (25%; traditional sort of cooking) and kerosene (13%; surrogate fuel due to the decreasing stock of wood). Only 12% of pollen and other organic aerosols could be determined within the atmosphere, which means that this is the smallest portion of all
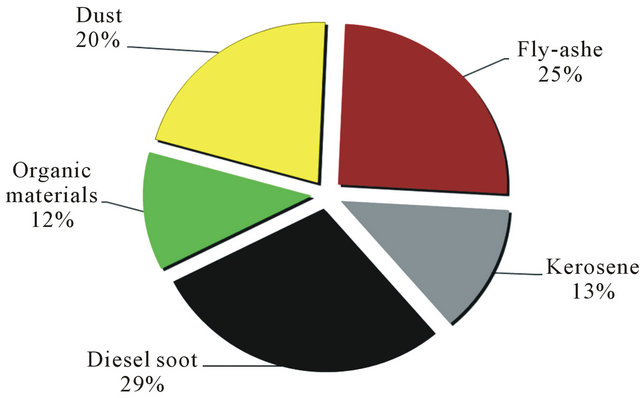
Figure 5. Portions of the different natural organic and inorganic aerosols as well as the percentage of the anthropogenic airborne particles of the urban boundary layer in Kigali, Rwanda.
particulate matter. Dust by a geogenic source achieves tight 21% [5].
5. Concluding Remarks and Prospects
Initial investigations on the urban air quality within the urban canopy layer of the Rwandan capital Kigali offered concentration patterns of PM10 and a situation of air pollution which is hardly traceable. Analysing the suspended particulate matter indicates a daily average of PM10 = 650 µg·m−3, values, which considerably extend the critical limits of the WHO. Thereby, without taking the other possible air pollutants into account, the suspended particulate matter within the urban atmosphere for itself pose an innate hygienic endangerment for the population of Kigali. This situation is accelerated man made pollution due to the usage of aged diesel vehicles and the combustion of biomass. Increasing urban air temperature and a decreasing local air circulation within the urban boundary layer generated by a significant increase of clear and calm weather conditions lead to a tightening of this situation. This results in an advancing accumulation of all air pollutants. A further analysis of diverse other air quality indicators should verify in which extent these offer a noxious potential, too. Additionally to this outdoor situation, an indoor air quality investigation within the clay huts should complement the measurements [15,16]. The measuring period should also cover at least all different rainy and dry seasons respectively to get an impression of the potential local urban modifications of the air quality situation within the urban area of Kigali in dependence of these different climatological features.
REFERENCES
- K. Gwilliam, “Urban Transport in Developing Countries,” Transport Reviews, Vol. 23, No. 2, 2003, pp. 106-120. doi:10.1080/01441640309893
- X. Han and L. P. Naeher, “A Review of Traffic-Related Air Pollution Exposure Assessment Studies in the Developing World,” Environmental International, Vol. 32, No. 1, 2006, pp. 106-120. doi:10.1016/j.envint.2005.05.020
- G. Baumbach, U. Vogt, K. R. G. Hein, A. F. Oluwole, O. J. Ogunsola and H. B. Olaniyi, “Air Pollution in a Large Tropical City with a High Traffic Density—Results of Measurements in Lagos, Nigeria,” The Science of the Total Environment, Vol. 169, No. 1-3, 1995, pp. 25-31. doi:10.1016/0048-9697(95)04629-F
- S. Henninger, “Urban climate and air pollution in Kigali, Rwanda,” The 7th International Conference on Urban Climate, 29 June-3 July 2009, Yokohama, pp. 1038-1041.
- S. Henninger, “Air Quality Modifications within the Rwandan Capitel Kigali,” Berichte des Meteorologischen Instituts der Albert-Ludwig-Universität Freiburg, Vol. 20, 2010, pp. 422-427.
- S. Henninger, “Does the Global Warming Modify the Local Rwandan Climate?” Natural Science, Vol. 5, No. 1A, 2013, pp. 124-129. doi:10.4236/ns.2013.51A019
- J. H. Van Wijnen, A. P. Verhoeff, H. W. Jans and M. Bruggen, “The Exposure of Cyclists, Car Driver and Pedestrians to Traffic-Related Air Pollutants,” International Archives of Occupational and Environmental Health, Vol. 67, No. 3, 1995, pp. 187-193.
- S. Henninger, “Local Climate Changes and the Spread of Malaria in Rwanda,” Health, Vol. 5, No, 4, 2013, pp. 728-734. doi:10.4236/health.2013.54096
- S. Henninger, “Biogenic Isoprene and Its Impact on Human Health in Dependence on Meteorological Conditions,” Journal of Environmental Protection, Vol. 3, No. 29, 2012, pp. 1206-1212. doi:10.4236/jep.2012.329138
- S. Henninger, “A Mobile Measuring Methodology to Determine near Surface Carbon Dioxide within Urban Areas,” In: D. Popovic, Ed., Air Quality—Models and Applications, 2011, InTech (Online), pp. 173-194.
- S. Haryono, A. Budihardjo and N. Hardyanti, “Black Carbon Concentration in Kitchens Using Fire-Wood and Kerosene Fuels,” Journal of Applied Sciences in Environmental Sanitation, Vol. 4, No. 1, 2009, pp. 55-62.
- World Health Organization (WHO), “Air Quality Guidelines for Particulate Matter, Ozone, Nitrogen Dioxide and Sulfur-Dioxide—Global Update 2005—Summary of Risk Assessment,” World Health Organization (WHO), Geneva, 2006, p. 22.
- J. Linden, “Urban Project—Urban Climate and Air Pollution in Ouagadougou, Burkina Faso,” IAUC Newsletter, No. 20, 2006, pp. 10-12.
- J. Linden, S. Thorsson and I. Eliasson, “Carbon Monoxide in Ouagadougou, Burkina Faso—A Comparison between Urban Background, Roadside and Intraffic Measurements,” Water, Air and Soil Pollution, Vol. 188, No. 1-4, 2008, pp. 345-353. doi:10.1007/s11270-007-9538-2
- K. Balakrishnan, J. Parikh, S. Sankar, R. Padmavathi, K. Srividya, V. Venugopal, S. Prasad and V. L. Pandey, “Daily Average Exposures to Respirable Particulate Matter from Combustion of Biomass Fuels in Rural Households of Southern India,” Environmental Health Perspectives, Vol. 110, No. 11, 2002, pp. 1069-1075. doi:10.1289/ehp.021101069
- A. L. Kousa, K. Oglesbyd, K. Koistinea, N. Kunzlib and M. Jantunena, “Exposure Chain of Urban PM2.5—Associations between Ambient Fixed Site, Residential Outdoor, Indoor, Workplace and Personal Exposure in Four European Cities in the EXPOLIS-Study,” Atmospheric Environment, Vol. 36, No. 18, 2002, pp. 3031-3039. doi:10.1016/S1352-2310(02)00232-7