Journal of Environmental Protection
Vol.4 No.5(2013), Article ID:31274,16 pages DOI:10.4236/jep.2013.45047
Water Source Quality in Northern and Central Tanzania: Implications for Rural Communities
![]()
School of Marine and Atmospheric Sciences, Stony Brook University, Stony Brook, USA.
Email: *kamazima.lwiza@stonybrook.edu
Copyright © 2013 Deborah M. Aller et al. This is an open access article distributed under the Creative Commons Attribution License, which permits unrestricted use, distribution, and reproduction in any medium, provided the original work is properly cited.
Received February 9th, 2013; revised March 12th, 2013; accepted April 10th, 2013
Keywords: Tanzania; Water-Related Diseases; Water Quality; UV Disinfection
ABSTRACT
Limited water availability coupled with the lack of hygienic and reliable water sources plague rural areas throughout the developing world. Tanzania has abundant fresh water sources, yet delivery, disinfection, and conservation outside of large towns is lacking or minimal at best. Here we examine drinking water sources in two climatologically distinct regions in Tanzania. We consider their chemical and microbiological characteristics specifically with respect to the potential for ultraviolet (UV) disinfection treatment. Interviews with local villagers provided information on collection means, frequency, storage, and incidences of water related illnesses. Total suspended solids, iron (Fe) and manganese (Mn) concentrations, total bacterial abundances, presence of fecal coliforms, and evidence of Escherichia coli contamination were measured in 31 water sources. Total suspended solids exceeded 15 mg/L, the limit for effective UV treatment, in more than half the sources. Principal component analysis indicated a positive correlation of bacterial abundances with levels of Fe. Water with elevated levels of Mn was associated with greater incidences of diseases. Levels of both Fe and Mn appeared to be more dependent on water source than on climatic differences with the chemical composition of the source rock and redox conditions of the water source at time of collection likely contributing to measured concentrations. E. coli was detected more frequently in water sources in the drier Kondoa district than in the wetter Arusha region. Water quality and socio-economic conditions within villages were linked to incidences of water-borne diseases. The maximum risk of exposure to diarrhea-causing pathogens, for example was strongly related to household income level. Nonetheless, incidences of diarrhea were reduced by more than 40% when the average monthly household expenses increased from US $10 to $20. Finally, to the best of our knowledge, this is the first study known to derive an empirical relationship between water-related diseases and poverty.
1. Introduction
Water is increasingly becoming the world’s most precious commodity for the more than 6.8 billion people on this planet; with the situation only to become more dire for the projected 8.1 billion people by 2030 [1,2]. Over 1.2 billion people currently lack access to clean water and 2.6 billion do not have proper sanitation; with these issues particularly apparent in developing countries [3]. By some estimates, as much as 30% of the world’s population will not have access to adequate supplies of fresh water by 2015 [4]. The United Nations Development Programme (UNDP) estimates that 88% of global disease afflictions are due to unsafe water supplies, and lack of sanitation and personal hygiene. Children under the age of five are the most vulnerable to such illnesses. More than 2 million children die every year from inadequate clean water and sanitation related health problems [5].
Tanzania has significant water sources with three major bodies of freshwater including Lake Tanganyika, Lake Nyasa, and Lake Victoria, the last being the second largest lake by surface area in the world. There are also several smaller lakes and a vast number of rivers which run throughout the country. The problems in water availability are directly related to delivery, disinfection, and conservation which in most areas outside of large towns are minimal or non-existent [5]. It is estimated that only ~50% of the rural population have access to hygienic and reliable drinking water sources and even where water is available >30% of the rural water systems are not functioning properly due to poor operational and maintenance arrangements [6,7]. In Tanzania specifically, 50% of the diseases affecting the people are water-borne or water-related. In fact, inadequate sanitation and mosquitoes correlate directly with the three main causes of death in Tanzania: diarrhea/intestinal worms, acute respiratory infections, and malaria [6]. Although, contamination during the handling, transportation, and storage of drinking water has been documented in large parts of Africa [e.g. 8-10] the chemical characteristics and level of contamination in water sources has been investigated to a lesser extent. In the central and northern regions of Tanzania where the distance to, availability, and types of drinking water sources are highly variable, there are no known studies which have investigated the quality of the water at collection points. Without information on water availability, the quality of that water, and the social factors contributing to illnesses directly related to contaminated water and contamination of water resources, progress to improve conditions in impoverished regions of underdeveloped countries like Tanzania will continue to be impeded.
In addition, disinfection at both the community and household levels are dependent on water characteristics and quality. Solar ultraviolet (UV) disinfection is an example of a household-scale water treatment often suggested to be relatively simple and an environmentally friendly means for eliminating microorganisms responsible for waterborne diseases [11]. This method requires the use of glass or clear plastic bottles and is most effective at destroying bacteria with sunlight between wavelengths of 315 - 400 nm [12]. However, the presence of Total Dissolved Solids (TDS) and Total Suspended Solids (TSS) and therefore the turbidity or level of water clarity, as well as concentrations of iron and manganese can inhibit the effectiveness and overall functioning of UV treatment methods, with turbidity thought overall to be the most limiting factor [13,14].
Here we examine the quality and availability of water sources in two climatologically distinct areas of Tanzania in terms of water source types, their physical and chemical characteristics, and the occurrence of water-borne pathogens as indicated by the presence of Escherichia coli. We specifically examine water for environmental factors that can inhibit disinfection treatments particularly the use of solar radiation and UV-C lamps, two widely used approaches [11]. We did not however, test the effectiveness of disinfection systems with sampled water. In central Tanzania in conjunction with water source data, statistics regarding water collection and storage habits, socio-economic levels, health issues, and school attendance were acquired through interviews with villagers.
2. Materials and Methods
2.1. Study Sites and Sample Collection
The climate of Tanzania is classified as “tropical wet and dry” with rainfall patterns heavily dependent on the movement of the Inter-Tropical Convergence Zone (ITCZ) [15]. One third of the country receives less than 800 mm of rain annually and only one-third of the rest of the country receives more than 1000 mm of precipitation [5]. Northern Tanzania has a bimodal rainfall pattern with a long dry season from June to October, and rains between March-May and October-December [16]. The northern Arusha region of Tanzania has an average monthly rainfall of 40 - 160 mm with around 1000 - 2000 mm per year, but this can be highly variable [16]. The contrasting arid/semi-arid Dodoma region ~438 km to the south is considered to be one of the driest parts of the country with a unimodal rainfall pattern. The short rainy season lasts from December-April with annual rainfall averaging 570 mm and evaporation potentially exceeding rainfall every month [17]. Within the Dodoma region, sampling sites were restricted exclusively to the Kondoa district. The locations of the two study regions are shown in Figure 1 with an inset map of Tanzania.
Water source samples were collected during June 2008 in the Arusha region and samples and interview data during July 2009 in the Kondoa District, Dodoma region. Weather conditions at the time of sampling including air temperature, relative humidity, wind speed and precipitation amounts were obtained from the Tanzanian Meteorological Agency. Samples were taken from all known drinking water sources including those which were also used by livestock. These included waterholes, pipe taps, hand dug wells in dry river beds, rivers proper, and hand pumped wells. In this study hand dug well refers to wells dug in the bottom of dry river beds where water levels varied in depth, depending on fluctuations in groundwater inputs.
Bulk water samples from all sources were collected in sterile 1 liter collapsible plastic carboys and processed as described below for determination of total suspended solids, levels of Fe and Mn, total bacterial concentrations, evidence of coliform bacterial contamination, and specifically the presence of Escherichia coli as an indicator of human enteric pathogens. Microscopic direct counts of bacteria and determination of suspended solids, and Fe and Mn levels were conducted upon return from Tanzania in the School of Marine and Atmospheric Sciences at Stony Brook University. No direct investigation regarding the way these chemical parameters impacted potential disinfection technology used in rural communities was undertaken. In fact, no techniques for water disinfection by inhabitants of any villages in either region were observed. All results presented in this study were meant
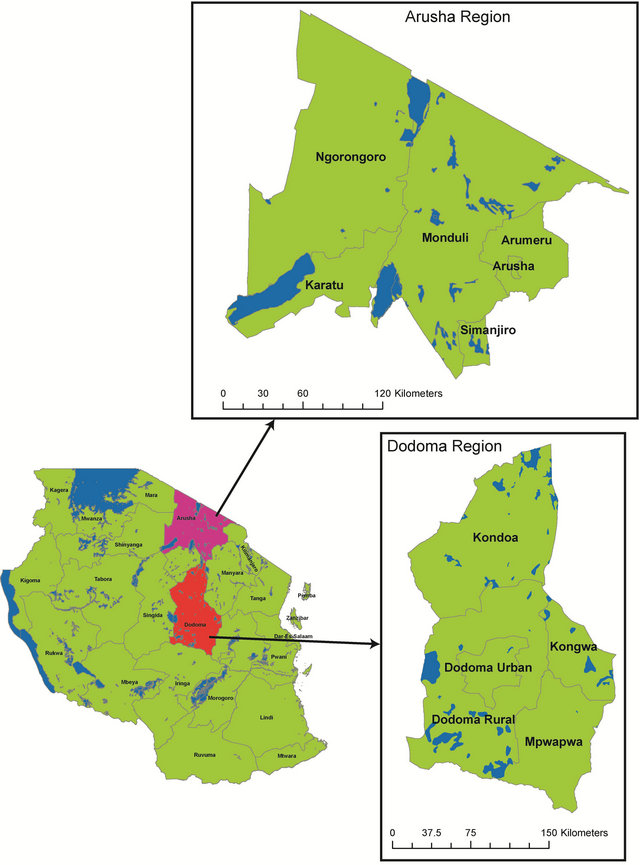
Figure 1. Lower left. Map of tanzania, East Africa with the Arusha and Dodoma regions indicated. Top right: Arusha region with districts included. Bottom right: Dodoma region with districts included.
to evaluate whether UV disinfection would be a viable disinfection approach for treating the existing drinking water sources if available to residents.
2.2. Chemical Characteristics
Water samples for determination of Fe and Mn were immediately filtered after collection through 0.25 μm polycarbonate filters into acid-washed and triple distilled-water-rinsed 60 ml plastic bottles and stored for later analysis. Upon return to the laboratory, stored water samples were acidified with HCl to 0.1 N in the original sample bottle and subsequently analyzed for dissolved Fe and Mn using graphite furnace atomic absorption spectroscopy (GF-AAS) following standard techniques, with programs optimized for the analytical range [18]. Samples for determination of suspended solids were collected by filtering known volumes (~100 ml) of water through previously weighed 0.25 μm GFF filters, which were placed in individual Petri dishes and allowed to air dry before storage and return to the laboratory for weighing.
2.3. Indicator Bacteria Assays
Aliquots of bulk water samples for total counts of bacteria were collected into 25 ml sterile vials and preserved with buffered formaldehyde (final concentration 2%), sealed and stored for return to the laboratory. Bacterial abundances were determined using epifluorescence microscopy after staining water samples with the fluorescent dye 4, 6-diamidino-2-phenylindole (DAPI) [19]. A minimum of 100 cells per slide were counted for each sample with an estimated precision of ±5%. Tests for coliform bacteria were carried out in the field following procedures outlined by the US Environmental Protection Agency monitoring programs under the Safe Drinking Water Act [20]. One packet of the Readycult® Coliform dehydrated, and granulated gamma-irradiated selective culture medium was added to 100 ml of bulk water and incubated at ~37˚C for 24 hours. A color change from yellow to blue was noted as an indication of a positive test. In the case of a color change, confirmation of the presence of E. coli was made by adding 2.5 ml Kovac’s indole reagent and looking for the immediate formation of a red surface layer, which forms with positive reactions.
2.4. Socio-Economic Impacts Interviews
During the July 2009 collection period in the Kondoa district, information including the availability of drinking water, community water sources and resources for obtaining and retaining a regular supply, availability of treatment/disinfection systems, use of boiling to disinfect water, amount of time spent collecting water, incidences of water-related diseases, number of school days missed by children because of illness, and levels of household monetary funds were collected through interviews with the assistance of two Tanzanian translators. Permission was obtained from the chairman of each village and each individual for interviews and to gain access to village pumps, taps or other water sources. Health Insurance Portability and Accountability Act (HIPAA) certification to conduct research on human subjects was obtained by both M. Pizer and D. Aller prior to traveling to Tanzania. Up to ten interviews with heads of households per village were conducted in 10 villages. All sampled water sources were documented by photographs to help ensure subsequent source identification.
2.5. Data Analysis
Principal Component Analysis (PCA) was used to examine relationships between metal concentrations in water sources, bacterial concentrations and the structure of spatial variability, specifically differences between sites, villages and regions. The data matrix was set up with rows (objects) being individual sampling sites in Arusha and Kondoa, and all measured variables arranged in columns. To compensate for the fact that the variables had different units, the data were normalized by subtracting mean values from each column and dividing by their respective standard deviations. From the PCA of all variables for each sampling site, two modes of the principle components and eigenvectors of the data on the same scale a bi-plot [21] was generated to examine relationships between several variables simultaneously. Care was taken in interpreting the results from these matrixes given that relationships due to variables or samples which cannot be easily separated can sometimes occur.
3. Results
3.1. Bacterial and Chemical Characteristics
Total bacterial concentrations varied within and between regions (Figure 2) but were generally higher in hand dug wells and waterholes. Total bacterial abundances were an order of magnitude higher in the majority of the water sources in the Kondoa district than the sources from the Arusha region. In spite of the considerable natural variability in water sources, only three of the eleven water samples from the Arusha region were contaminated with Escherichia coli bacteria, a strong indicator of recent sewage contamination while 18 of the 20 from the Kondoa district showed contamination.
Total suspended solids were elevated in more than half the water sources in both regions exceeding by a factor of 5, the allowable UV treatment limit of 15 mg/L in four locations (Figure 3). Water samples with the highest
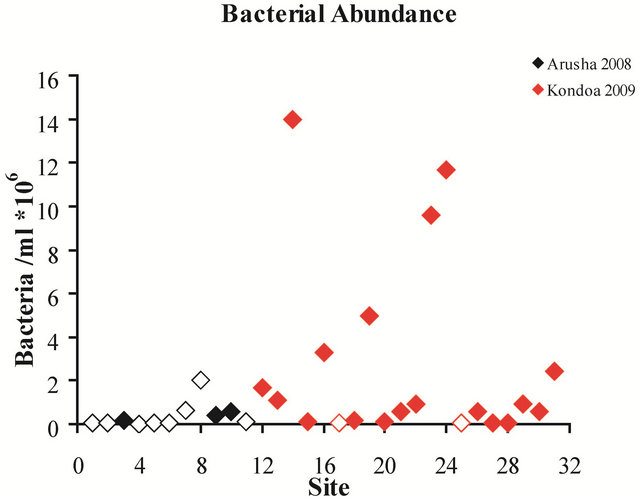
Figure 2. Site number vs. bacterial abundance per milliliter of drinking water. Solid diamonds indicate sites that were positive for E. coli and open diamonds indicate sources which were negative for E. coli.
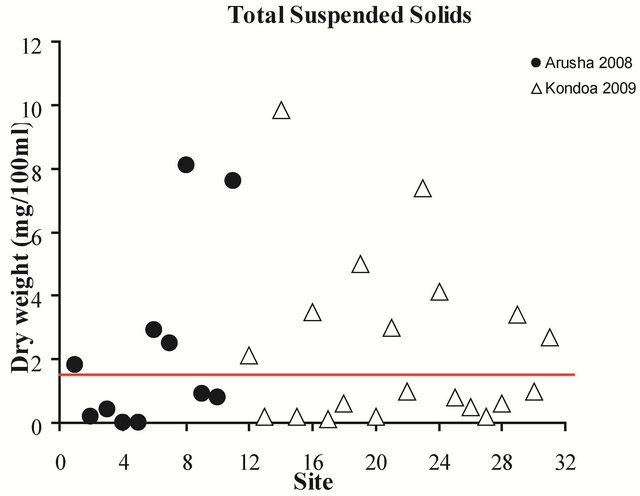
Figure 3. Total suspended solids for all sites, 2008-2009. The red line indicates the allowable limit of suspended solids for UV disinfection, 15 mg/L.
concentrations from 2008 included a waterhole and tap in the Serengeti National Park, while samples from 2009 included a hand dug well and a waterhole. It should be noted that the tap water from the Serengeti National Park was trucked in from outside the Park and the exact location of the original source and type of source used is unknown. Turbidity levels were not quantitatively measured but the appearance of all sources was noted and showed large variability, ranging from very clear to muddy.
Levels of iron varied considerably between water in both regions (Table 1) although overall, the Fe concentrations from the Arusha region were lower than those from Kondoa. Iron concentrations were more variable between types of water sources than between the two regions. Within the Arusha samples the Serengeti tap water had a much higher concentration of Fe than all
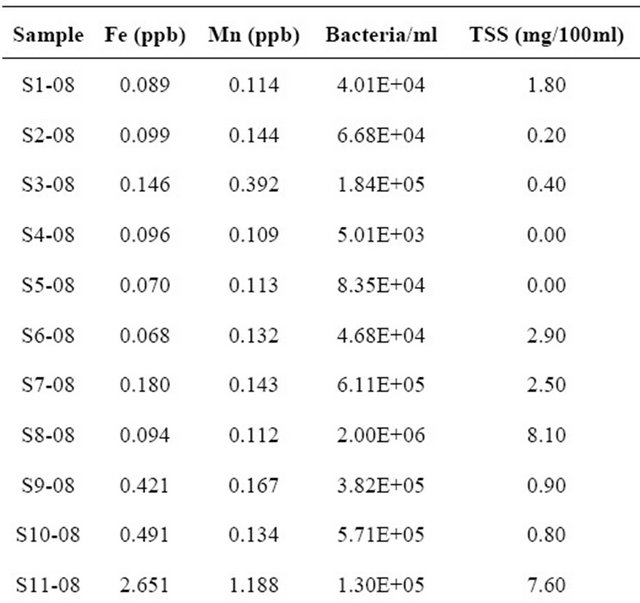
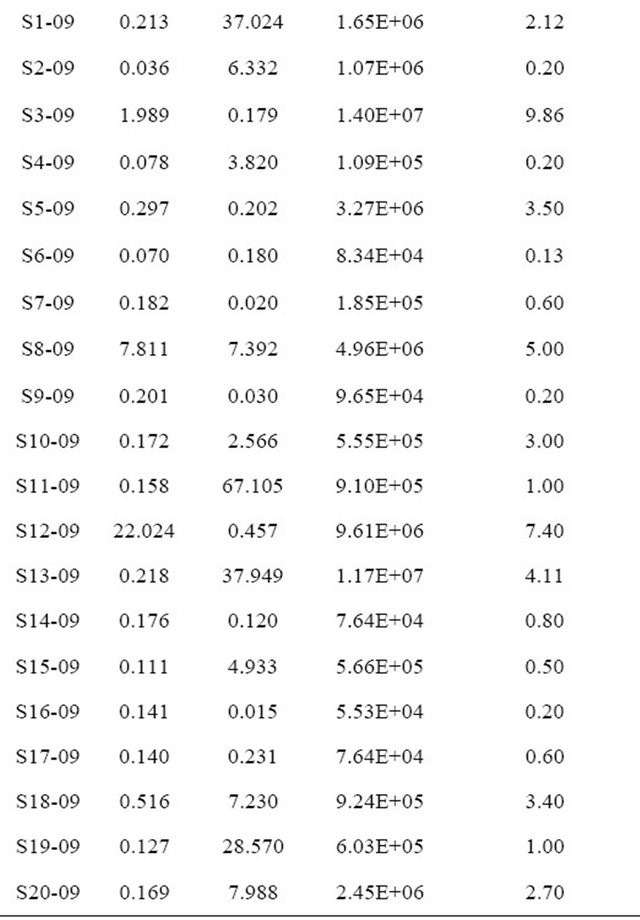
Table 1. Sample site and year with corresponding physical and chemical characteristics value.
other sources. While waterholes tended to have higher bacterial concentrations than all other water sources they all had relatively low Fe levels. None of the eleven sites in the Arusha region exceeded the allowable solar disinfection Fe levels of 4 mg/L, however, two sources from the Kondoa area, a hand dug well and waterhole did exceed the recommended limit. Overall, hand dug wells and waterholes had higher iron concentrations, with one waterhole having a Fe concentration significantly higher than the rest, at >20 ppb of Fe. The taps, rivers and hand pump sources all had a Fe concentration of below 0.5 mg/L.
Mn levels, in contrast to Fe, were much more variable between the two regions than between sources. Water samples collected from the Arusha region had relatively low Mn levels, with no sites exceeding the 4 mg/L threshold for solar disinfection. The Serengeti tap water had the highest Mn level, but still did not exceed the 4 mg/L limit. In contrast, the Mn levels from the Kondoa sites were overall significantly higher than those from the Arusha region with values ranging from 0.015 mg/L to 67.105 mg/L (Table 1). Nine of the twenty Kondoa sites exceeded the 4 mg/L threshold including five of the six hand dug well sources. Concentrations in samples from three hand dug wells were over 30 mg/L Mn, with the highest reading just over 67 mg/L Mn. Interestingly, hand dug wells from the Kondoa area consistently had the highest levels of bacteria in addition to Fe, and Mn. In contrast, water collected from taps and hand pumps from both regions, tended to be low in Fe, Mn and bacteria. While no samples were found to have both high Fe and Mn, all other combinations of Fe and Mn levels were found, i.e. high Mn and low Fe, high Fe and low Mn, etc. Additionally, all possible combinations of Fe, Mn and bacteria concentrations were found, i.e., high Fe + low Mn + high bacteria, low Fe + high Mn + high bacteria, etc.
3.2. Water Disinfection and Evidence of Water-Related Diseases
No treatment/disinfection systems were found in any individual households or villages in either region and among the 87 households interviewed, only 8 reported that they always boiled their water while 46 reported that they never boiled or in any other way disinfected their water and 33 reported sometimes boiling water. Regardless of whether water was boiled or not, all reported incidences of malaria with all but 6 reporting multiple incidences among their children during the previous year. Even boiling did little to reduce the occurrence of diarrhea. All 8 households that reported always boiling water indicated multiple incidences of diarrhea, while 4 of the 46 households which never boiled water reported no diarrhea and 3 of the 33 which sometimes did, reported no diarrhea. Water boiling was also unrelated to incidences of typhoid. No occurrences of typhoid were reported in 28% of households who did not boil water, 48% in household which sometimes, and 37% in those which always boiled water.
The mean, mode and standard deviation of data collected during interviews in individual households regarding eight different variables is presented in Table 2. The number of cases of typhoid per year was the most variable with an average of 24 cases per year but with a mode of only three cases per year. This is consistent with the fact that typhoid occurs more sporadically than either malaria or diarrhea, and that any outbreaks may be isolated incidents. The mode value of both cases of malaria and diarrhea suggest that they both occur on a more consistent basis than typhoid and that they occur in all villages.
The number of buckets of water collected per day varied the least between households and villages, with the average household reporting the collection of 5 buckets of water per day. Income and expenses varied significantly between households, with most homes making roughly $100 USD a year and spending almost $10 USD a month.
3.3. EOF/Biplot Analysis-Human Impacts
The principal component analysis of environmental characteristics suggests that concentrations of Fe, Mn, bacteria and total suspended solids are closely linked with each other (Figure 4). It should be noted that in order to minimize bias all extreme values (anything higher than 3 mg/L) of both Fe and Mn were removed from the PCA. The first principal component explains 35.2% of the variability influenced mostly by a linear combination of concentrations of metals, TSS and bacteria, whereas the second principal component explains 18.8% of the variability mostly controlled by location.

Table 2. Eight of the variables extracted for household interviews with their corresponding mean, mode and standard deviation. All values are per household.
Eigenvectors were heavily skewed by the particularly large Fe and Mn values with removal of these values facilitating interpretation of all environmental characteristics. The PCA results clearly indicate greater variability between water sources than between regions, indicating that the variability in characteristics like iron levels dominate over manganese levels in spite of the fact that in the biplot, Fe and Mn were very closely coupled. Bacterial concentration appeared to be influenced by levels of TSS and not Fe levels. Sites sampled in 2008 were distinct from those sampled in 2009, consistent with the idea of strong regional variability in Tanzania. Two water sources from the 2008 sampling were separate from the cluster. These were sites 8 and 11, a tap in the Serengeti and a waterhole, respectively, with their characteristics being linked more closely to the source than any other environmental variable. It is possible that the actual water source for the tap water collected in the Serengeti Park was also a waterhole, however, this could not be determined. The 2009 samples also formed one general cluster with Sites 5, 10 and 3, lying distinctly outside this group. The outlying position of Site 3, a hand dug well, appears to be strongly dependent on bacterial level, although region also influenced its position in the PCA (Figure 4).
3.4. Interviews
Information obtained during interviews was used to put environmental characteristics into perspective in terms of the vulnerability of the local populace to disease as a result of water quality and/or socio-economic conditions. Answers to questions that were not quantifiable or which provided information not relevant to this particular study are not addressed here.
While the preliminary analysis of data collected from interviews indicate a much greater degree of variability compared with the chemical/physical and microbiological data, the PCA show that the data were fairly consistent. These data are consistent with the finding that malaria and diarrhea share more similar effects than either of them does with typhoid (Figure 5). Diarrhea is more closely linked to the number of missed school days than any other variable (Figure 6). The occurrence of malaria appears to be completely dependent on household expenses/month, a direct reflection of a household’s annual income (Figure 7). Incidences of typhoid per year were correlated with water source type and Mn concentrations (Figure 8).
To further explore the effect of household income on disease occurrence, we plotted incidences of diarrhea versus the household expenses/month assuming that the maximum number of recorded incidences of diarrhea is a fair representation of “maximum risk exposure” at a particular income level, I. Visual inspection of the plot of the data indicated that the relationship between income and maximum risk exposure is either a power or a log function. We used the least squares method to fit a power function as follows:
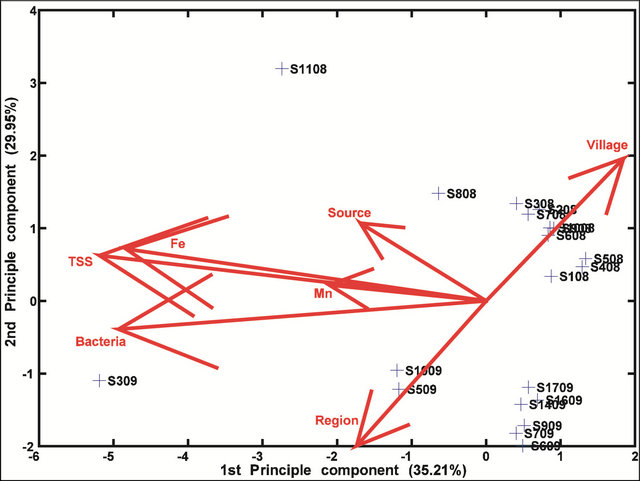
Figure 4. A bi-plot of environmental characteristics with 2008 and 2009 sites indicated. All extreme Mn and Fe values are removed. The eigenvectors represent variables (e.g., bacterial count, iron concentration etc.).
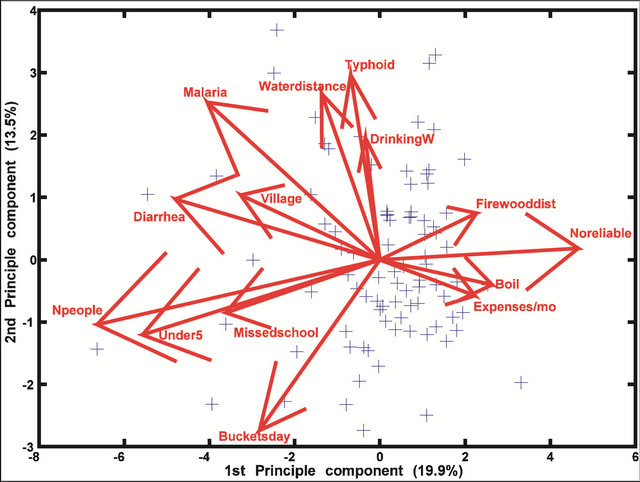
Figure 5. A bi-plot of human impacts and their effect on malaria, diarrhea and typhoid. Eleven eigenvectors represent variables (e.g., number of people in the household, expenses/month etc.). The other three stand for malaria, typhoid and diarrhea.
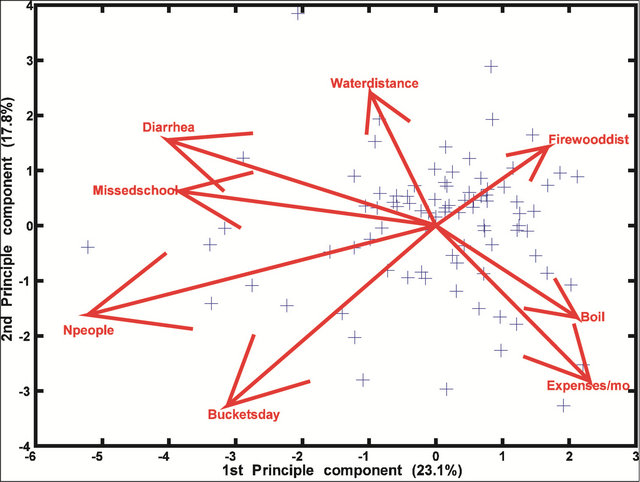
Figure 6. A bi-plot of seven human variables and their effect on diarrhea.
MRE = aI−b
where coefficient a is the conversion factor and coefficient b the exponent representing how fast risk exposure increases as income decreases. While this relationship has previously been recognized, it has never been quantified. We have estimated the coefficients. As is clear in Figure 9, there is a strong relationship between expenses per month and incidences of diarrhea with the majority of the households which spent less than $20 USD a month most often affected.

Figure 7. A bi-plot of seven human variables and their effect on malaria. Note how diarrhea is more closely linked to missed school days than malaria.
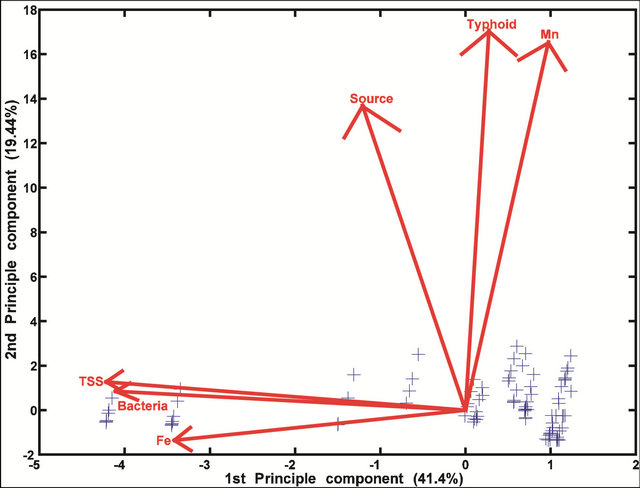
Figure 8. A bi-plot of environmental characteristics and their relationship with typhoid.
4. Discussion
4.1. Water Sources and Microbial Contamination
Reasonable access to water is defined as 20 L of water per person per day from a protected clean source that is no more than l km from the household [22]. In northern and central Tanzania it is clear that most people do not have such access. Other than the public taps, all the other drinking water sources sampled in this study fall under the WHO/UNICEF Joint Monitoring Programme for Water Supply and Sanitation (JMP) classification of
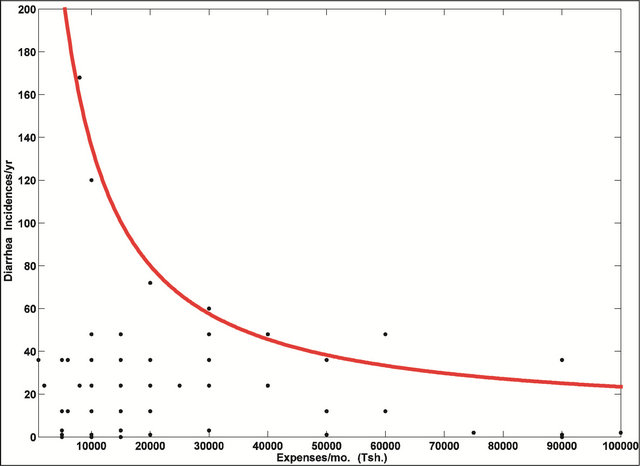
Figure 9. Incidences of diarrhea per year vs. household expenses per month. The majority of households spent an average of 15,000 Tsh/month (~$15 in 2009). The red curve represents the maximum risk exposure to diarrhea for a given income level.
“unimproved” as they were unprotected from outside contamination, in particular from contamination with fecal matter [23].
Even in villages with communal water sources and taps or standpipes, there was no disinfection system other than boiling, which was not even used in 46 of the 87 households interviewed. In fact, there were no other efforts found for purifying water. In addition, even if UV disinfection had been available, its effectiveness would have been limited given the physical and chemical characteristics of the majority of the water sources sampled. The effect of contaminated water sources with no community-wide disinfection program and limited efforts by individual household to ensure portability is that water-borne and water-related diseases account for over half of the diseases affecting the local population [5]. Cases of typhoid were found in this study to occur intermitently with the most common number of cases per year per household being three (Table 2). In contrast both malaria and diarrhea are more constant afflictions with 30 to 40 occurrences per year, respectively.
In addition to the prevalence of contaminated water sources with environmental characteristics which would affect some disinfection methods like UV treatment, this study revealed several issues which should be considered when arguing for a world-wide model which links water-borne diseases to poverty. One would be tempted to think that among poor groups of people who are largely illiterate, this connection would be difficult to detect, but the results of our interviews suggest otherwise. Also, our data suggest that in some regions diarrhea and diarrheal related diseases rather than malaria are more prevalent and should be the primary focus of health-related policies. Additionally, greater positive economic tradeoffs could potentially be realized if the environmental causes of specific human health issues were determined and corrected. This would include knowledge of water collection sources as well as education to address post collection storage.
Water collected from sources with taps and hand pumps had lower levels of bacteria compared with all other water source types. However, the incidences of water-related diseases associated with taps and hand pumps were the same or higher than disease rates associated with all other water sources types that had elevated bacterial levels. These data suggest that the people themselves are contributing to the contamination of their drinking water through handling and/or storage. Typically local people use any container available for the collection and storage of water and this usually means a large plastic jerry can that once held cooking oil although it often includes buckets and smaller plastic bottles. The degree of cleanliness of these containers was not quantified but the evidence just described suggests that water sources themselves are not always the source of contamination. While 8 of the 87 households interviewed stated they always boiled their water these households still reported incidences of diarrhea and typhoid. This suggests that the boiled water was either not stored in clean containers, handling practices after purification were inadequate, or that infections came from contaminated food. A study conducted in South Africa revealed that most households store their water for 48 hours, sufficient time for coliform or typhoid bacteria to survive and multiply on the containers themselves [24]. This evidence and our results support that contaminated containers may be the primary reason for high disease prevalence in the households interviewed in this study. Additional research conducted by the Department of Water Affairs and Forestry (DWAF) in South Africa, found a link between water turbidity levels and the growth of microorganisms [25]. Although not directly measured in this study, a qualitative ranking of water clarity was consistent with the fact that murkier water sources more often tested positive for coliform bacteria than did clear water sources.
By the most recent estimates Tanzania is among the African countries on track to meet the Millennium Development Goal (MDG) target for drinking-water supply and sanitation by 2015 [26]. This is largely because of investment and infrastructure improvements in urban areas allowing for 79% of the population to have improved access to drinking water. However, in rural areas improved drinking water is accessible for only 44% of the population [26]. Clearly, there is a drastic difference between drinking water access for urban and rural inhabitants, with this even more dramatic when you consider the fact that over 80% of Tanzanians live in rural areas [27]. Obviously, taking advantage of an improved drinking-water source which is protected from outside contamination, particularly from fecal matter would be optimal for decreasing the incidences of diarrhea and other water borne diseases which is the goal of the WHO/UNICEF Joint Monitoring Programme for Water Supply and Sanitation (JMP). Nevertheless, in addition to boiling water and storing it in clean containers, separating drinking water from water used for other purposes would even help in disease prevention. This may seem straightforward but in the context of a poor rural environment where the goal is just to have enough water to complete basic daily tasks, the people do not always directly relate incidences of diseases with water sources, the cleanliness of storage containers, or not washing hands after defecating and before handling water containers. Also, while attention may even be given to personal cleanliness and proper maintenance of storage containers and people may even know that their water source is unimproved and making them sick, they may have no alternative water source [28]. In this study, information on both boiling water and separating water by use were collected through interviews, they could not be independently verified. PCA, however, revealed no points which were out of the ordinary and all data were relatively consistent suggesting that consistent answers were given by all households. Without written records, it would be difficult for anyone in a household to recall all incidences of infection and disease or school absences. Additionally, with a high frequency of illness and/or long period of infection, an individual or parents may simply lose track or stop counting, and this may be especially true if they have multiple children. Whether interviewees told the truth is not clear, however it was apparent that water sanitation methods including separating drinking water from washing water, boiling water, and washing hands before handling water containers were not generally considered and thus must be taught to both adults and children. Furthermore if there is lack of soap and wood or alternate fuel for boiling water in addition to sufficient water, and families have no monetary means to obtain theses resources it is unlikely that even if known, safe sanitation practices could be utilized. This is a prime example that shows that water policies cannot be generalized for the whole country. They must be designed and translated according to the local context. While there are a number of unknowns, what is unambiguous, is that improper handling of drinking water directly aids in the occurrence and transmission of water-related diseases because it has been shown that by implementing hand washing, diarrheal diseases can be cut by as much as 45% [29].
The concentrations of total bacteria based on direct counts, found none of the samples from taps and hand pumps to be heavily contaminated. This is likely because the source of water, a natural bore hole is an “improved” water source and not an open air site that is accessible to wild animals and humans and therefore contaminated with fecal matter. It is intriguing, that waterholes had low bacterial counts, as one might assume that as open and unprotected water sources used regularly by livestock and water fowl, they would have elevated bacterial abundances. With the constant presence of fecal matter and as a waste runoff collection point from surrounding land during rain events, waterholes could reasonably support high bacteria levels. However, because they are open not closed sources, regular exposure to natural UV radiation from sunlight may help to control bacterial abundances. Nevertheless, contamination levels can be expected to vary. Waterhole and river bed sources in Kondoa district overall had higher levels of suspended solids than in Arusha region, likely due to the drier conditions and lower water levels. This is consistent with the finding that all water sources examined had higher levels of TSS in the dry season than in the wet season [30].
4.2. Contamination and Water Characteristics
Greater variability was found between combined effects of Fe, Mn, and bacterial concentrations within regional water sources than between regions. This does not appear to be due to any bias from extreme values of Fe and Mn. Even after excluding Fe and Mn extreme values from the PCA (Figure 4), the data still show strong variability of these characteristics between both sources and regions, but with greater variability between sources than regions Extremely high levels of Fe and low levels of Mn, as well as low levels of Fe and high levels of Mn suggest water sources where either Fe or Mn has been preferentially mobilized or removed. This supports the idea that villagers are either tapping into different regions of aquifers having different stages of redox (oxidation-reduction) reaction evolution (successive dissolution of Mn and Fe minerals during progressive reduction) or are accessing source rock and soil that are relatively enriched in Fe or Mn. Water may also lose Fe2+ preferentially to Mn2+ during initial exposure to well-oxygenated conditions as solutions emerge from soil (e.g., precipitation of Fe-oxides before Mn-oxides during progressive oxidation) [31]. The Serengeti tap water sample from the Arusha region had an extremely high level of Mn in addition to suspended solids which may reflect redox conditions of the water source, the nature of the soil and rocks surrounding the collection site, or some type of external contamination. It seems unlikely that contamination occurred during sample analysis as this sample was treated in a similar manner to all other samples.
There is a strong association between Mn and incidences of typhoid as shown in Figure 8. This relationship is consistent with the idea that stagnation, together with the presence of human pathogens (including Salmonella typhi) promotes the development of reducing conditions which in turn enable Mn dissolution. S. typhi is able to consume organic substrates from fecal contamination, taking up oxygen in the process, but can also tolerate a range of redox conditions as a facultative anaerobe. While Salmonella can survive for weeks outside the human body, flushing of the contaminated water coupled with natural UV radiation from sunlight will temporarily eliminate pathogens while reoxygenating the water and reducing Mn levels.
While obviously more optimal for acquiring water, there is usually a cost to maintain taps and hand pumps. Villagers must pay per bucket of water, making them infrequently used because people cannot afford to pay for water, and the amount of water released from these sources is controlled by a person of authority in the village. This may be a critical reason for why there are low bacterial numbers and little evidence of contamination at these sources. In some villages there were pumps, but they had not been maintained and for lack of any financial support from the central government, the villages were not able to afford repairs. We propose that this can be easily solved by village water committees issuing three-year contracts to private water management companies. In order to make profit the companies would have to maintain the pumps. This has been done successfully elsewhere in Africa [32].
Data for this study were collected during the dry season in both 2008 and 2009. Had water sample collection occurred during the wet season, environmental characteristics of the water sources would likely have been different as suggested by seasonal studies in Nigeria [30]. Well water sources in villages dried out more quickly during the dry season, leaving women to walk to distant sources, stand in line until the water level was replenished, or return later in the day for water. In fact, women and children had to allocate an average of 2.5 hours every day to gathering water. This is at least twice as long as the average time estimated by various agencies for water collection round trips in rural areas of 35 African countries made during 2005 and 2006 surveys by Demographic and Health Surveys, Multiple Cluster Indicator Surveys, and World Health Surveys [23]. During the dry season in particular, not only do people have to walk further to collect water, as more and more natural water sources dry up, but less preferable water sources such as waterholes shared with livestock may be increasingly collected from. Additionally, households adapt to the dry season water scarcity by reducing the amount of water used for hygiene and other cleanliness purposes or completely eliminating them, as has been reported for households in rural Nigeria [33].
They also found that in the dry season there was a greater chance of households using contaminated water than during the wet season, and that the scarcity of water coupled with poor handling practices most likely the cause of increased cases of diarrhea. Hygiene and cleanliness practices per se were not recorded in this study, however, dry season handling practices coupled with greater numbers of cases of water-related disease reported during interviews may well have been due to the scarcity of water. Additional consequences of increased illness during the dry season are reflected in greater numbers of school absences and decreased total household productivity defined as participation in farm work, house repair/building or any other economic activity.
The significantly higher bacterial concentrations in the water sources in the Kondoa area are consistent with the scarcity of water since all samples were collected during the dry season and may also reflect increased organic loading due to continual fecal contamination mainly by livestock and wild animals visiting unprotected water sources. Also contributing to the regional differences is the greater rainfall amounts in the more northern region of the country, which periodically flush contaminating microorganisms from water sources. The more mountainous terrain in the north ensures a greater supply and longer period of water availability, and this likely helps to maintain lower concentrations of organic matter and thereby lower bacterial abundances. Differences in terrain and greater rainfall in the north are also consistent with higher overall Fe concentrations in the Arusha water sources due to the dissolution of iron in water as it flows through soil into wells, waterholes, or other water reservoirs.
As alluded to earlier, conclusions based on the results of PCA must take into consideration the fact that this technique cannot distinguish associations between variables and those between samples. Nevertheless, PCA results clearly show that diarrhea has the strongest influence on the number of missed school days per year than either malaria or typhoid. This is a surprising result as malaria has long been considered the leading cause of missed school days [34]. Within the households interviewed, however, the frequency of diarrhea was higher than that of malaria (Table 2). Although this finding may be biased as it is only representative of select villages in one district, it is an intriguing point that should be further investigated. On the other hand, the results could be proof of success of the anti-malaria campaign known as “Indoor Residual Spraying” for some African countries including Tanzania, initiated by the former US president G. W. Bush in 2005.
It is well known that income plays a significant role in all aspects of a families’ quality of life including education level, interest in education for children, attention to sanitary practices including latrine maintenance, bathing and hand washing, incidences of disease, and access to basic resources including food and health care. Information collected in this study supports this relationship with the finding that the lower a family income, the more days a year a child misses school. This could be the result of illness, however, it could also reflect the requirement of children to help with tasks at home such as washing, collecting water and crop harvesting, or any number of other factors including general disinterest. National censuses and nationally representative household surveys from 18 African countries collected in 2005 and 2006 confirm the fact that in 1 out of 7 households, children (boys and girls) are mainly responsible for collecting drinking water, with girls almost twice as likely to be drawers than boys [23]. However, the general trend in our data was that as income increased, school attendance and boiling of drinking water increased and incidences of diarrhea, malaria and typhoid decreased. As primary education in Tanzania is free, there are likely many factors influencing school attendance with water-borne diseases being only one. Previous studies have found that in addition to the poor state of water supply, inadequate sanitation facilities in schools is a major factor contributing to poor attendance [35]. Additionally, the lack of privacy and safety for girls needing toilets discourages a number of them from attending schools in Tanzania particularly during menstruation periods [35], consistent with similar findings in the Middle East [28]. While there were no data collected in this study on whether the child who missed school was male or female it is an important consideration for future studies.
The average annual income of people interviewed in this study was 180,000 Tanzanian shillings (Tsh) ($180 USD in 2009), with an average spending of 15,000 Tsh ($15 USD in 2009) per month (see Figure 9). Based on interviews, it appears that having an income that allows for expenses per month over Tsh 50,000 (roughly $50 US dollars in 2009), an amount available for a much smaller percentage of the population, plays a significant role in school attendance and incidences of water-borne diseases.
Here we extend the concept introduced by Myers and Patz [36] that links ecosystem services to an individual’s health. We introduced a non-linear function that ties the occurrence of diarrhea as an indicator of water-related diseases, to house-hold income level to objectively design and assess goals for water-related diseases and poverty reduction. There is a clear link between water-related diseases and poverty [37], and although this information is not new (e.g., [38]), as far as we know this is the first study to determine the parameters of the function quantitatively describing the relationship.
Myers and Patz [36] suggest that while ecosystem services including food production and clean water are strongly correlated with an individual’s health, that this relationship is not linear. Their conceptual model proposes that when resources are constrained, a small increase or decrease in the availability of already limited resources results in dramatic changes in the health status of individuals. Because the availability of ecosystem services including adequate food, water, fuel, and building materials cannot be easily quantified we have used expenses per month as a measure of an individual’s ability to utilize the ecosystem services.
Our results summarized in Figure 9 support the Myers and Patz [36] model. We propose that the maximum risk exposure to diarrhea (and by analogy, to all water-related diseases) can be represented as a power function of income/expense. Using this approach we can determine how much income (in local currency) per person in the bottom half of the income bracket, would need to be increased to reduce by half, their risk of water-related diseases. By taking advantage of this model, governments and international organizations could help set realistic self-sustaining goals. For example, if household expenses/month increased from Tsh 10,000 - 20,000 there is a direct decrease in maximum risk exposure for diarrhea from 134 to 80 occurrences/year, whereas expenses/month increase from Tsh 70,000 - 80,000 corresponds to a decrease of roughly only four (i.e., 34 - 30) occurrences/year. These results suggest that government policies need to be focused on supporting the very low income groups in order to maximize their impact in decreasing the number of people exposed to water-related diseases. In a district like Kondoa for example, public health could be vastly improved if the government could find a sustainable economic activity that would increase the earning potential of the lowest income generating villagers by 25%, increasing their monthly expenses from Tsh 15,000 to at least Tsh 20,000.
Assessing the potential for implementation of water treatment methods specifically the use of UV disinfection was one of the motivations for this study. To design an effective system for both solar UV disinfection and the use of UV-C lamps, the overall microbiological community and knowledge of levels of specific inhibiting characteristics of the water must be taken into account. The presence of suspended particles both inorganic and organic in water sources for example, can make (UV) disinfection ineffective by absorbing and scattering the UV light, and by harboring bacteria and protecting them from the UV light [39]. Effective UV treatment requires Total Suspended Solids levels not to exceed 15 mg/L, turbidity 40 mg/L (~5NTU), and levels of Fe and Mn must not exceed 4 mg/L [14]. We found that 18 of 31 sources exceeded the corresponding Fe, Mn and/or TSS UV disinfection thresholds and would not be able to support UV disinfection without pretreatment. For the eight sources which only exceeded the TSS threshold, villages could pretreat by filtration with a system already employed by rural women in other developing nations, e.g., Kenya. These methods utilize local plants including Moringaoleifera, Vignaunguiculata and Parkinsoniaaculeata which are known to coagulate and remove suspended solids from water initially containing medium to high turbidity [40,41].
An attractive alternative method to UV disinfection at the individual household level is the construction of sand storage dams to catch surface runoff [42]. The water collected in the dam reservoir flows by gravity through a solar reactor which reflects both direct and diffuse UV radiation onto clear pipes to disinfect water before discharge into storage tanks. Not only does this system provide a more stable supply of water particularly during the dry season and periods of drought, but it can provide disinfected water helping to decrease incidences of water related illnesses.
5. Conclusion
The availability of water in northern and central Tanzania is limited and the overall quality poor. In rural villages with wells and communal piped water there is a lack of funding for maintaining pumps forcing people to spend hours walking to find water. While our findings suggest that there is significant contamination of drinking water from all source types, further contamination likely occurs during storage and handling. The highest concentrations of Mn, Fe and bacteria were associated with hand dug wells. E. coli was present more often in water sources in the dry Kondoa district than the wetter Arusha region, likely linked to greater organic loading and decreased fresh water exchange particularly during the dry season. There is anecdotal evidence to show that Mn association with typhoid is a manifestation of chemically reducing conditions in water sources. Diarrhea and not malaria was found to be the major cause of missed school days during the dry season. We derive a quantitative relationship between incidences of diarrhea and income level as a hyperbolic function. This implies there can be a more than 40% deduction in the incidences of diarrhea per year when a household’s average expenses per month increase from US $10 to 20. Strong evidence was found for interdependencies between water-related diseases and poverty, suggesting the need for developing countries and international aid agencies to concurrently address these issues. Finally, the potential for effective UV disinfection would be possible for approximately 12 of the 31 water sources tested with an additional eight sources benefitting if pretreatment was used to initially reduce turbidity.
6. Acknowledgements
Travel support came from Undergraduate Research and Creative Activity (URECA) program grants to M. Pizer and D. Aller and the National Science Foundation Research Experience for Undergraduate Grant (OCE- 0755069) to J. Y. Aller covered the costs of supplies and analyses. We would like to thank Robert Wallace for assisting us in the field and Karen Kernan, Director of URECA at Stony Brook University for her support and encouragement. We are grateful to Drs. Jasper Ijumba and Mugassa Rubindamayugi, University of Dar es Salaam for help with obtaining permits and to our translators for logistical support in the field. We thank S. Rahman and R. Aller for assistance with Fe and Mn analyses.
REFERENCES
- United States Census Bureau, “World POPClock Projection,” 2011. http://www.census.gov/population/popclockworld.html
- L. Browne, “Outgrowing the Earth: the Food Security Challenge in an Era of Falling Water Tables and Rising Temperatures,” Earthscan, London, 2005.
- United Nations Development Programme (UNDP), “Human Development Report 2007/2008 Fighting Climate Change: Human Solidarity in a Divided World,” Palgrave Macmillan, New York, 2008.
- P. Gleick, “World’s Water 2004-2005,” Island Press, Washington DC, 2004.
- K. M. Lwiza, “Achieving Sustainable Access to Clean Water in Tanzania: Introduction,” In: K. M. Lwiza Ed., Achieving Sustainable Access to Clean Water in Tanzania: Impact on Human health, Proceedings of the Tanzania Water, Health & Environment Symposium, Stony Brook, New York, 2008, pp. 1-4.
- R. Mukandala, “Policy Issues on Environment, Water and Human Health in Tanzania,” In: K. M. Lwiza, Ed., Achieving Sustainable Access to Clean Water in Tanzania: Impact on Human Health, Proceedings of the Tanzania Water, Health & Environment Symposium, Stony Brook, New York, 2008, pp. 7-13.
- The United Republic of Tanzania (URT), “The National Water Policy: Ministry of Water and Livestock Development,” The United Republic of Tanzania, Dar es Salaam, 2002.
- P. K. Jensen, J. Ensink, G. Jayasinghe, W. van der Hoek, S. Cairncross and A. Dalsgaard, “A Domestic Transmission Routes of Pathogens: The Problem of In-House Contamination of Drinking Water during Storage in Developing Countries,” Tropical Medicine and International Health, Vol. 7, No. 7, 2002, pp. 604-609. doi:10.1046/j.1365-3156.2002.00901.x
- J. Wright, S. Gundry and R. Conroy, “Household Drinking Water in Developing Countries: A Systematic Review of Microbiological Contamination between Source and Point-of-Use,” Tropical Medicine and International Health, Vol. 9, No. 1, 2004, pp. 106-117. doi:10.1046/j.1365-3156.2003.01160.x
- S. Rufener, D. Mausezahl, H. J. Mosler and R. Weingartner, “Quality of Drinking-water at Source and Point-ofConsumption—Drinking Cup as a High Potential Recontamination Risk: A Field Study in Bolivia,” Journal of Health, Population and Nutrition, Vol. 28, No. 1, 2010, pp. 34-41. doi:10.3329/jhpn.v28i1.4521
- P. F. Ibáñez, “Solar Disinfection of Drinking Water,” Course on: Innovative Processes and Practices for Wastewater Treatment and Re-Use 8-11, Ankara University, Ankara, 2007.
- C. G. Okpara, N. F. Oparaku and C. N. Ibeto, “An Overview of Water Disinfection in Developing Countries and Potentials of Renewable Energy,” Environmental Science and Technology, Vol. 4, No. 1, 2011, pp. 18-30. doi:10.3923/jest.2011.18.30
- R. G. Qualls, M. P. Flynn and J. D. Johnson, “The Role of Suspended Particles in Ultraviolet Disinfection,” Water Pollution Control, Vol. 55, No. 10, 1983, pp. 1280-1285.
- W. J. Masschelin, “Use of Ultraviolet for Disinfection of Drinking Water,” In: R.G. Rice, Ed., Ultraviolet Light in Water and Wastewater Sanitation, Lewis Publishers, Florida, 2002, pp. 59-112. doi:10.1201/9781420032178.ch3
- M. Zhang, “Effects of Climate Change on Water Availability,” In: K. M. Lwiza, Ed., Achieving Sustainable Access to Clean Water in Tanzania: Impact on Human health, Proceedings of the Tanzania Water, Health & Environment Symposium, Stony Brook, New York, 2008, pp. 15-19.
- A. Debien, S. Neerinckx, D. Kimaro and H. Gulinck, “Influence of Satellite-Derived Rainfall Patterns on Plague Occurrence in Northeast Tanzania,” International Journal of Health Geographics, Vol. 9, No. 60, 2010, pp. 1-10.
- J. P. Hella, G. van Huylenbroeck and M. E. Mlambiti, “Small Farmers’ Adaptive Efforts to Rainfall Variability and Soil Erosion Problems in Semiarid Tanzania,” Journal of Sustainable Agriculture, Vol. 22, No. 1, 2003, pp. 19-38. doi:10.1300/J064v22n01_03
- Perkin-Elmer Corporation, “Analytical Methods for Atomic Absorption Spectroscopy,” 1964.
- K. G. Porter and Y. S. Feig, “The Use of DAPI for Identifying and Counting Aquatic Microflora,” Limnology and Oceanography, Vol. 25, No. 5, 1980, pp. 943-948. doi:10.4319/lo.1980.25.5.0943
- United States Environmental Protection Agency (USEPA), “Analytical Methods Approved for Drinking Water Compliance Monitoring under the Total Coliform Rule Approved Methods for the Total Coliform Rule—National Primary Drinking Water Regulations,” 2009. http://www.epa.gov/ogwdw/methods/pdfs/methods/methods_tcr.pdf
- R. A. Reyment and K. G. Joreskog, “Applied Factor Analysis in the Natural Sciences,” Cambridge University Press, Cambridge, 1996.
- World Health Organization, “Water Supply and Sanitation Sector Report 2000 Africa Regional Assessment,” 2000. http://www.afro.who.int/indexphp?option=com_docman&task=%20doc_download&gid=2148
- UNICEF and World Health Organization, “A Snapshot of Drinking Water and Sanitation in Africa,” A Regional Perspective Based on New Data from the WHO/UNICEF Joint Monitoring Programme for Water Supply and Sanitation, Prepared for African Ministers’ Council on Water (AMCOM), Cairo, 2008.
- M. Momba and P. Kaleni, “Regrowth and Survival of Indicator Microorganisms on the Surfaces of Household Containers Used for the Storage of Drinking Water in Rural Communities of South Africa,” Water Research, Vol. 36, No. 12, 2002, pp. 3023-3028. doi:10.1016/S0043-1354(02)00011-8
- Department of Water Affairs and Forestry (DWAF), “South African Water Quality Guidelines for Domestic Use,” 2nd Edition, Pretoria, 1996. http://www.dwaf.gov.za/IWQS/wq_guide/domestic.pdf
- UNICEF and World Health Organization, “Progress on Drinking Water and Sanitation: 2012 Update,” Prepared for African Ministers’ Council on Water (AMCOW), Fourth Africa Water Week, Cairo, 2012. http://www.wssinfo.org/fileadmin/user_upload/resources/Africa-AMCOW-Snapshot-2012-English-Final.pdf
- The United Republic of Tanzania National Website, “Water,” 2013. http://www.tanzania.go.tz/waterf.html
- F. Pearce, “When Rivers Run Dry: Water—The Defining Crisis of the Twenty First Century,” Beacon Press, Boston, 2006.
- T. Rosenberg, “Burden of Thirst, National Geographic Water: Our Thirsty World: A Special Issue,” National Geographic, 2010, pp. 102-111. http://ngm.nationalgeographic.com/2010/04/water-slaves/rosenberg-text
- S. I. Efe, F. E. Ogban, M. Horsfall and E. Akporhonor, “Seasonal Variations of Physico-Chemical Characteristics in Water Resources Quality in Western Niger Delta Region, Nigeria,” Journal of Applied Sciences and Environmental Management, Vol. 9, No. 1, 2005, pp. 191- 195.
- D. J. Burdige, “Geochemistry of Marine Sediments,” Princeton University Press, Princeton, 2006.
- Water and Sanitation Program, “Sustainable Management of Small Water Supply Systems in Africa Practitioners,” Workshop Report, Maputo, 6-8 October 2010, pp. 1-16.
- A. Nyong and P. S. Kanaroglou, “A Survey of Household Domestic Water-Use Patterns in Rural Semi-Arid Nigeria,” Journal of Arid Environments, Vol. 49, No. 2, 2001, pp. 387-400. doi:10.1006/jare.2000.0736
- C. Leighton and R. Foster, “Economic Impact of Malaria in Kenya and Nigeria,” Applied Research Paper, No. 6, Abt Associates Inc. in Collaboration with Vector Biology Control Project, Medical Services Corporation International, Health Financing and Sustainability (HFS) Project, Bethesda, 1993.
- W. Malima, “Water and Sanitation in Tanzanian Schools— Linking Sanitation, Health and Education,” Bremen Overseas Research and Development Association, Bremen, 2009.
- S. Myers and J. Patz, “Emerging Threats to Human Health from Global Environmental Change,” Annual Review of Environment and Resources, Vol. 34, No. 1, 2009, pp. 223-252. doi:10.1146/annurev.environ.033108.102650
- J. Sachs and P. Malaney, “The Economic and Social Burden of Malaria,” Nature, Vol. 415, No. 6872, 2002, pp. 680-685. doi:10.1038/415680a
- D. Filmer, “Fever and Its Treatment in the More and Less Poor in Sub-Saharan Africa,” Development Research Group, The World Bank, Washington DC, 2000.
- N. Narkis, R. Armon, R. Offer, F. Orshansky and E. Friedland, “Effect of Suspended Solids on Wastewater Disinfection Efficiency by Chlorine Dioxide,” Water Research, Vol. 29, No. 1, 1995, pp. 227-236. doi:10.1016/0043-1354(94)E0117-O
- J. P. Sutherland, G. K. Folkard and W. D. Grant, “Seeds of Moringa Species as Naturally Occurring Flocculants for Water Treatment,” Science, Technology, and Development, Vol. 7, No. 3, 1989, pp. 191-197.
- N. Marobhe, G. Dalhammar and K. Gunaratna, “Simple and Rapid Methods for Purification and Characterization of Active Coagulants from the Seeds of Vignaunguiculata and Parkinsonia aculeate,” Environmental Technology, Vol. 28, No. 6, 2007, pp. 671-681. doi:10.1080/09593332808618827
- L. Gill and C. Price, “Preliminary Observations of a Continuous Flow Solar Disinfection System for a Rural Community in Kenya,” Energy, Vol. 35, No. 12, 2010, pp. 4607- 4611. doi:10.1016/j.energy.2010.01.008
NOTES
*Corresponding author.