Journal of Environmental Protection
Vol.3 No.11(2012), Article ID:24711,19 pages DOI:10.4236/jep.2012.311160
Using the Dual Energy Gamma-Ray Transmission Technique to Measure Soil Bulk Density and Water Content of Central Southwestern Nigerian Soils
![]()
1Department of Physics and Solar Energy, Bowen University, Iwo, Nigeria; 2Centre for Energy Research and Development, Obafemi Awolowo University, Ile-Ife, Nigeria.
Email: *ladiadej@yahoo.co.uk
Received July 6th, 2012; revised August 8th, 2012; accepted September 7th, 2012
Keywords: Dual Energy; Gamma-Ray; Bulk Density; Water Content; Radiological; Attenuation Coefficient
ABSTRACT
In this work, a radiological technique which simultaneously measures soil bulk density and water contents accurately and quickly in a non-destructive manner at different depths of the soil profile of the major soil series of Central Southwestern Nigeria is developed. Undisturbed samples from Iwo, Ondo, Egbeda, Itagunmodi, Okemessi, Mamu, Origo and Jago soil series of Southwestern Nigeria were collected on monthly intervals from June 2006 to May 2007. Using gamma-ray energy pairs of 122 and 1112 keV; and 344 and 1408 keV obtained from europium-152 (152Eu) radionuclide, the attenuation coefficients for soil and water,  and consequently
  and
and  at varying soil depths of these series were calculated. Comparative gravimetric measurements of these soil parameters were carried out. Using the XCOM computer algorithm with the soil elemental concentrations obtained using the Energy Dispersive X-Ray Fluorescence analysis (EDXRF) technique, theoretical estimates of
  for the various soil series were obtained and compared with the experimental values. The result of the developed dual energy gamma-ray transmission technique was compared with the gravimetric measurement method and Pearson correlation coefficient (0.987, p < 0.001) was obtained for
  and (0.996, p < 0.001) for
 . The results of the measurements showed that
  minima with values 0.1931, 0.1987, 0.2377, 0.2111, 0.1738, 0.1701, 0.2334, 0.2341 and minima
  values of 1.21 g/cm3, 1.20 g/cm3, 1.02 g/cm3, 1.38 g/cm3, 1.12 g/cm3, 1.14 g/cm3, 0.64 g/cm3, 1.33 g/cm3 were obtained respectively for the soil series stated above in January. The maxima
  with values 0.3621, 0.4212, 0.3962, 0.3794, 0.3049, 0.2811, 0.4415, 0.4416 and maxima
  values of 1.52 g/cm3, 1.67 g/cm3, 1.74 g/cm3, 1.69 g/cm3, 1.70 g/cm3, 1.68 g/cm3, 1.08 g/cm3, 1.54 g/cm3 occurred for these soil series respectively in July except for Mamu soil series which occurred in May. These correlated very well with the occurrence of the Dry and Rainy seasons in the study area. The results of the EDXRF analysis showed that maxima Iron, Fe concentrations of 5.0890 ppm at the depth of 90 - 120 cm into the soil profile, was obtained for Iwo series, 4.4691 ppm at 50 - 70 cm for Ondo, 6.3438 ppm at 15 - 30 cm for Egbeda, 6.6845 ppm at 30 - 50 cm for Itagunmodi, 5.0252 ppm at 90 - 120 cm for Okemessi, 3.4996 ppm at 30 - 50 cm for Mamu, 5.1191 ppm at 50 - 70 cm for Jago and 4.7193 ppm at 90 - 120 cm for Origo. Maxima Potassium, K concentrations of 2.9613 ppm at the depth of 50 - 70 cm, was obtained for Iwo soil series, 2.3315 ppm at 0 - 15 cm for Egbeda, 2.2763 ppm at 70 - 90 cm for Okemessi and 3.3636 ppm at 50 - 70 cm for Mamu. Maxima Ti concentrations of 1.4822 ppm at 0 - 15 cm was obtained for Ondo soil series, 2.5159 ppm at 15 - 30 cm for Egbeda, 1.8690 ppm at 90 - 120 cm for Itagunmodi, 2.2975 ppm at 15 - 30 cm for Okemessi, 1.6453 ppm at 0 - 15 cm for Jago and 1.0513 ppm at 30 - 50 cm for Origo.
1. Introduction
Soil water and bulk density is an important feature of the physical environment, and its measurement has long proved a difficult task, both from the instrumental aspect and the measurement itself, because of the great complexity of the soil body. Hitherto, in Southwestern Nigeria, these soil physical parameters have been measured independently using the standard gravimetric method, which requires a minimum period of twenty-four (24) hours to make measurements (as the wet soil sample must be oven-dried at 105˚C for 24 hours to expel water from it). This method is destructive, making repeat measurements on the same soil sample impossible. Developing a radiological method (using the dual-energy gamma-ray transmission technique) of simultaneously measuring these two parameters quickly (by eliminating the 24-hour drying period) and accurately (by judiciously choosing the pairs of energies that will optimize measurements) without destroying the sample is presented in this work. The use of two pairs of dual-energies from a single multi-energy gamma-ray source, the Europium- 152 (152Eu) radionuclide for the simultaneous measurements of these soil parameters was explored in this work. Since soil bulk density and water contents are dynamic and variable parameters both in space and time and with soil management that specific values can hardly be associated with a soil type, then this practical technique being developed, having, time and simultaneity advantages over the gravimetric method should lay the foundation for a continuous monitoring of these parameters. Regular monitoring and documentation of these parameters over a long period of time should lead to the development of mathematical models for the variation of these important soil physical properties in this part of the world. Further work on these models may lead to simulation of, and development of advance prediction computer programs for the hydrological movement of water in the different soil types of Southwestern Nigeria. Individual Nigerian farmers and the extension services division of the Ministries of Agriculture and Natural Resources stand in urgent need of more specific information about the suitability of various soils for particular crops, hence, the information so gathered should be useful in the planning of all aspects of agricultural development in the country. This specific information is also utilized by highway and drainage engineers, by estate developers and builders of factories and manufacturing plants, and by companies and organizations that require land for intensive campaigns [1].
2. Materials and Methods
2.1. Dual-Energy Methodology
The gamma-ray attenuation technique in soil physics was applied initially for bulk density measurements, and later for the determination of soil water content. Measurements accomplished in the laboratory usually employ samples of disturbed and undisturbed soils. Soil samples can be scanned by a mono or dual energy gamma beam for the bulk density and wetting study [2].
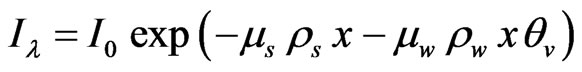
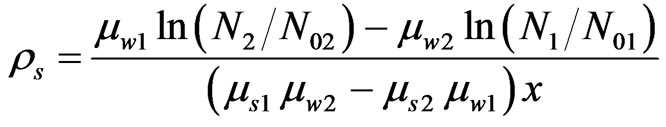
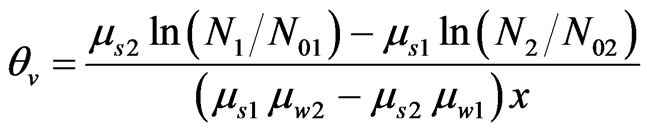
When using dual-energy gamma sources, each with different mass absorption coefficients, the modified form of Lambert-Beer’s equation is applied to each source, after which two simultaneous attenuation equations result, which can be solved to yield estimates of volumetric water content,  and soil bulk density,
 . In this work, (for an absorber that is composed of solid, water and gas phase), the Lambert-Beer’s equation was rewritten as
 (1)
(1)
where  and
and  denote the mass attenuation coefficient and density respectively.
The subscripts s and w refer to soil and water respectively.
The attenuation of the gas phase is ignored.
x represent the thickness of the absorber (in cm) and  which represent the volumetric water content (volume wetness) of the absorber (soil), can be defined as Volume wetness,
where Vw is the water volume relative to the total bulk soil volume, Vt and Vt is the sum of the volumes of solid and pore space.
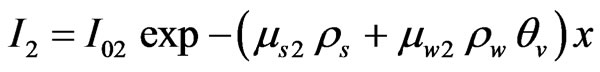
Each of the energies gives rise to different mass absorption coefficients in solids and water, and Equation (1) above is applied to the energies, after which two simultaneous attenuation equations result, which were solved to yield estimates of volumetric water content,  and soil bulk density,
 .
.
 (2)
(2)
 (3)
(3)
the subscripts 1 and 2 refer to the low and higher gammaray energies respectively.
The exponents of Equations (2) and (3) represent  with x constant for all samples. Solving the simultaneous Equations (2) and (3) and replacing radiation intensity with the number of gamma-ray quanta N, we have,
 (4)
(4)
 (5)
(5)
(since the density of water, ρw is equal to 1 g/cm3).
The choice of a lowand high-energy gamma radiation as energy pair for the dual-energy technique is further informed by the contrast in detection efficiencies at low and high gamma energies. The iodine atom of the NaI(Tl) scintillator provides a high gamma-ray absorption coefficient and, therefore high intrinsic efficiency. At low energy, there is a high probability of complete absorption (for a solid cylindrical detector for example), hence a higher counting efficiency for low-energy gamma-rays is obtained which somewhat “compensates” for the “heavier” attenuation (compared with high-energy gamma rays) suffered by them. Discrimination and counting of lowenergy photons in the appropriate energy spectra is therefore enhanced. Early literature, for example [3] described the experimental requirements. Later applications improved calibration, automation and error analysis of such dual-energy gamma radiation systems [4]. Applications of this method were used to measure solute concentrations [5,6]) and fluid saturation in multi-phase systems [7].
2.2. Soils, Climate, Geology and Vegetation of Central Southwestern Nigeria
In the comprehensive classification of Nigerian soils by Vine [8], Vine made a primary division of the soils into three climatic zones which he further divided into a total of sixteen soil groups. The soil groups were essentially geographic areas of soil distinguished from one another on the basis of differences in drainage, degree of leaching and major differences in mechanical composition and organic matter content. This central south west Nigeria lies within Vine’s climatic zone A(1), which is defined as having moderately to strongly leached soils of low to medium humus content, weakly acidic to neutral surface layers and moderately to strongly acidic sub-soils, occurring in hot lowlands with a mean annual rainfall of about 1527 mm and mean monthly air temperature of approximately 31˚C. Furthermore, this area lays within a single geographical unit, described by Vine as an area with friable porous sands to sandy clays, commonly reddish in colour. Following the United States Soil Classification System, many of the soils in this area would be placed in the Great group of “Ultustalfs” belonging to the suborder of “Ustalfs” in the order of “Alfisols”; others in which the degree of segregation of free iron oxides is sufficient to constitute an “oxic” horizon, would be placed in the order of “Oxisols” and possibly in the sub-order of “Idox” and the great group of “Haplidox”. In the approximation of the soils map of Africa [9], this area was mapped as having a complex of Ferrisols and Ferrallitic soils.
The major soil associations of central Southwestern Nigeria [10] are distinguished as:
1) Iwo association: Well-drained, coarse textured soils, overlying weakened rock material; mainly derived from coarse-grained granitic rocks and gneisses.
2) Ondo association: Well-drained, medium to fine textured soils, overlying orange brown, yellow brown and brown mottled clay; mainly derived from medium grained granitic rocks and gneisses.
3) Egbeda association: Well-drained fine textured soil, overlying red brown, yellow brown and white mottled clay; mainly derived from fine-grained biotite gneiss and schist.
4) Itagunmodi association: Well-drained, very fine textured soils of uniform brownish red or dark chocolate brown colour to depth; derived from amphibolite and related basic rocks.
5) Okemessi association: Well-drained coarse textured, very gravelly soils; derived from quartz schists and massive quartzite.
6) Mamu association: Well-drained, medium textured soils; derived from sericite schists.
7) Jago association: soils of various textures in low topographical sites with drainage affected by seasonally high water table; derived from alluvium and local colluvium.
8) Origo association: Fine textured soils with impeded drainage; derived from diorite-gneiss.
The Iwo, Ondo and Mamu soils are known to be welldrained, coarse textured, medium to fine textured and medium textured; the Iwo type overlying weakened rock material, the Ondo type overlay mottled clay and the Mamu type was derived from sericite schists. The Egbeda soil is well-drained, fine textured soil overlying mottled clay. The Itagunmodi type is well-drained, very fine textured soil derived from amphibolites and related basic rocks. The Okemessi type is also well-drained, but coarse textured, gravelly and derived from quartz schists and massive quartzite. The Origo series are fine textured soils with impeded drainage derived from diorite-gnesis. The Jago series are soils of various textures which are affected by seasonally high water table derived from alluvium and local colluviums [1].
The climate of Nigeria is dominated by the influence of two major wind currents. One, from the northeast, is hot and very dry, the other, from the southwest is warm and very moist. As a result of the influences of these winds, the country is subjected to marked wet and dry seasons, associated with the moist and dry air currents. In most of south western Nigeria, these wind currents give rise to a hot dry season from November to early April and a cooler rainy season typically lasting from around late May to early October, but varying from year to year in its incidence. From mid December to late January the dry air mass carrying dust particles from the north predominates, giving rise to the harmattan season with short periods of hazy weather.
Geologically, the entire area described overlies metamorphic rocks of the Basement complex, the great majority of which are very ancient being of Pre-Cambrian age. These rocks show great variation in grain size and in mineral composition, ranging from very coarse-grained pegmatite to fine-grained schist and from acid quartzite to basic rocks consisting largely of amphibole.
Apart from relatively small areas of special relief, the land surface is gently to strongly undulating and descends gradually from an average altitude of over 488 m in Ekiti zone, in the north of the area, to less than 122 m in the south in Ondo and Ijebu zones of the area. The whole of this area is drained by seven (7) major river systems. The western half of the area is largely drained by four river systems, all flowing southwards. These rivers are the Ona, with its tributaries the Omi and the Oni; the Osun (the largest river in the area) with its tributary the Oba; the Shasha with its tributary the Owena; and the Oni. East of the area, we have the Oluwa with its tributary the Ominla; the Siluko with its tributaries the Owena and Ohusa; and the Osse with its tributary the Ogbesse. These rivers also drain the area southwards.
The previous vegetation of this area was rainforest characterized by very tall, big trees and thick shrubs [11]. However, as a result of human activities (farming, etc.), the vegetation consists of a mixture of bush regrowth, arable crop farms and tree crop plantations. Under prevailing climatic conditions, the climax of natural vegetation over the whole area is considered to be lowland rainforest but, under the influence of a high agricultural population practicing a bush-fallow system of farming. Little high forest remains outside the forest reserves and it is doubtful if there is, any virgin forest remaining in the area. On the drier northern fringes of the area and over soils with poor moisture retaining qualities, grassy vegetation has become established following clearing and cultivation, and subsequent bush fires in the dry season prevent the re-establishment of forest vegetation.
2.3. Location and Preparation of Soil Sample Collection Sites
With the assistance of the Soil Science Department of the Obafemi Awolowo University, OAU, Ile-Ife, the following soil types were identified within the teaching and research farm of OAU; Iwo, Ondo, Egbeda and Jago. In the area around the OAU, incinerator, at Asunle area, near Abagboro village the Ondo soil type was located. Around the production plot of the OAU teaching and research farm, the Iwo type was identified and located. Also within this teaching and research farm, at Kajola village the Egbeda type was located. The Jago type was located also around this Kajola village. The Itagunmodi type was located at Mokuro village around Nigerian Television Authority, NTA, Ile-Ife. At a location around Gareji-Olode, off the Ife-Ondo highway, the Okemessi soil type was located. Near the Cocoa Research Institute of Nigeria, CRIN, south of Ibadan, the Mamu soil type was located. Off the new Iwo-Awo highway at Ojisun village (about five kilometres from Awo) the Origo type was located.
At each of the eight (8) locations for the different soil types, soil profile test pits were dug. Test pits whose dimensions are 2 m × 1 m × 2 m were dug with two steps on the 1m side of the pit. The steps were used for descent/ascent into/out of the pit. During excavation from the pit, the excavated soil was packed only on one side, at a distance of about 2 metre away from the pit. The side chosen was one that was against the known erosion path. This was done so as to avoid contamination of the surface and pit by erosion due to agents of rain, wind, etc. Using a linen tape with a reading accuracy of 0.1 cm, depths of 0 - 15 cm, 15 - 30 cm, 30 - 50 cm, 50 - 70 cm, 70 - 90 cm and 90 - 120 cm were marked on one side of the pit from which undisturbed soil samples were taken. Remote sites were chosen to locate the profile test pits such that the chances of human and animal disturbances are reduced to the barest minimum.
2.3.1. Method of Collection of Soil Samples
Using the core sampler driven in one continuous motion into the soil profile, undisturbed soil samples were collected at the different depths stated in Section 2.3 above into similar cylindrical plastic containers. Each of the cylindrical containers has a diameter of 5.68 cm and a height of 7.47 cm. The volume of each of the containers is 189.19 cm3. As soon as the undisturbed soil samples were taken, the cylindrical containers were covered and masking tape was applied around all possible air vents. The containers were then totally covered in wax to prevent possible loss of water via evaporation since the container covers are not air tight. Care was exercised while transporting the collected samples to the laboratory so as to avoid agitating the collected samples. Soil samples were collected at monthly intervals between June 2006 and May 2007. However, during the rainy season it was difficult to go beyond depths of about 60cm for Jago and Origo soil types; this may be due to the fact that these soil types are known to have seasonally high water table and impeded drainage respectively especially during the rainy season. Test samples were taken between June 2005 and May 2006 at Ado-Ekiti and within the premises of the Centre for Energy Research and Development, (CERD), OAU, Ile-Ife.
2.3.2. Spectrometer Arrangement and Experiment
The gamma-ray spectrometer was arranged in such a way that the sample container was placed over collimated lead shields which enclosed the NaI(Tl) scintillator detector. The detector used is a cylindrical shaped BICRON corporation manufactured model 3M3/3 and serial number FF-669, while the photomultiplier is also BICRON corporation manufactured with the model number PA-14 and serial number AG-472. From the photomultiplier end of the detector, connections were made to 1) a CANBERRA manufactured high voltage power supply, HVPS unit; model 3106D and 2) a CANBERRA manufactured spectroscopic amplifier. Connections from the detector were made separately to the preamplifier and amplifier on opposite ends of the unit making a total of three pin connection from the detector to the HVPS, preamplifier and amplifier. Unipolar and Bipolar options are available from the output stage of this amplifier unit, and from the Unipolar option pin, connection was made to the analogue-to-digital converter, ADC unit, which is also CANBERRA manufactured. All of these units are arranged and controlled on the frame of the multichannel analyser, MCA. From the ADC, connection was made via a multipin plug to the computer with the software CANBERRA S100 interfacing to provide the spectrum display on the computer screen. Figure 1 shows the spectrometer arrangement.
2.3.2.1. Experiment
The 152Eu radionuclide was used as the gamma-ray source. This radionuclide emits a wide range of gamma energies ranging from about 122 KeV to about 1408 KeV, from which convenient pairs of low and high gamma-ray energies (for the maximization of the differences in the absorption coefficients for solids and water) were easily selected. The justification for this judicious choice of low and high gamma-ray energies as convenient pairs was demonstrated by calculating the values of soil bulk density,  and volumetric water content,
  from equations 4 and 5 respectively using close gamma-ray energies as dual-energy pairs. Erratic results were obtained, thus confirming low and high gamma-ray energies as judicious choice. The particular 152Eu radionuclide used was disc shaped, and prepared on 1st of March, 1992, by Isotope Products Laboratories, Burbank, California. It
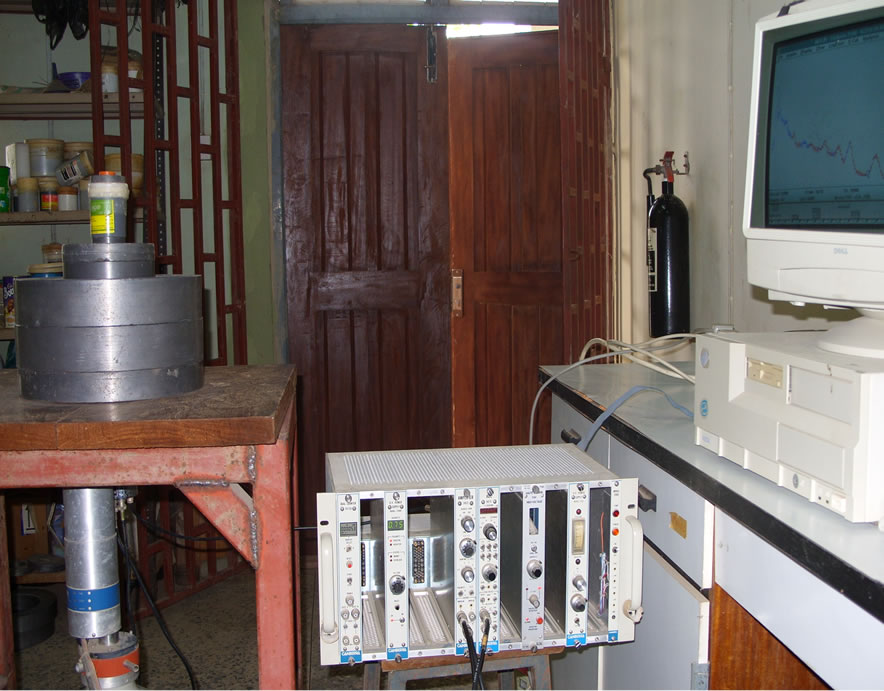
Figure 1. Spectrometer arrangement for experiments.
was marketed with a series number 296-89-8 with some other radionuclides as “Gamma disc set”. The activity of this source at the date of preparation is given as . The source was placed over a collimated lead shield which was in turn placed over the soil sample container. The HVPS unit was set at 0.75 kV. On the amplifier unit, the coarse gain was set at 10, the fine gain at 4.7 and the shaping time at
  For the data acquisition setup, the full memory was set at 4K and the livetime was preset at 10,800 seconds (3 hours). The spectrum display was observed on an IBM computer in the Gamma Spectrometry laboratory at CERD, OAU, Ile-Ife. Data was accumulated with the container filled with soil, empty and when filled with distilled water. From the acquired spectra, the number of gamma-ray photons, N was determined. Following the discussions in Section 2 (Dual-energy methodology), the mass absorption coefficients for water and soil at varying soil depths were determined using N, and consequently the soil bulk densities and volumetric soil water contents at varying soil depths were determined.
2.3.2.2. Detector Calibration
Energy Calibration: The 152Eu radionuclide was used as source for energy calibration, and this radionuclide was chosen because the calibration energies obtainable from it will cover the entire range of energies over which measurements are to be made. The source was placed at a distance reasonably close to the detector and suitable for the geometry conditions used in the experiment. The spectrum was measured for 10800 seconds, and the peaks which correspond to the following energies were used: 1408, 1112, 964, 779, 344 and 122 keV. These energies correspond to the channel numbers 1413, 1105, 966, 785, 356 and 131 respectively. The peak channel numbers and the corresponding gamma energies were typed onto the computer using the energy calibration, E-Cal, menu from the software. The energy/channel relationship was deduced by the computer as Energy, E = 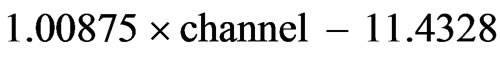 (6)
(6)
The energy pairs of 122 and 1112 keV; and 344 and 1408 keV were used in this work to determine the volumetric water content,  and soil bulk density,
 .
.
The peak areas used to determine the numbers of gamma photons N were derived from manually set regions-of-interest, ROI, hence there was no need for a peak width calibration.
2.3.3. Radiological Data Acquisition and Analysis of Raw Data
The height of the cylindrical soil sample container was used as the parameter x of Equations (4) and (5). Table 1 shows the raw data (for the test samples taken at AdoEkiti) and calculation for the mass attenuation coefficients. Mass attenuation coefficient values for the eight (8) soil series at the depths of interest mentioned in Section 2.2 at monthly intervals between June 2006 and May 2007 were also computed from raw data obtained following the pattern of Table 1. The mass attenuation coefficients for water,  and soil,
  at the different gamma-ray energies were determined by applying Equation (1) (in Section 2, but modified by replacing the transmitted radiation intensity,
  with the number of gamma-ray quanta, N and the incident radiation intensity,
  with
with ) to the cases of water and soil respectively
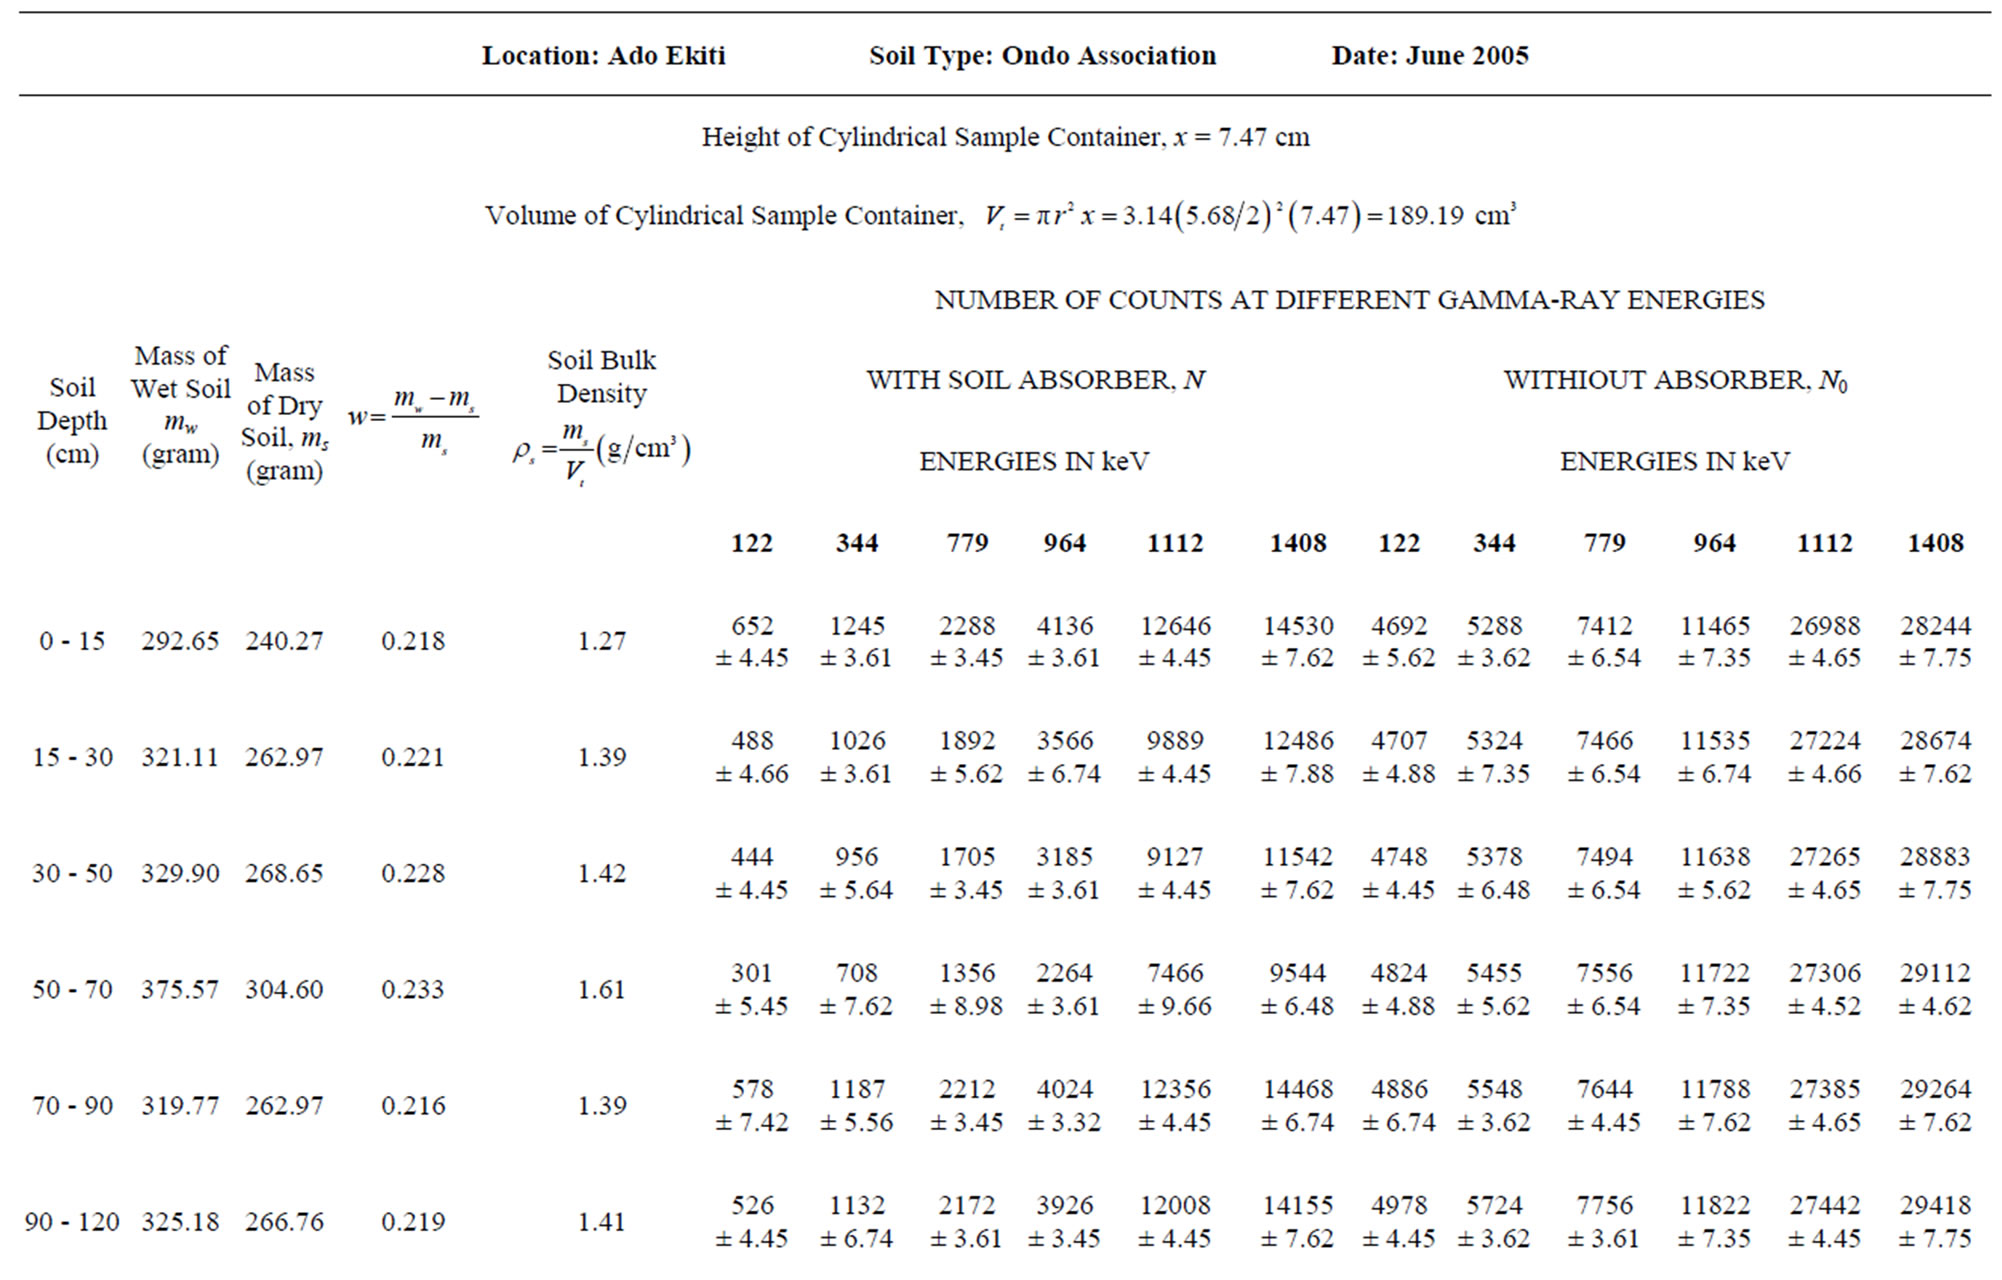

Table 1. Raw results for the computation of water and soil attenuation coefficients for June 2005.
at the different gamma-ray energies. After applying this equation the following equations were obtained for the mass attenuation coefficients for soil and water
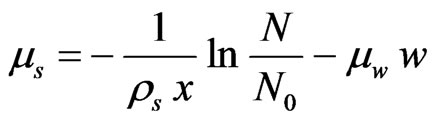 (7)
(7)
and
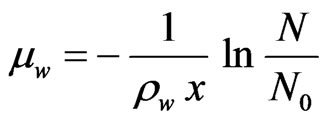 (8)
(8)
Using Equations (7) and (8) above, the mass attenuation coefficients for soil (at the different depths into the soil profile) and water were computed at the different gamma-ray energies. Equations (4) and (5) were used to obtain the volumetric water contents,  and soil bulk densities,
  at the varying soil depths for the different periods and soil types listed in the foregoing. After analysis, the results of the soil bulk densities and volumetric water contents for the eight (8) soil series at varying depths into the soil profile from June 2006 to May 2007 are displayed in Figures 2-9.
Attenuation of Gamma-Ray by the Plastic Sample Container The contribution of the plastic sample container to the attenuation of the incident gamma-ray could lead to errors in the attenuation coefficients determined. However, this was taken care of by accounting for the attenuation of the gamma-ray by the material of the sample container. This was achieved by making measurements of the number of gamma-ray photons N0, when the sample container is empty (after each measurement with the container filled with soil and when filled with distilled water).
2.4. Reference (Standard) Gravimetric Method
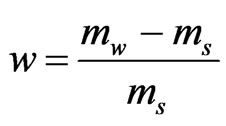
Following the collection of soil samples from June 2006 to May 2007 at the various locations for the different soil types, replicate soil samples for all the eight soil series were simultaneously collected for gravimetric direct measurement of soil water content and bulk densities for the same period. However, this time the core samples were collected in pre-weighed metallic containers, the containers sealed and the covers paper-taped to avoid moisture loss by evaporation. Care was exercised so as not to disturb the collected samples during transportation to the laboratory at CERD. The collected soil samples were weighed in the laboratory and the “wet” mass of the soil samples,  obtained from the difference between the masses of the collected soil samples and the preweighed containers. The samples were then placed in a drying oven at 105˚C for 24 hours with their lids removed. At the end of the drying period, the sample containers were removed from the oven, the covers replaced and were put in a dessicator to cool, after which they were weighed again. The mass of the dry soil,
  was obtained from the difference between this final mass and the pre-weighed mass of the container. The soil water content was calculated as follows:
On dry mass basis, the soil water content (mass wetness) can be expressed as Mass wetness,
 (9)
(9)
and on volume basis, the soil water content (volume wetness) is given as Volume wetness,
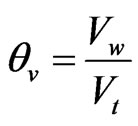 (10)
(10)
where Vw is the water volume relative to the total bulk soil volume, Vt and Vt is the sum of the volumes of solid and pore space.
Equations (9) and (10) can be related to each other as
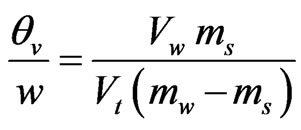 (11)
(11)
but 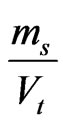 is the soil bulk density,
  and
and  is the inverse density of water,
  then equation 11 becomes
 (12)
(12)
Using Equation (12) and the relation  the volumetric soil water contents,
  and soil bulk densities,
  from June 2006 to May 2007 (as earlier stated) were computed. These results were compared with the results obtained using the developed dual energy gamma-ray transmission technique.
2.5. X-Ray Fluorescence (XRF) Analysis of Soil Samples
The elemental analysis of the collected soil samples at the different depths earlier mentioned was carried out using the facilities of the energy dispersive X-ray fluorescence, EDXRF, spectrometer at CERD, OAU, Ile-Ife. In carrying out this analysis, the collected samples were first ground in a mortar with pestle to fine powder and then put inside a pelletizer ring. Using a Carver Inc. manufactured hydraulic press at 8 - 10 kgf, the samples were turned into cylindrical pellets and then kept inside polythene bags ready for transfer into the sample chamber of the two-dimensional, (2D), EDXRF spectrometer. For this spectrometer, the X-ray optical path is in one
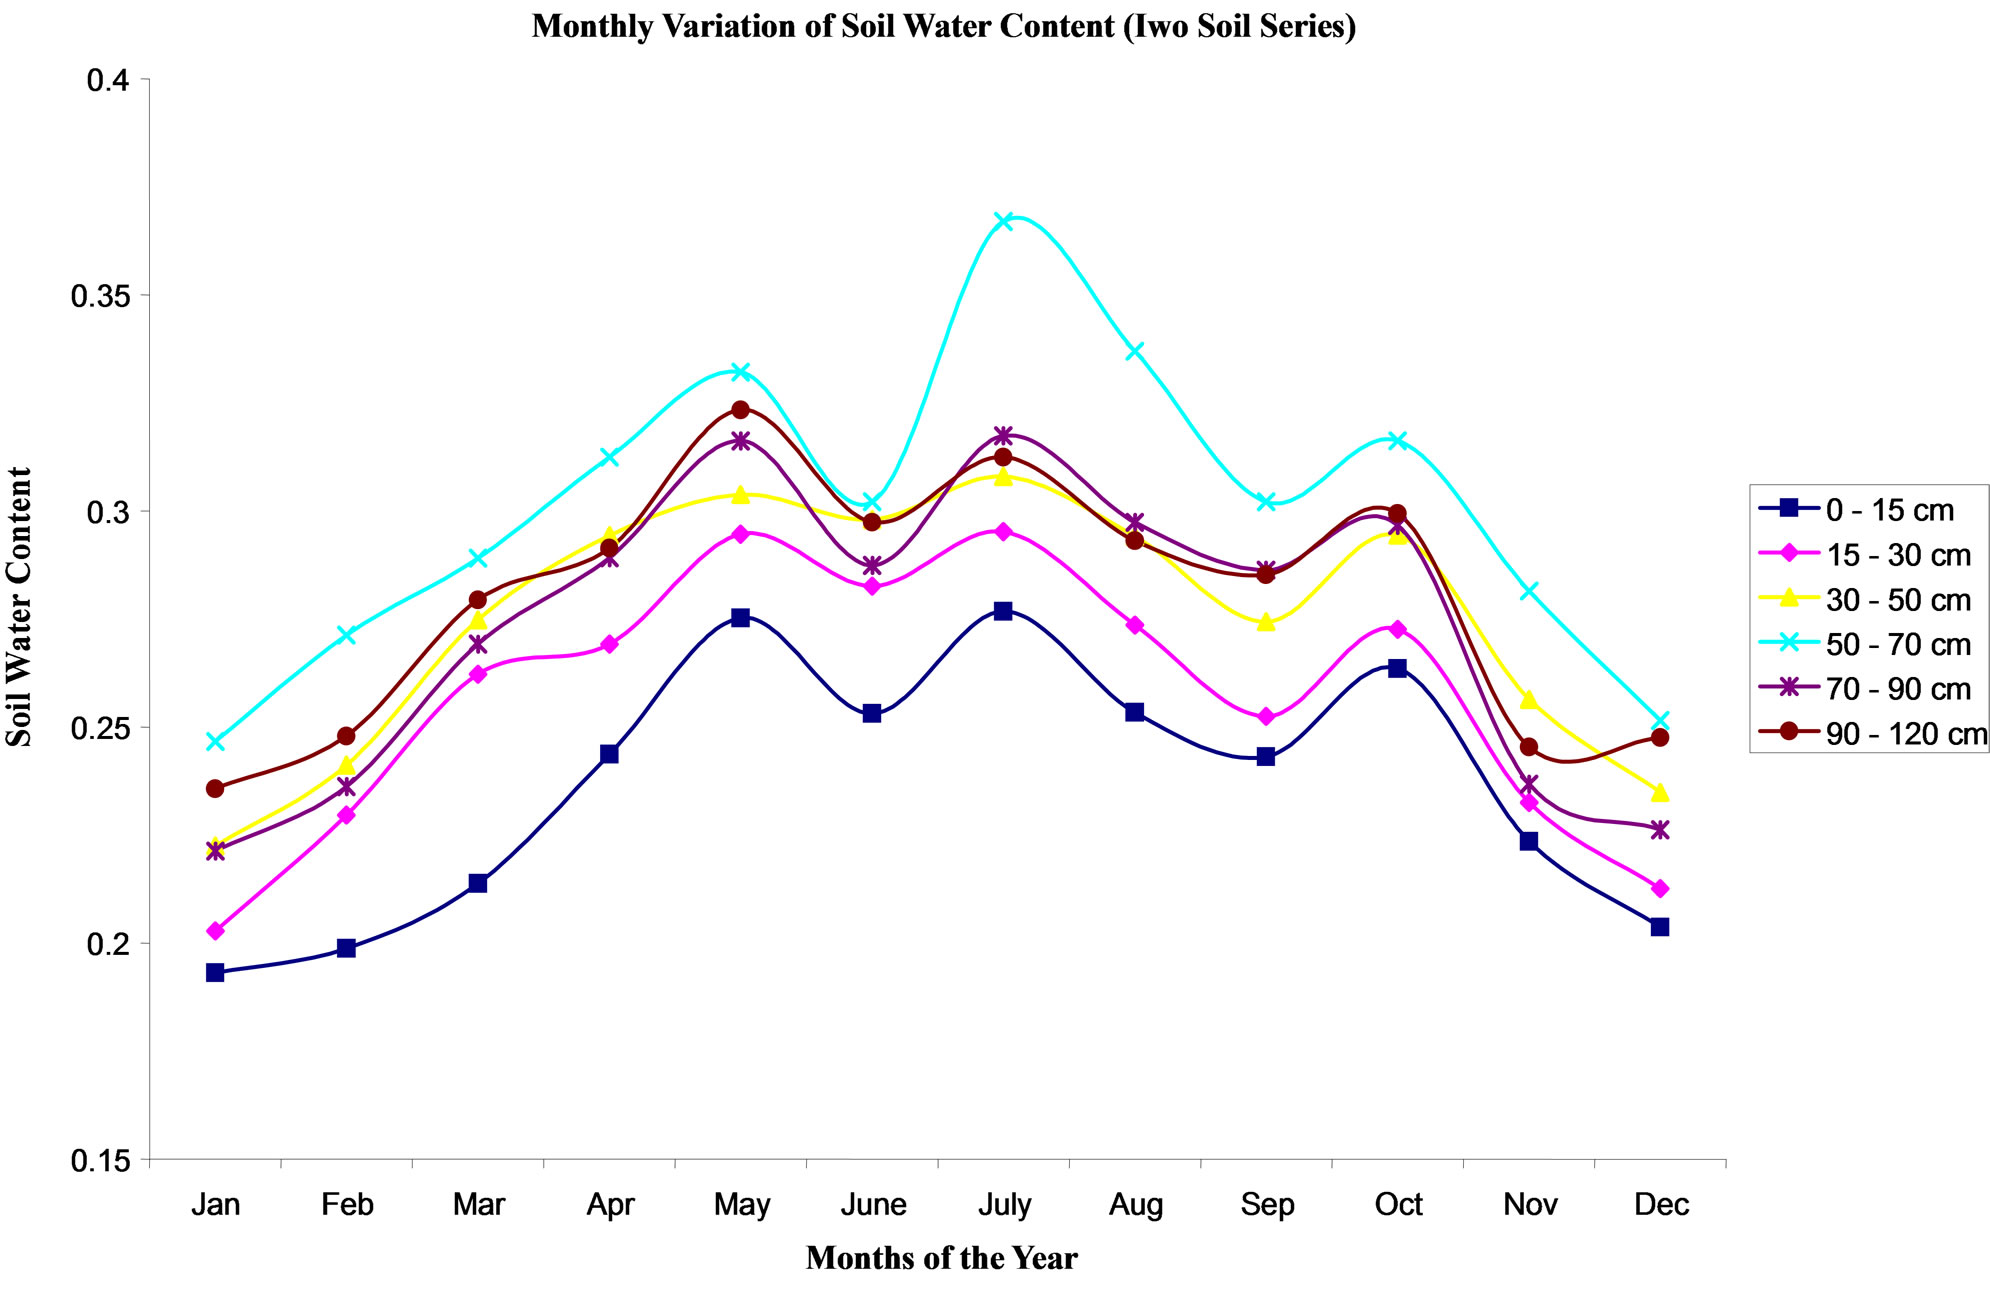
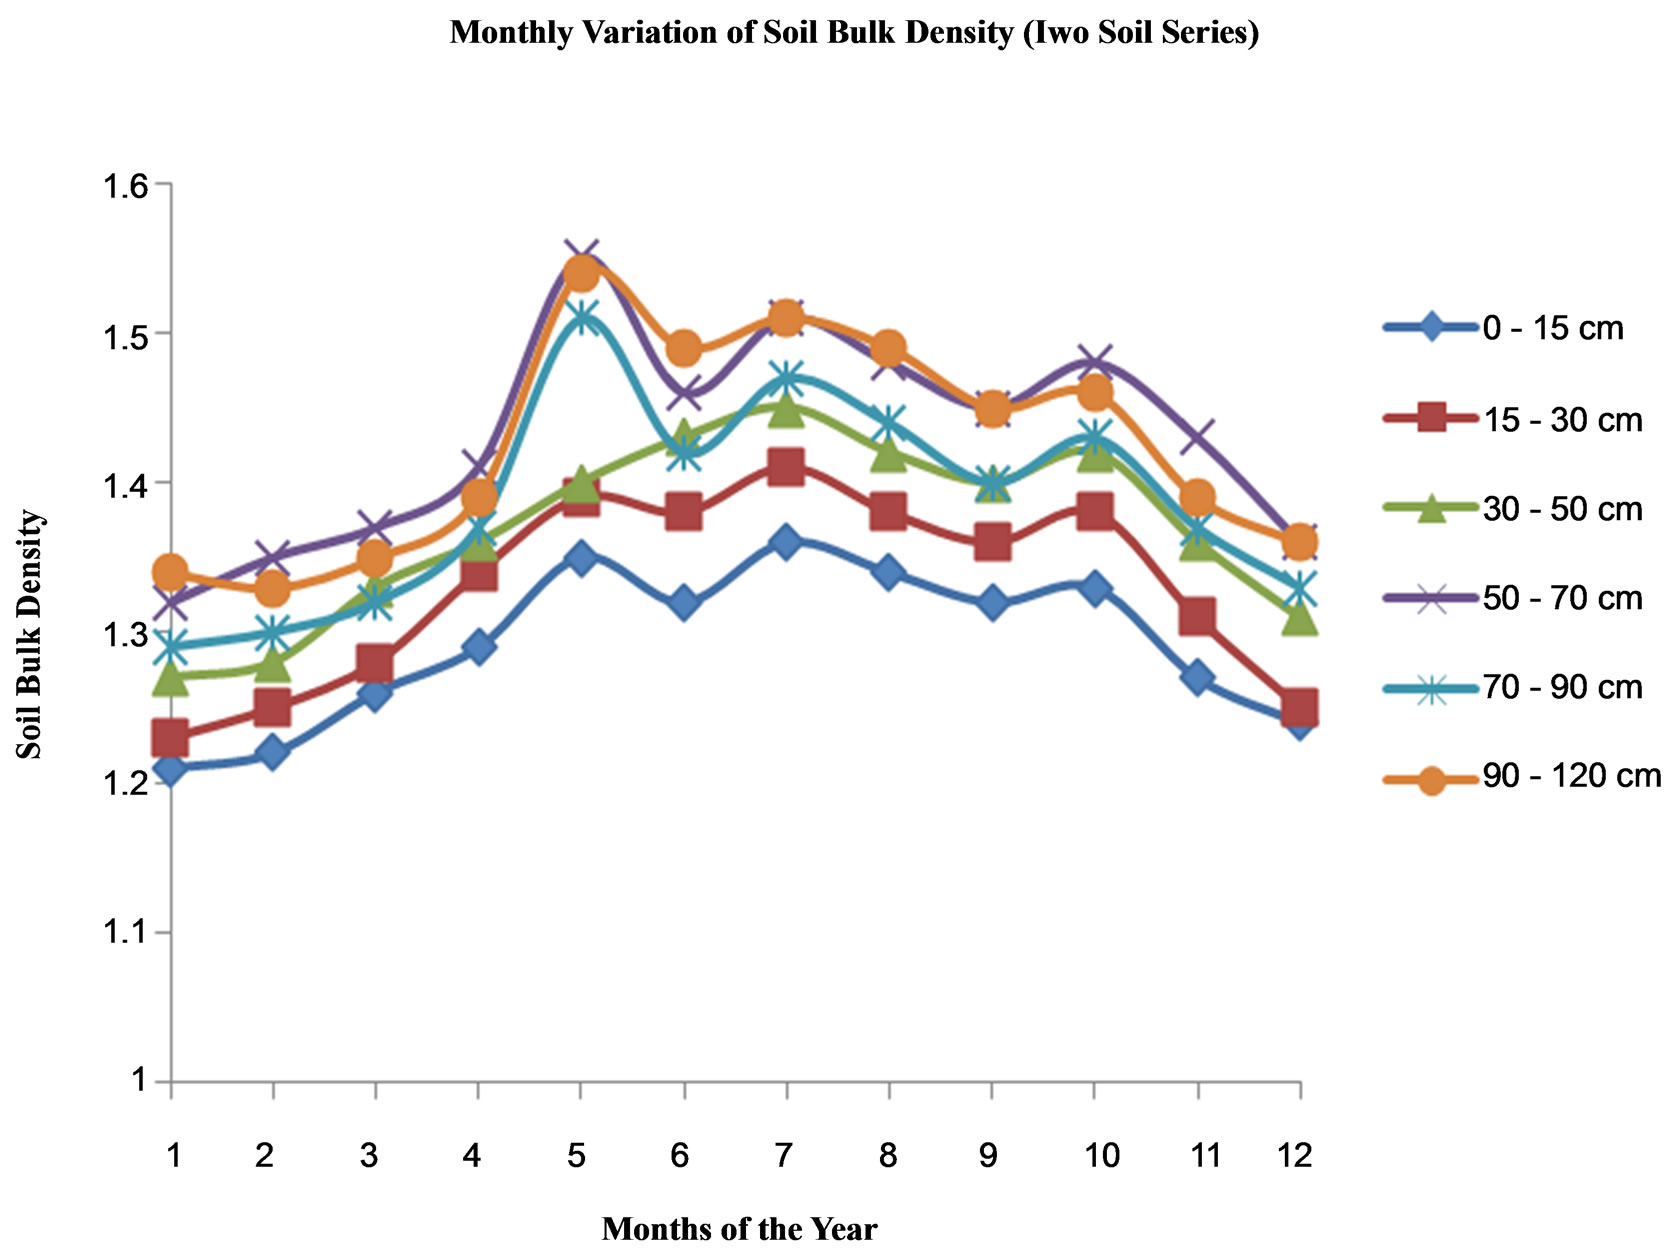
Figure 2. Monthly variation of soil water with the months of the year for Iwo Soil Series.
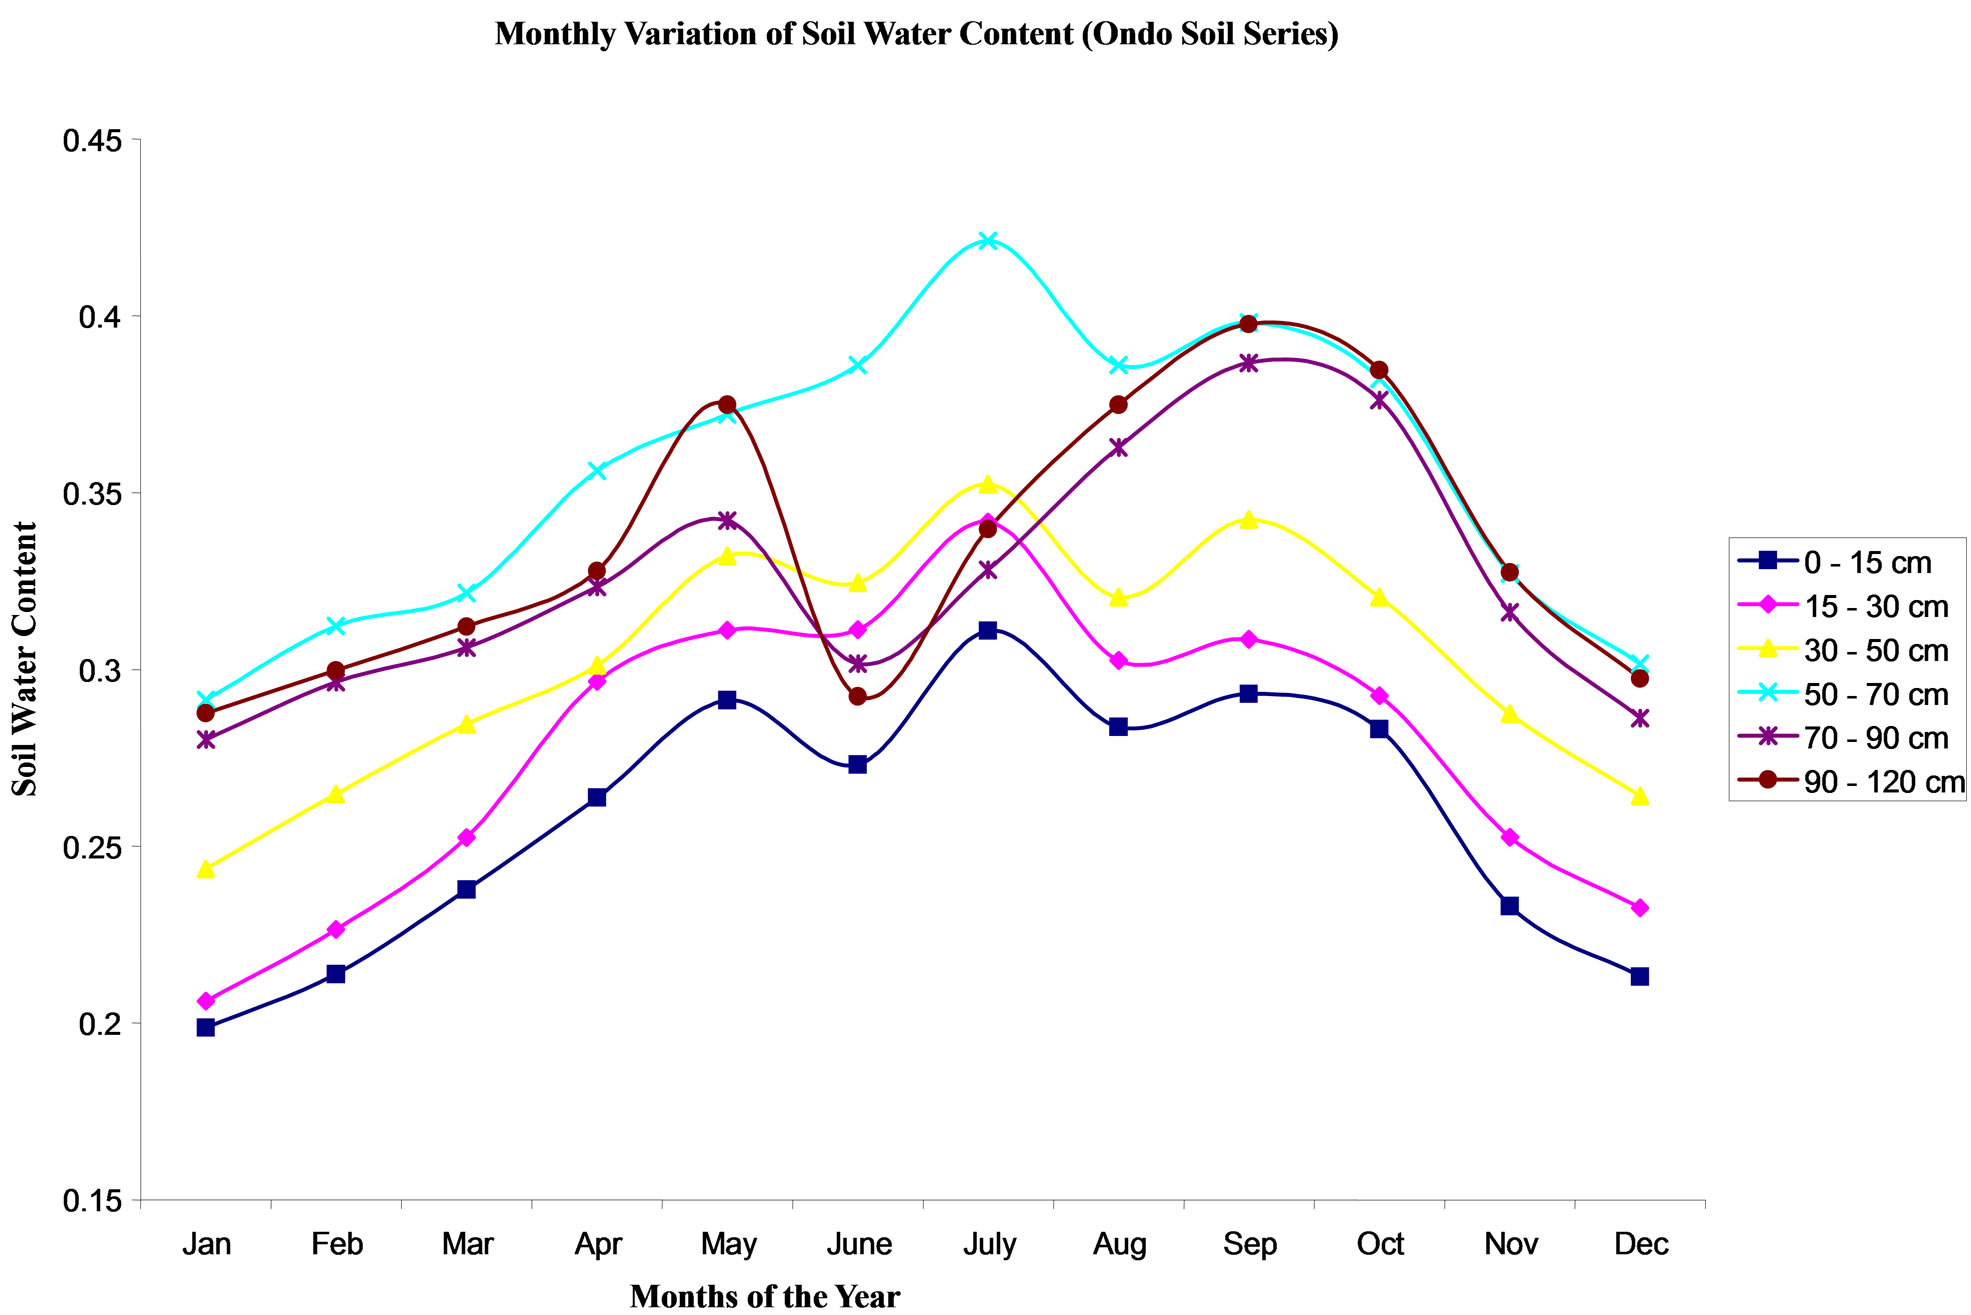
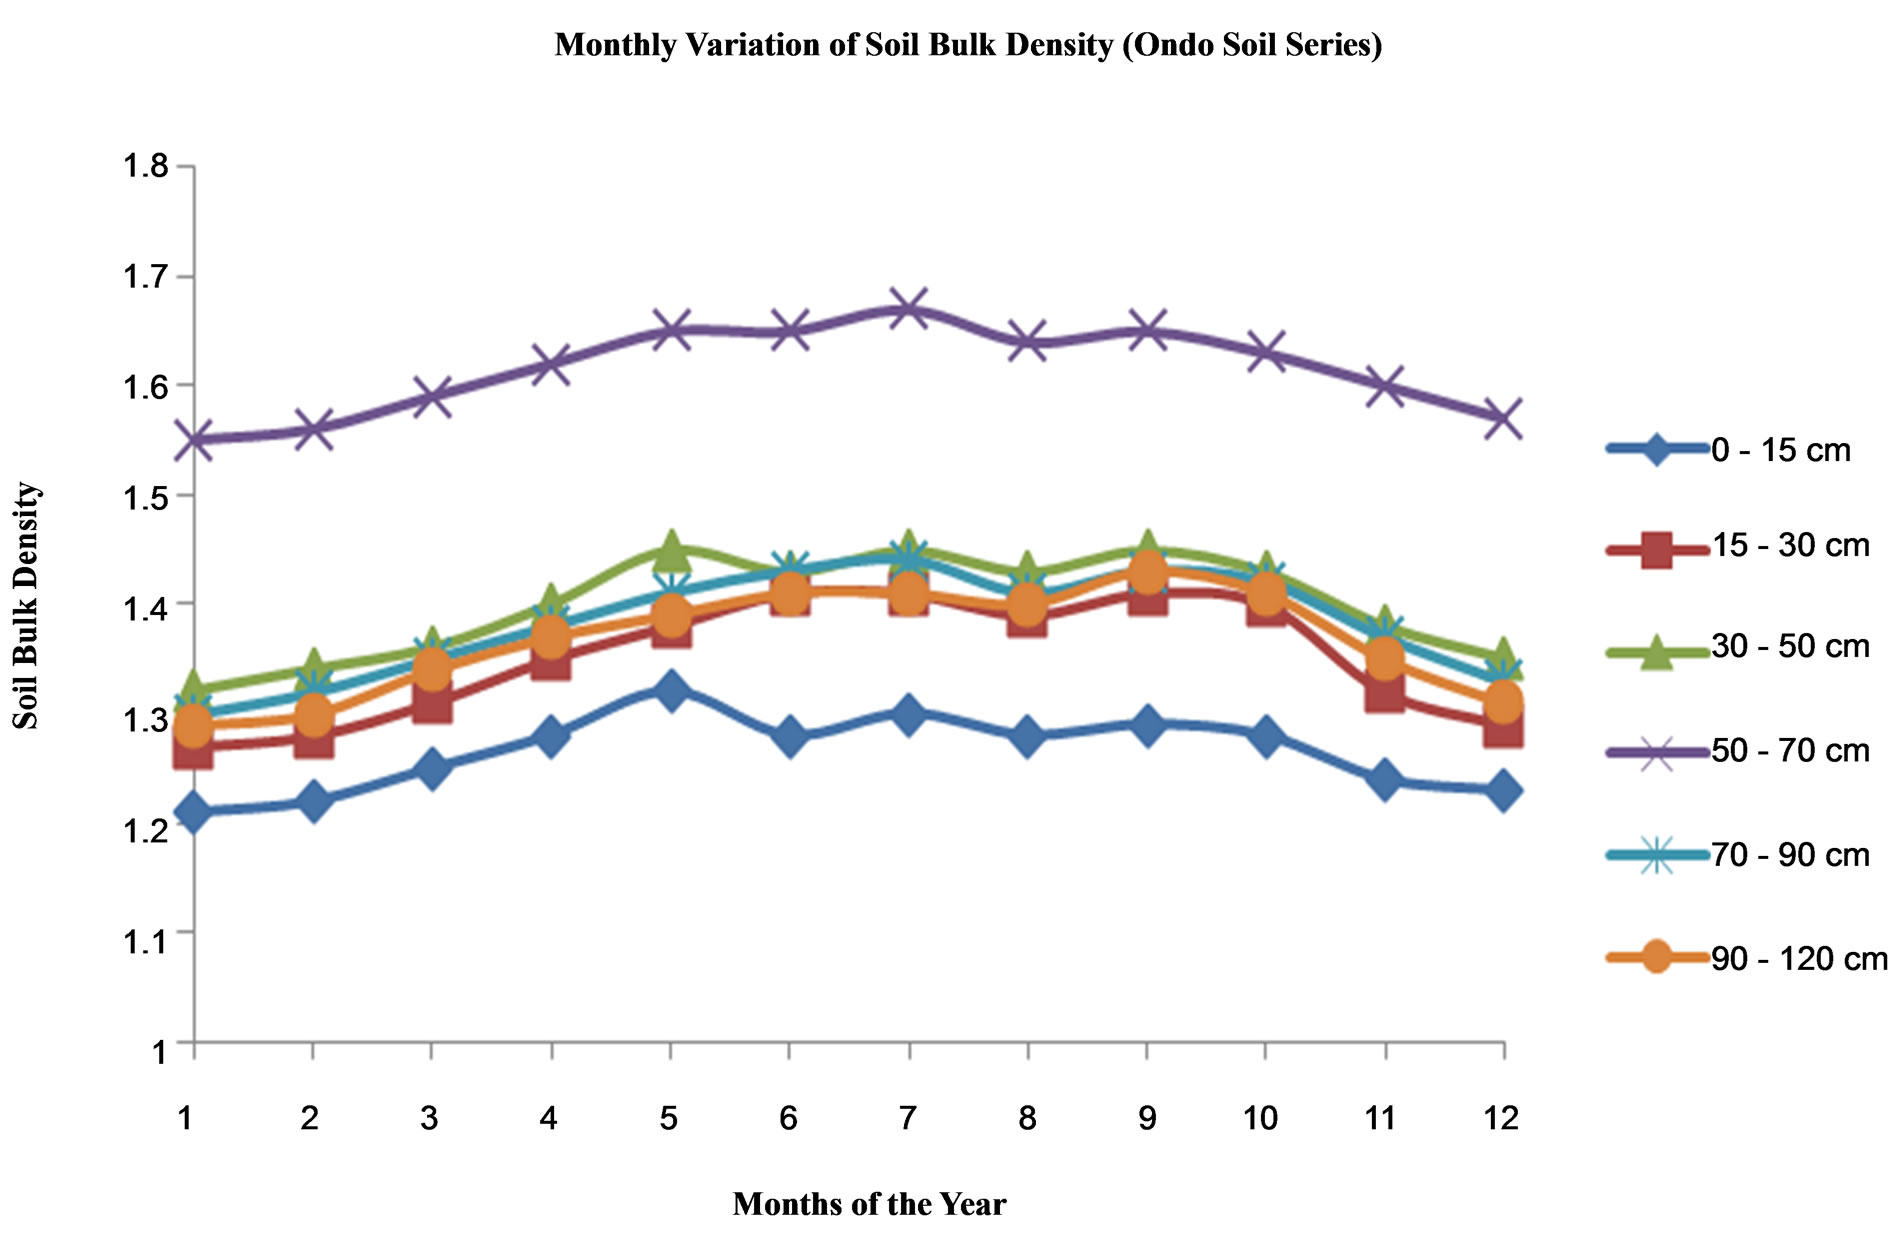
Figure 3. Monthly variation of soil water with the months of the year for Ondo Soil Series.
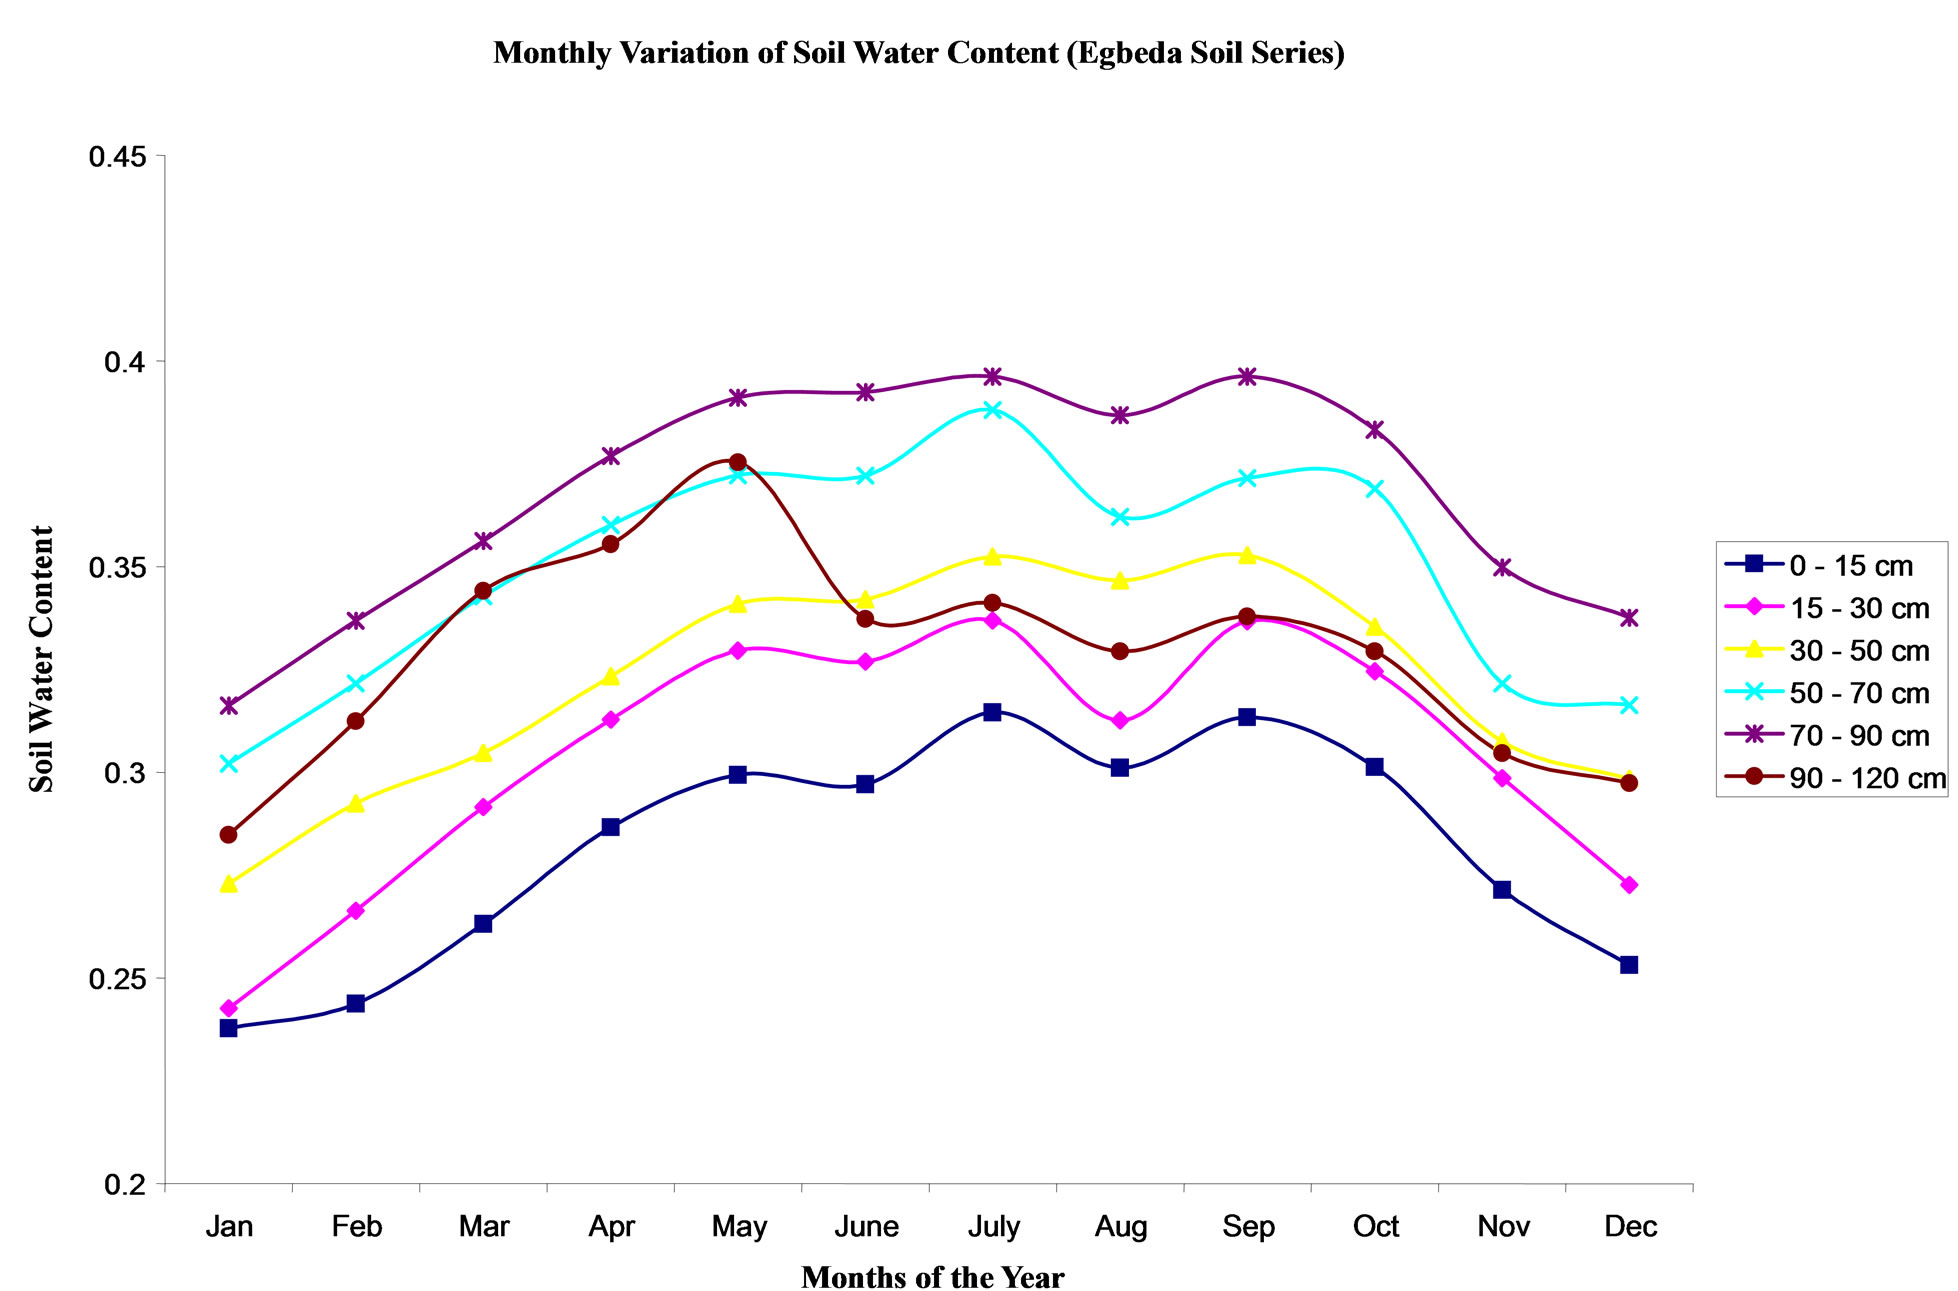
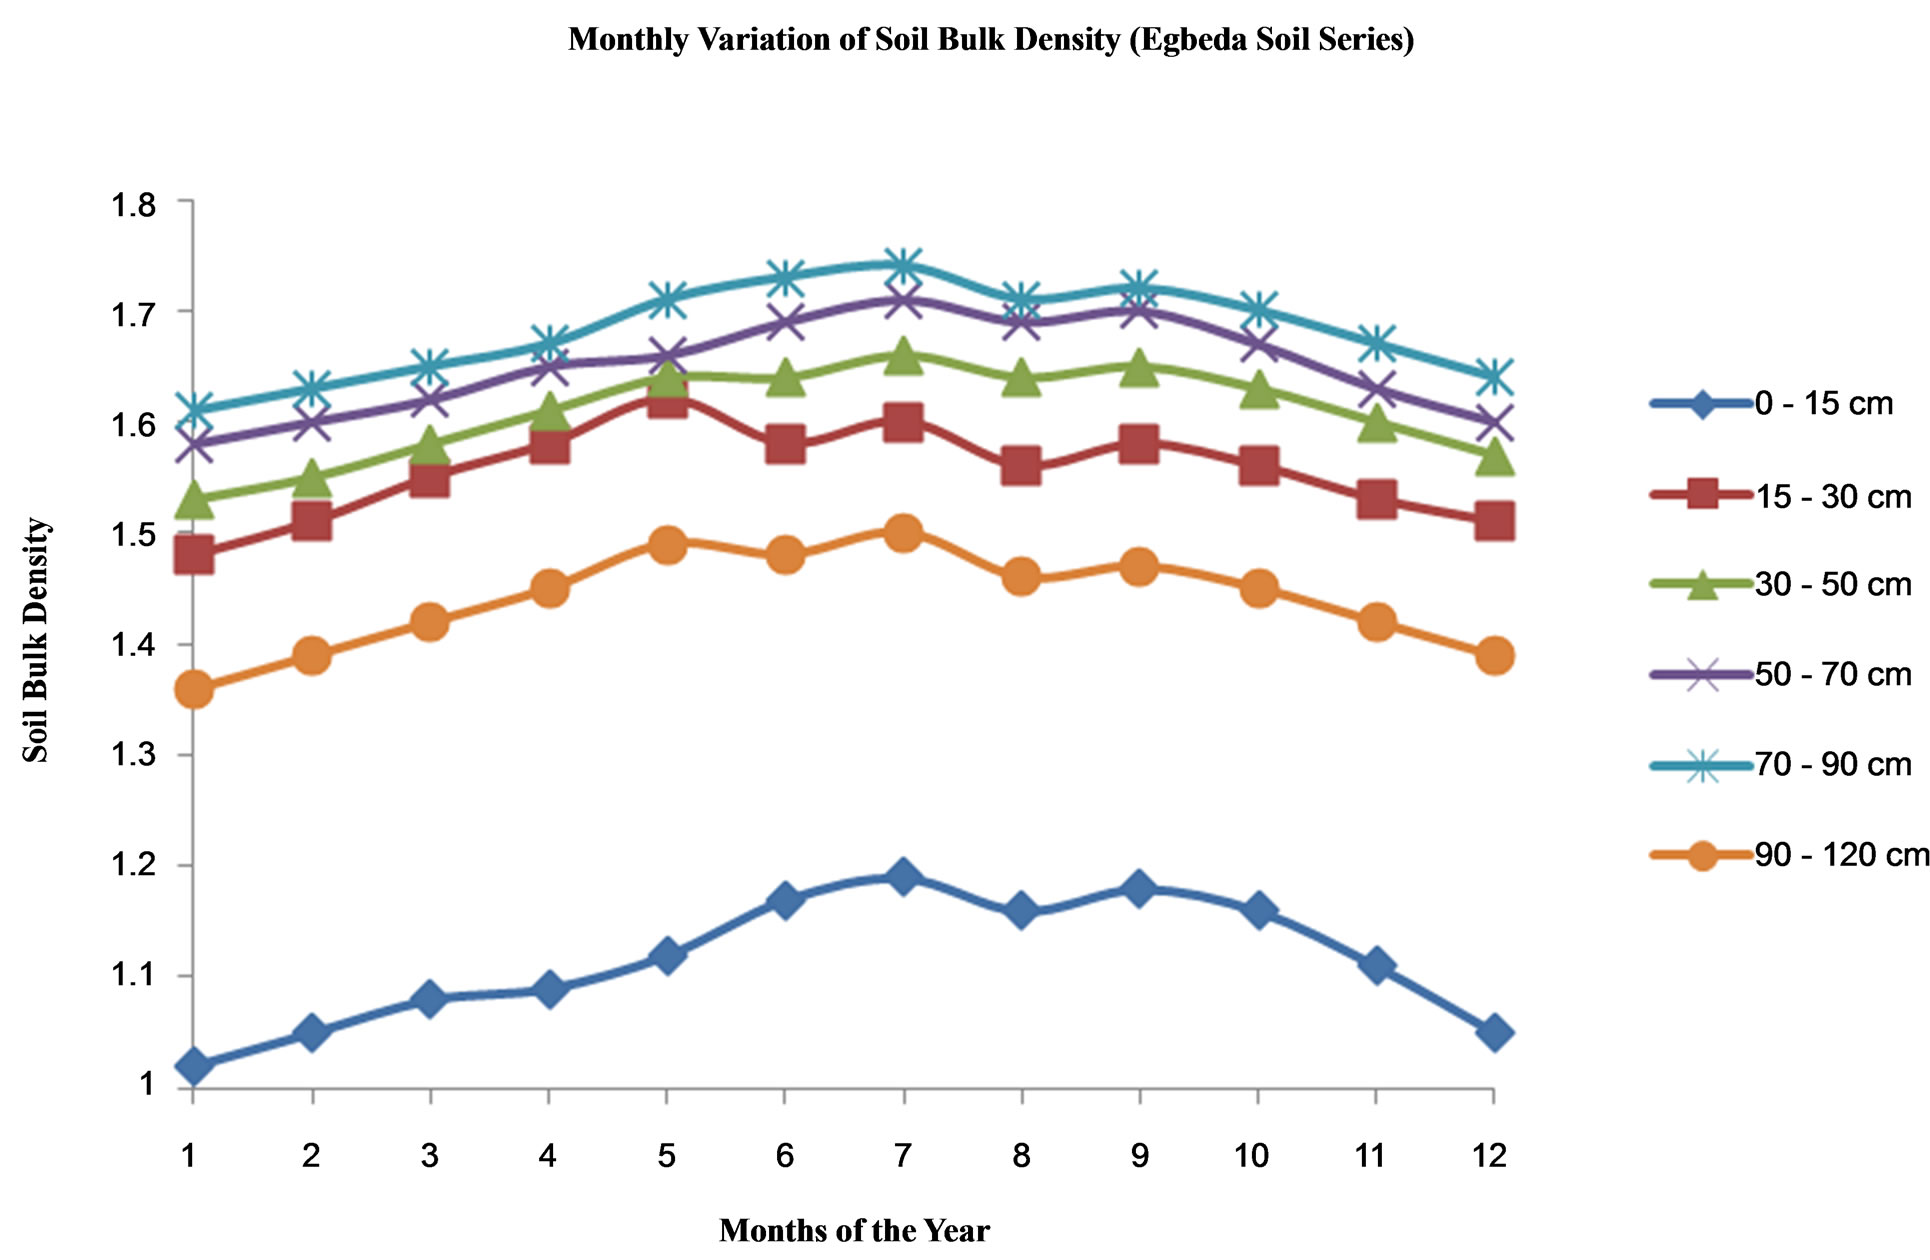
Figure 4. Monthly variation of soil water with the months of the year for Egbeda Soil Series.
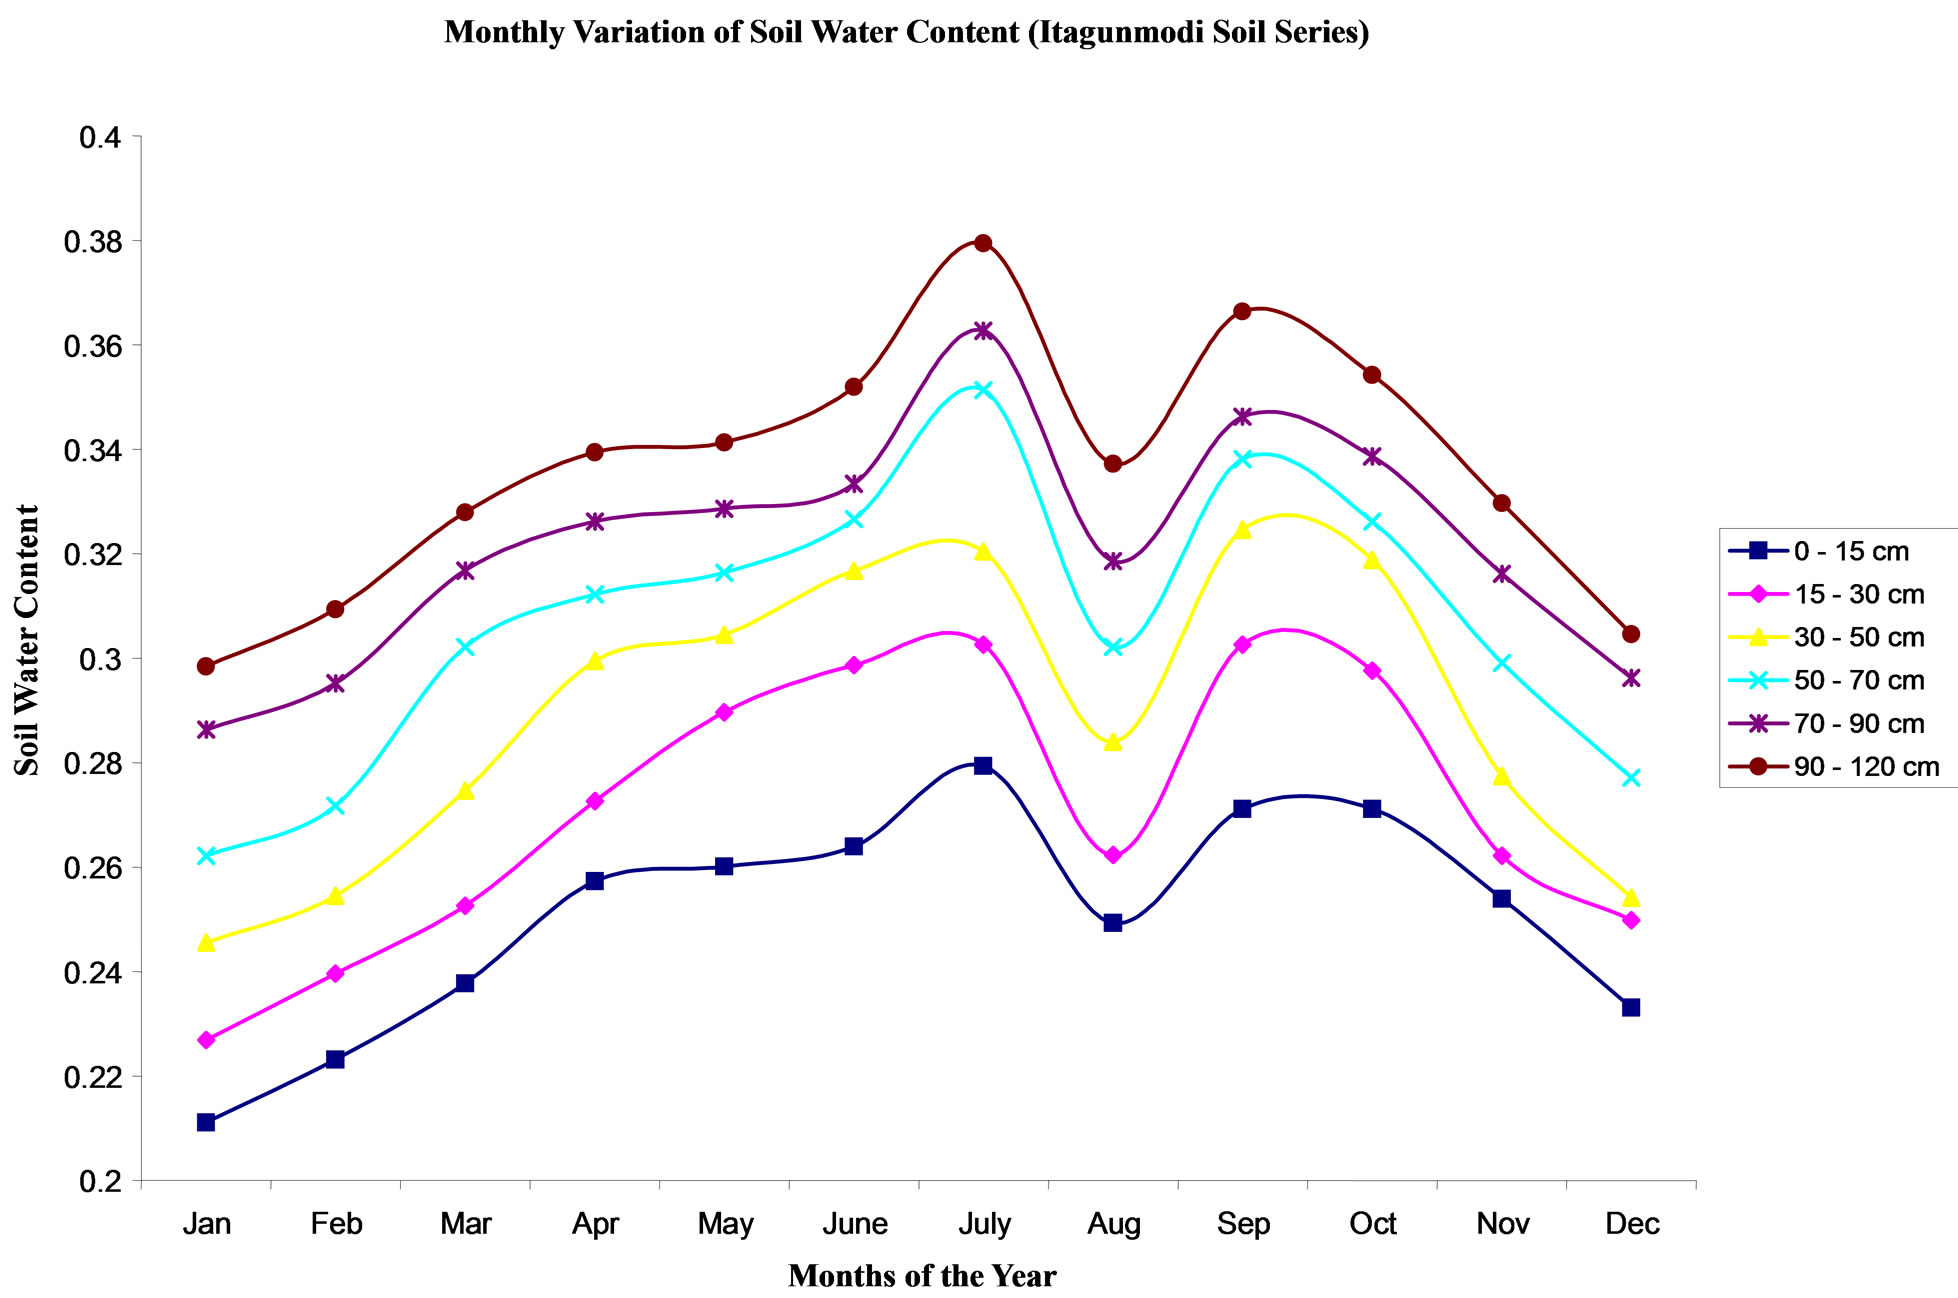
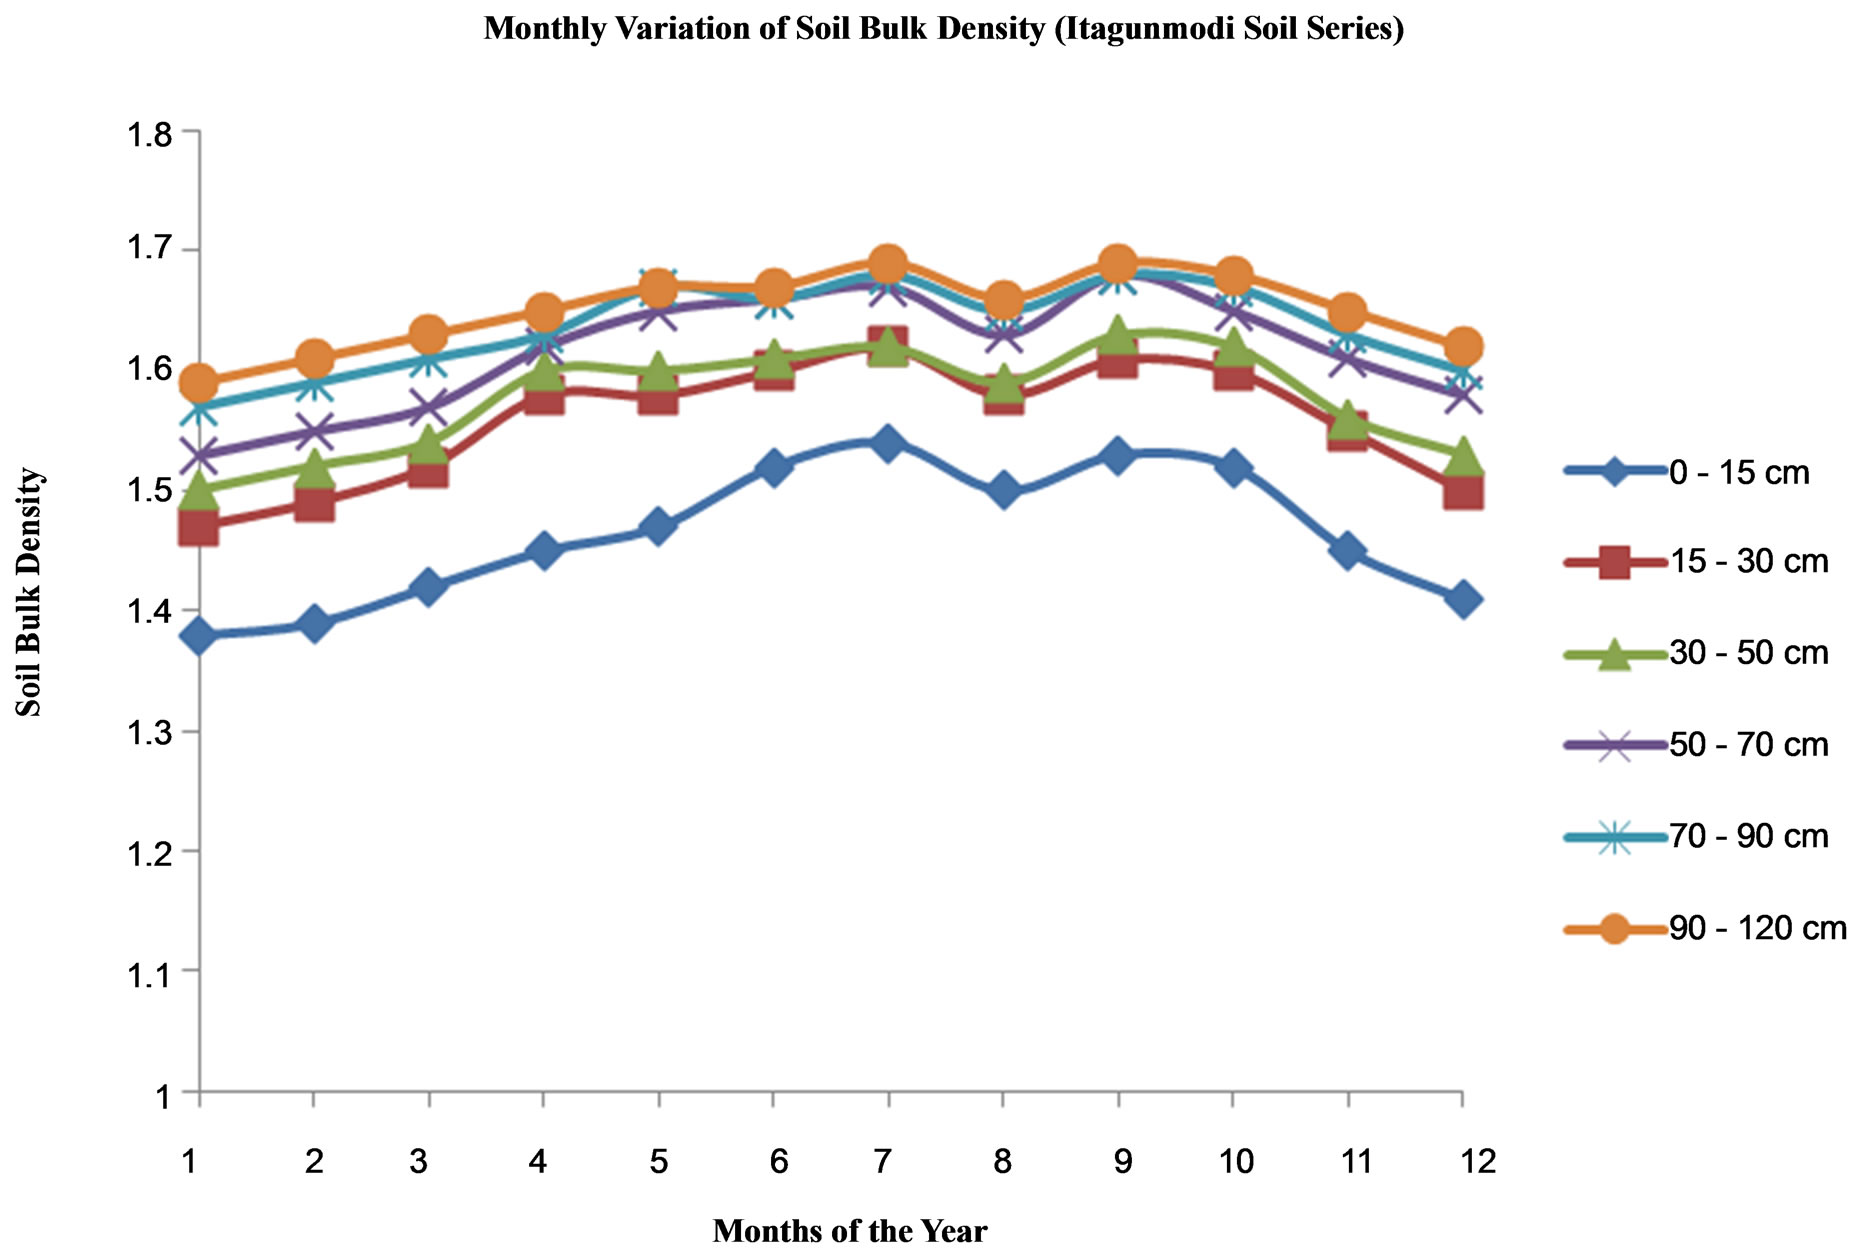
Figure 5. Monthly variation of soil water with the months of the year for Itagunmodi Soil Series.
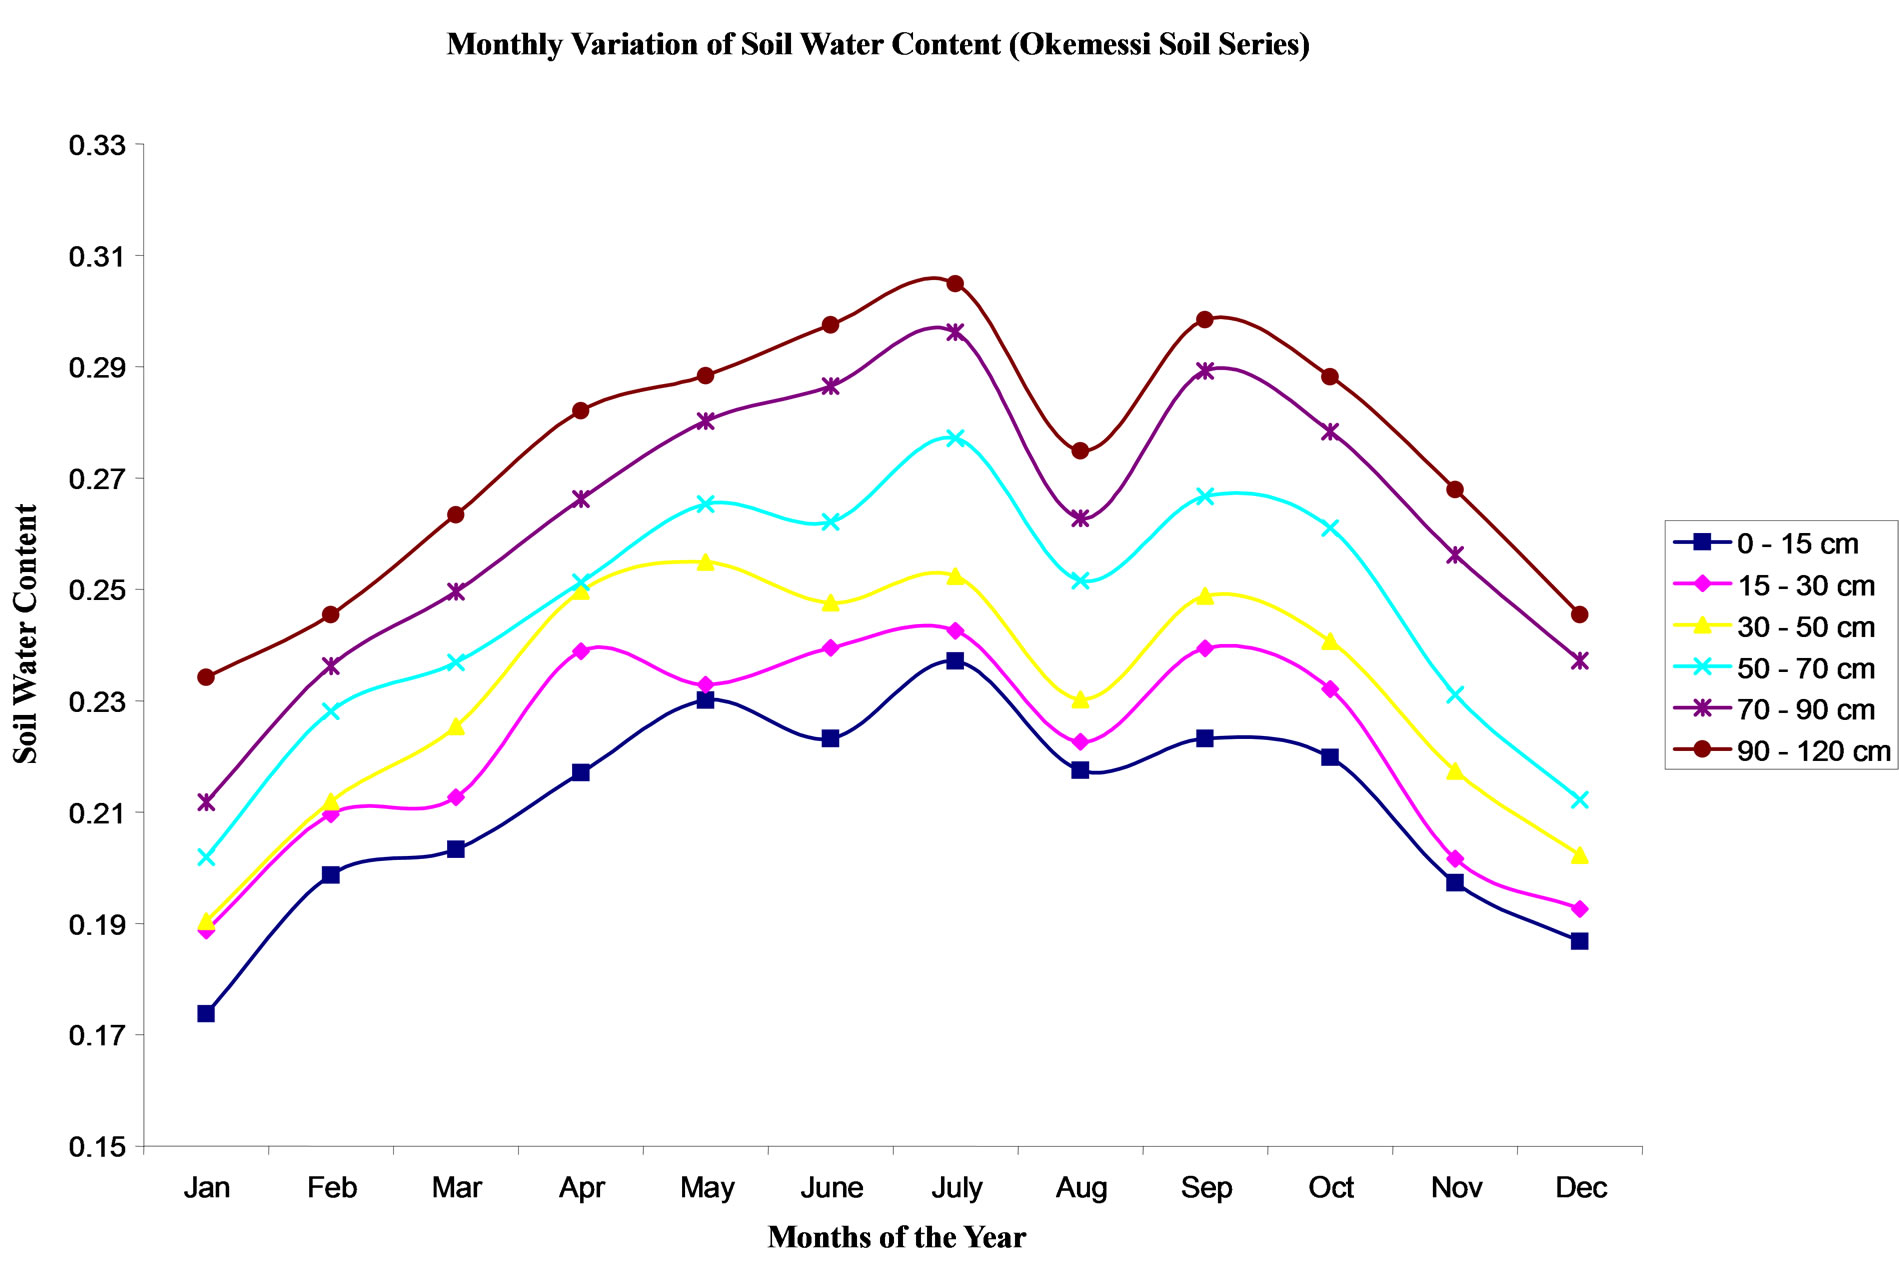
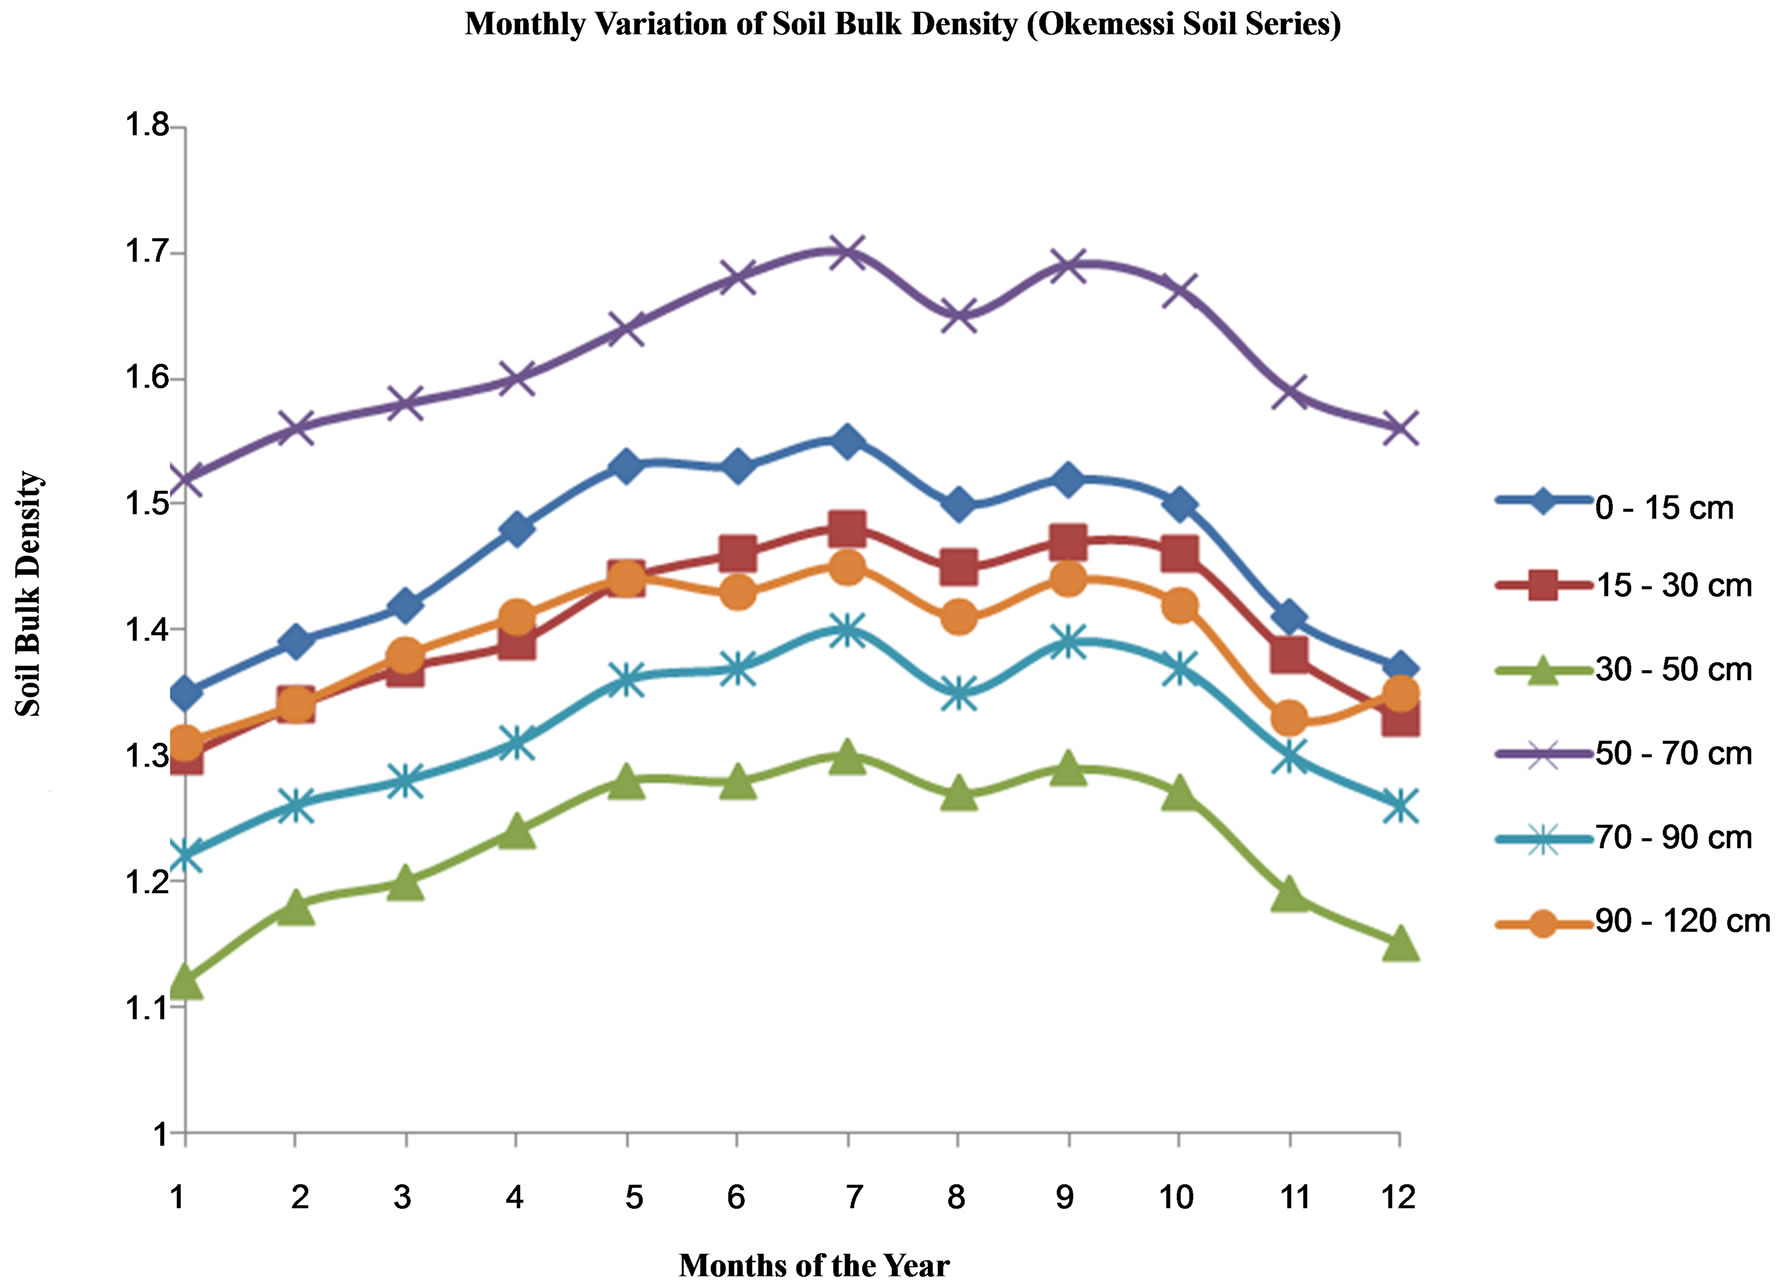
Figure 6. Monthly variation of soil water with the months of the year for Okemessi Soil Series.
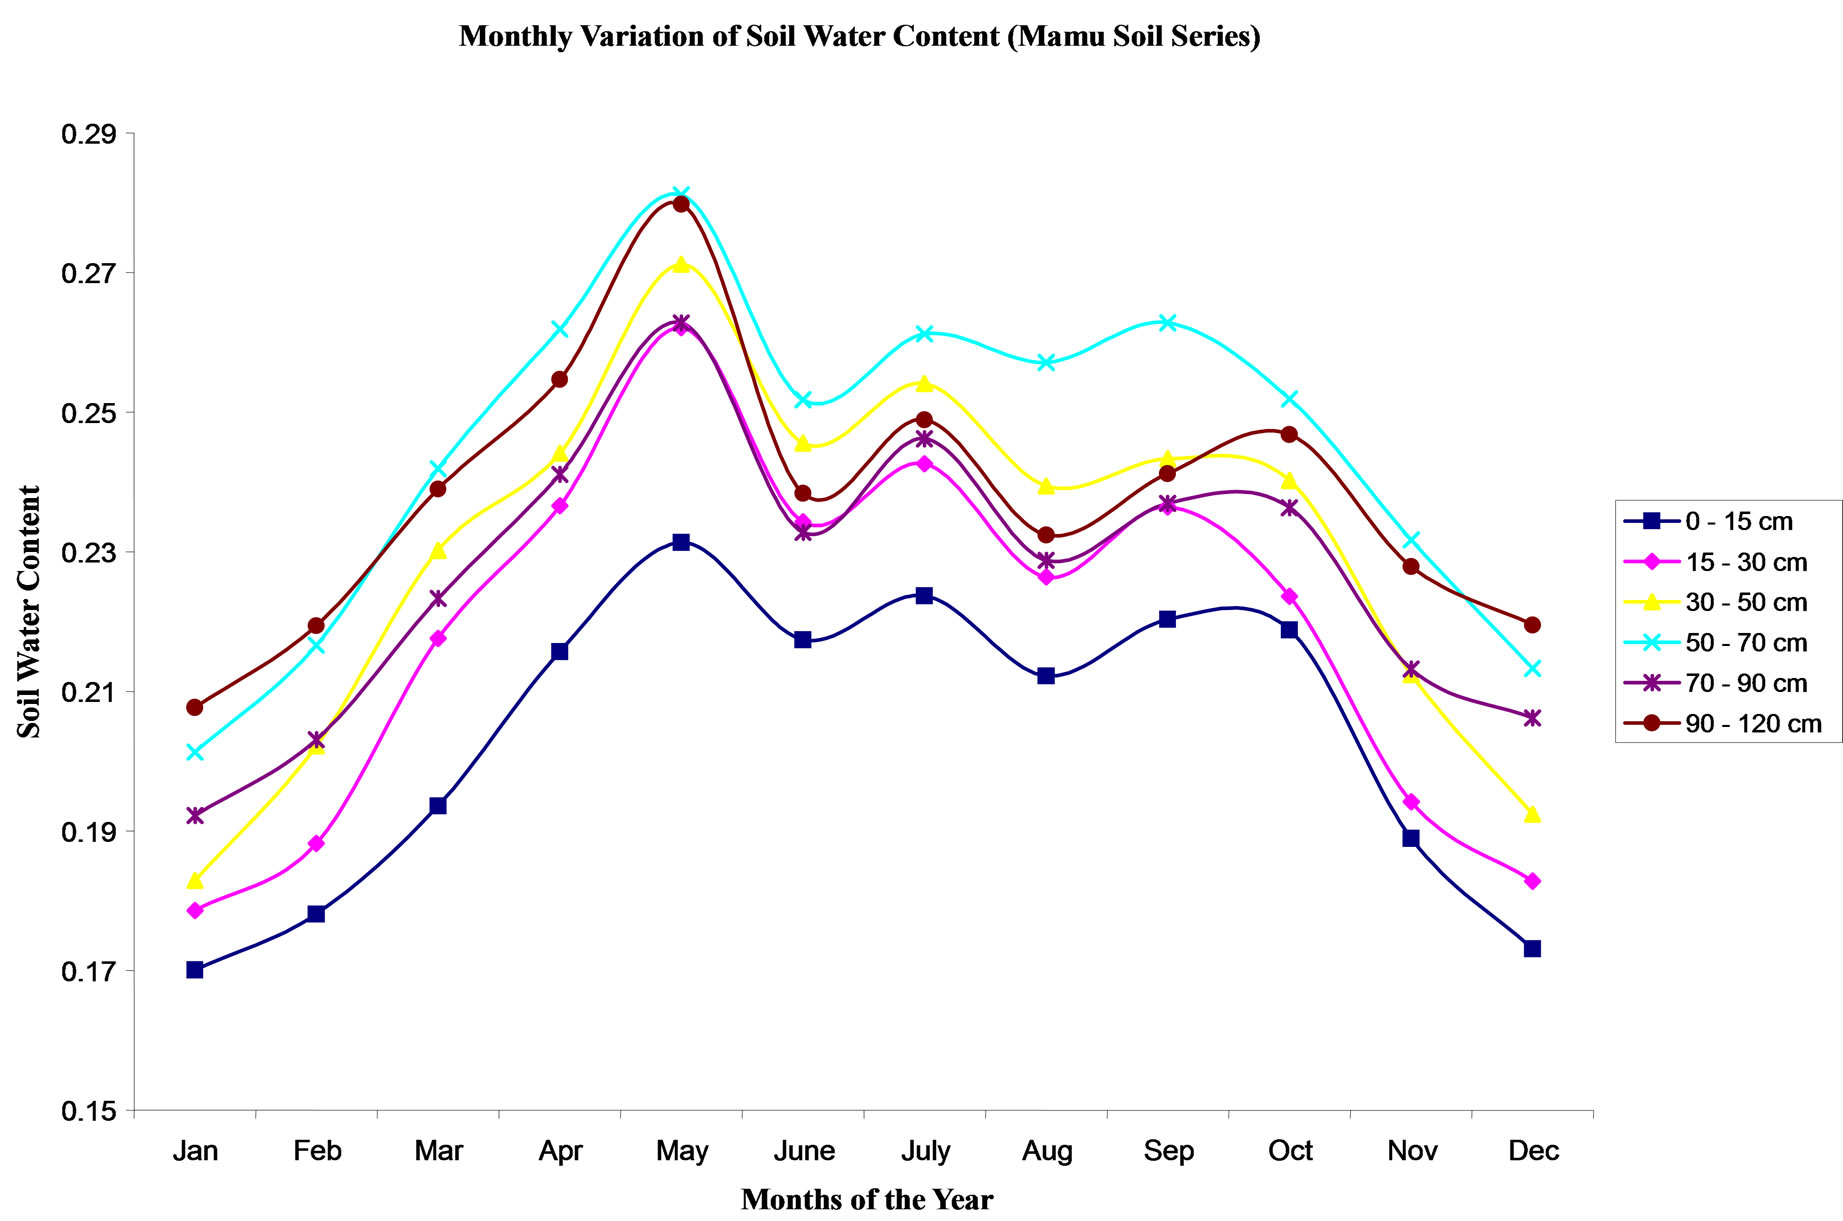
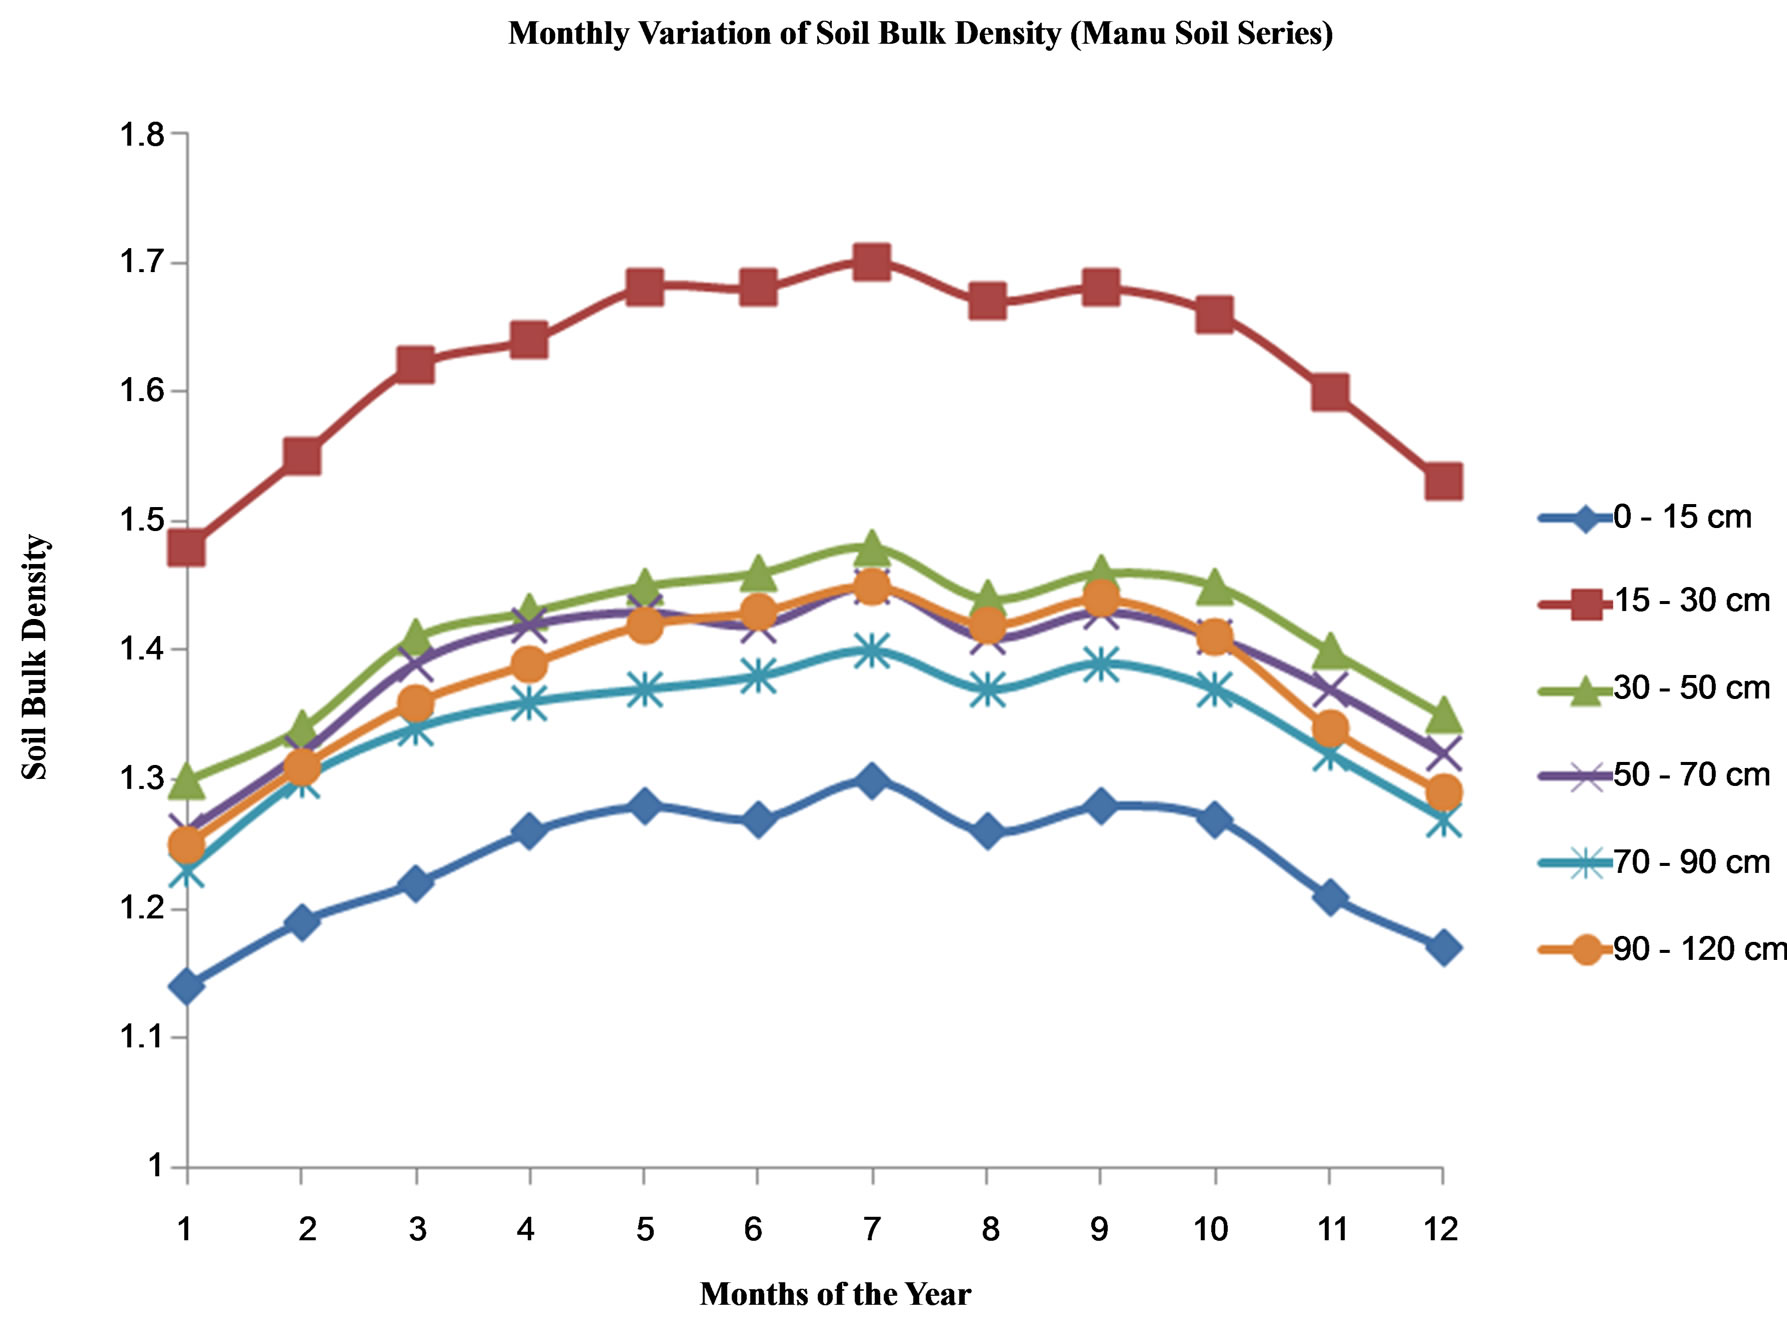
Figure 7. Monthly variation of soil water with the months of the year for Mamu Soil Series.
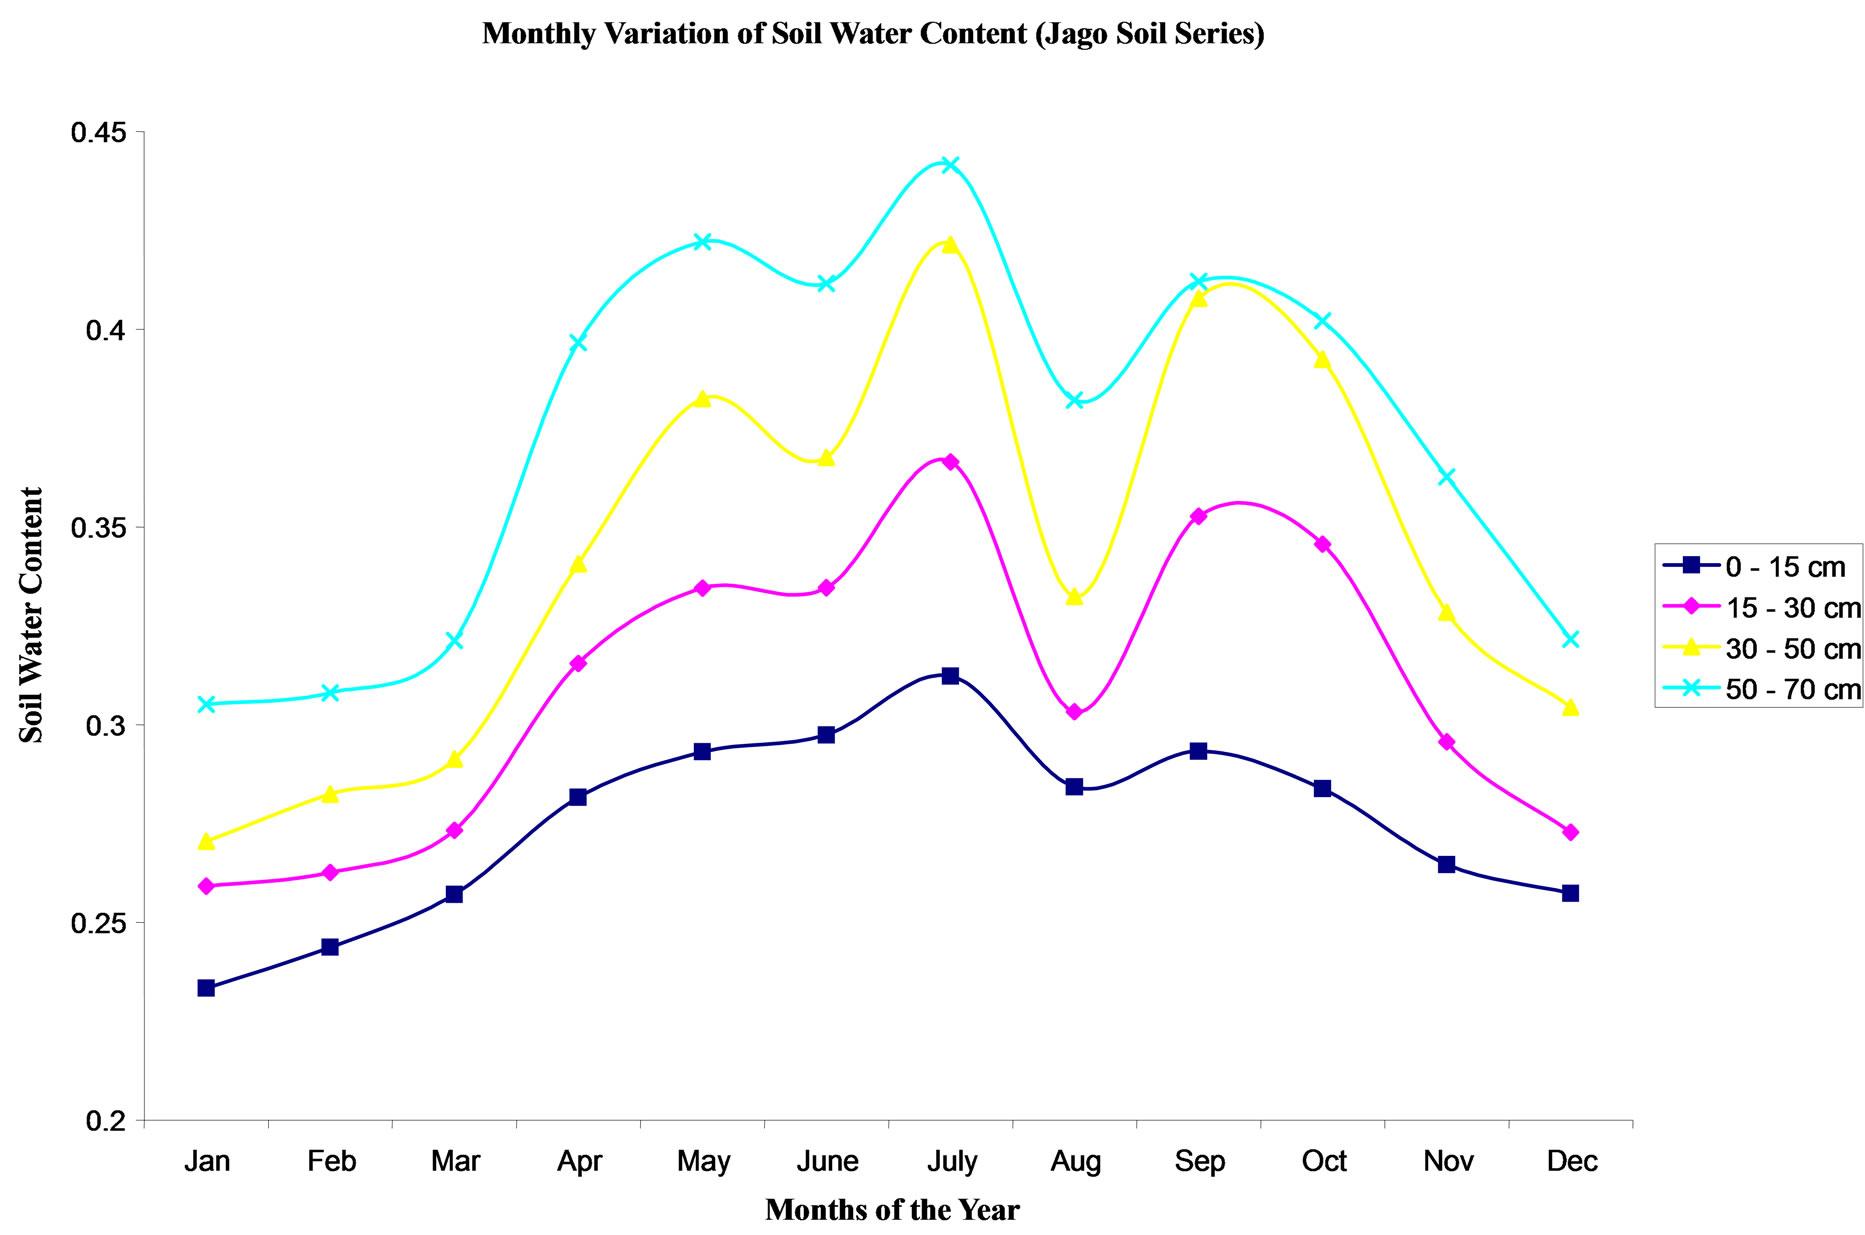
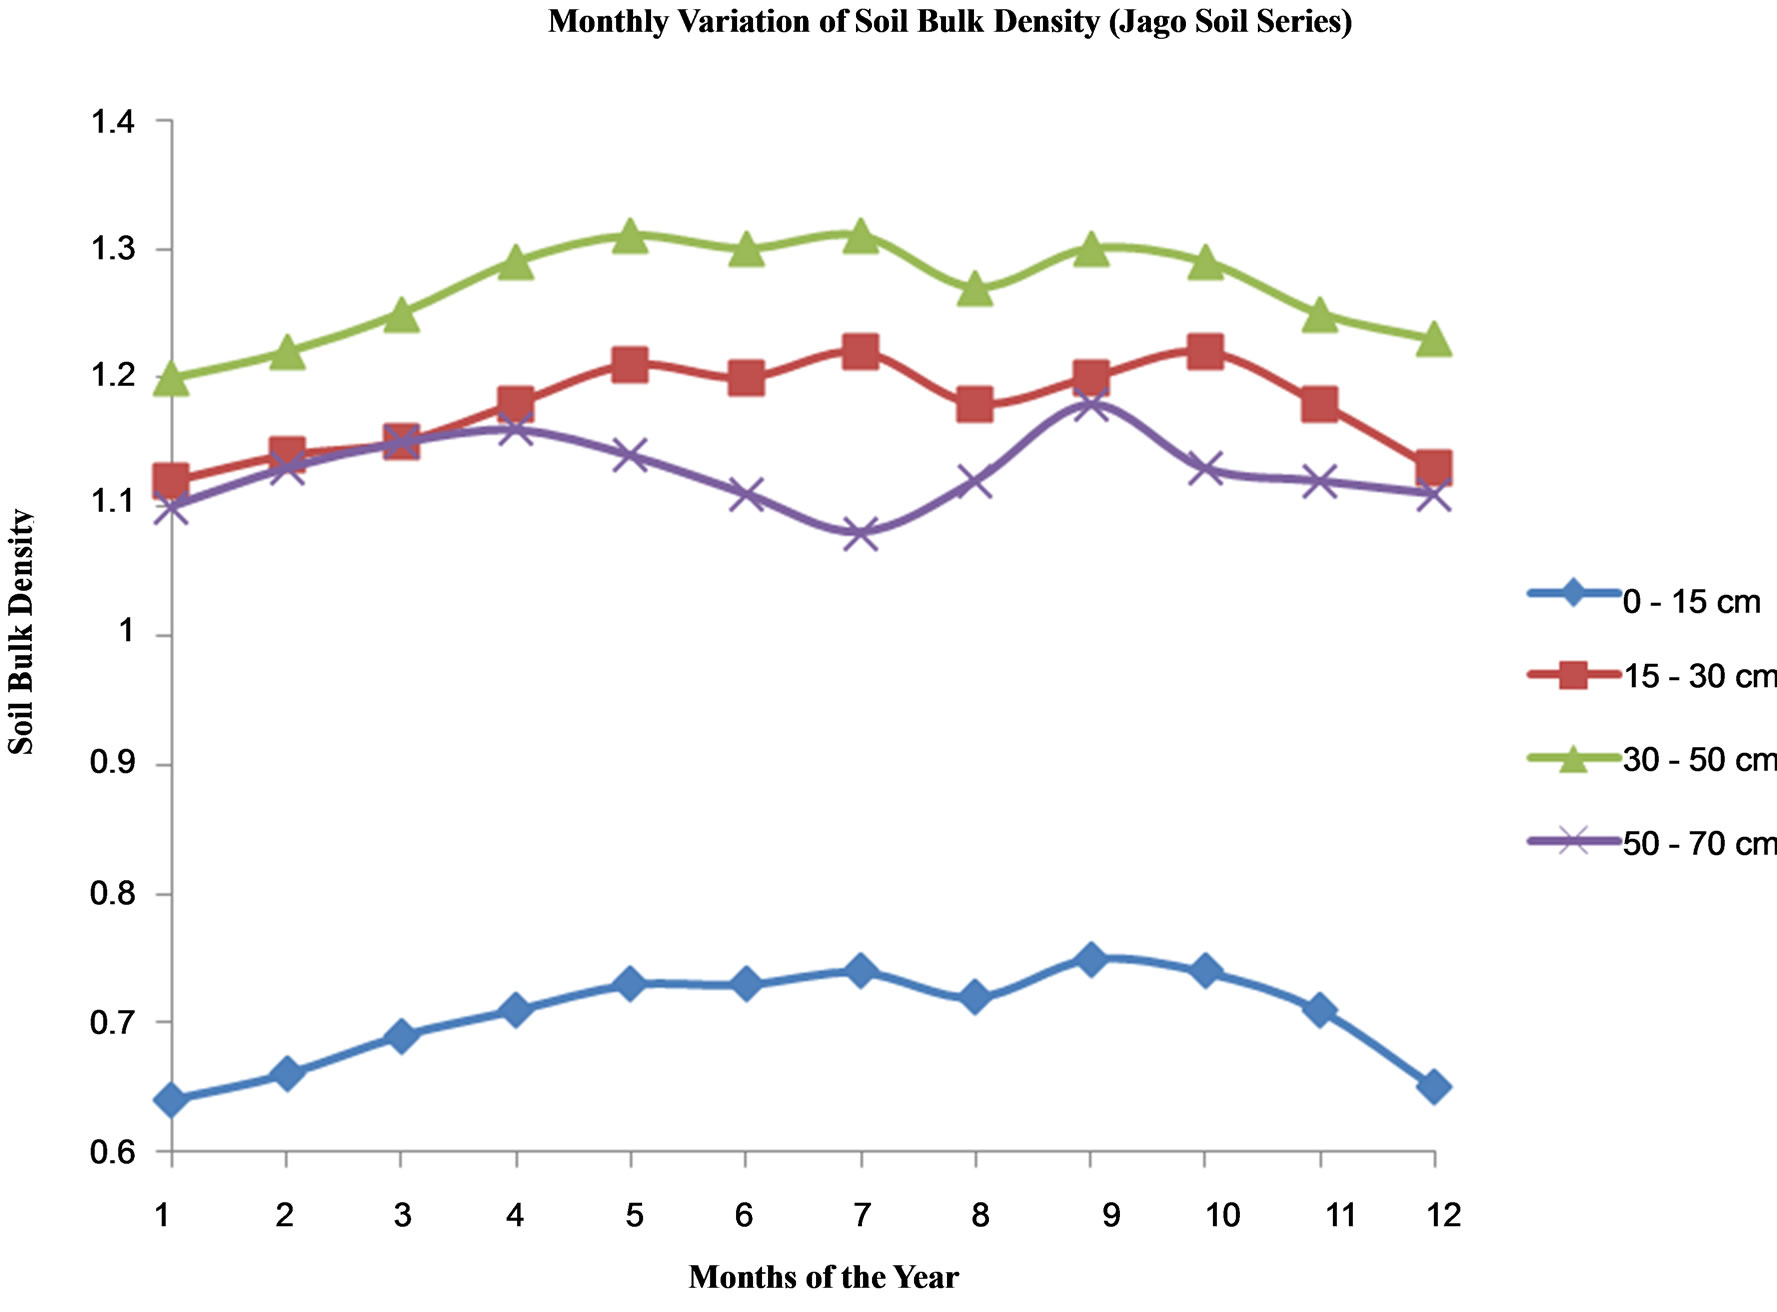
Figure 8. Monthly variation of soil water with the months of the year for Jago Soil Series.
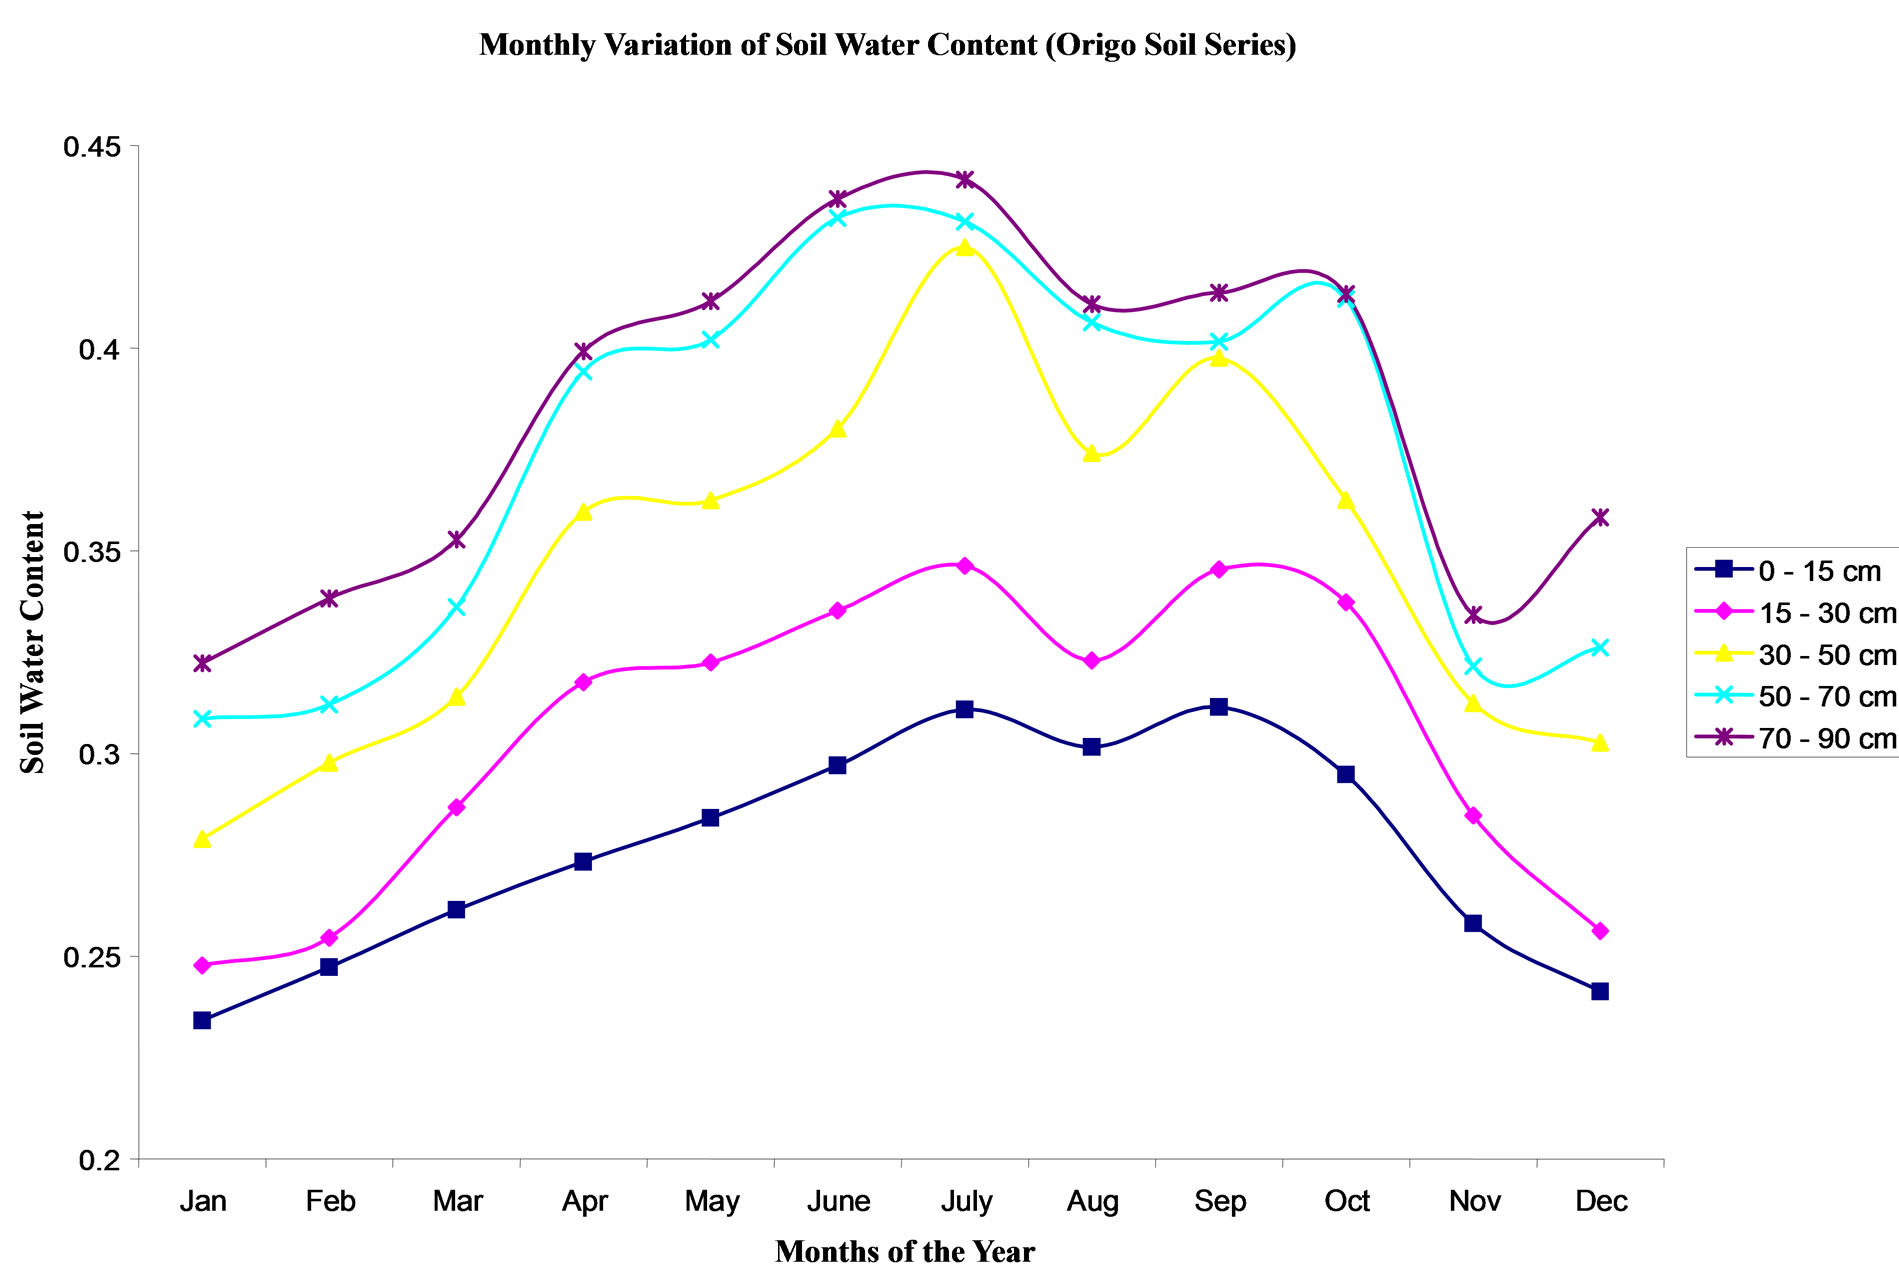
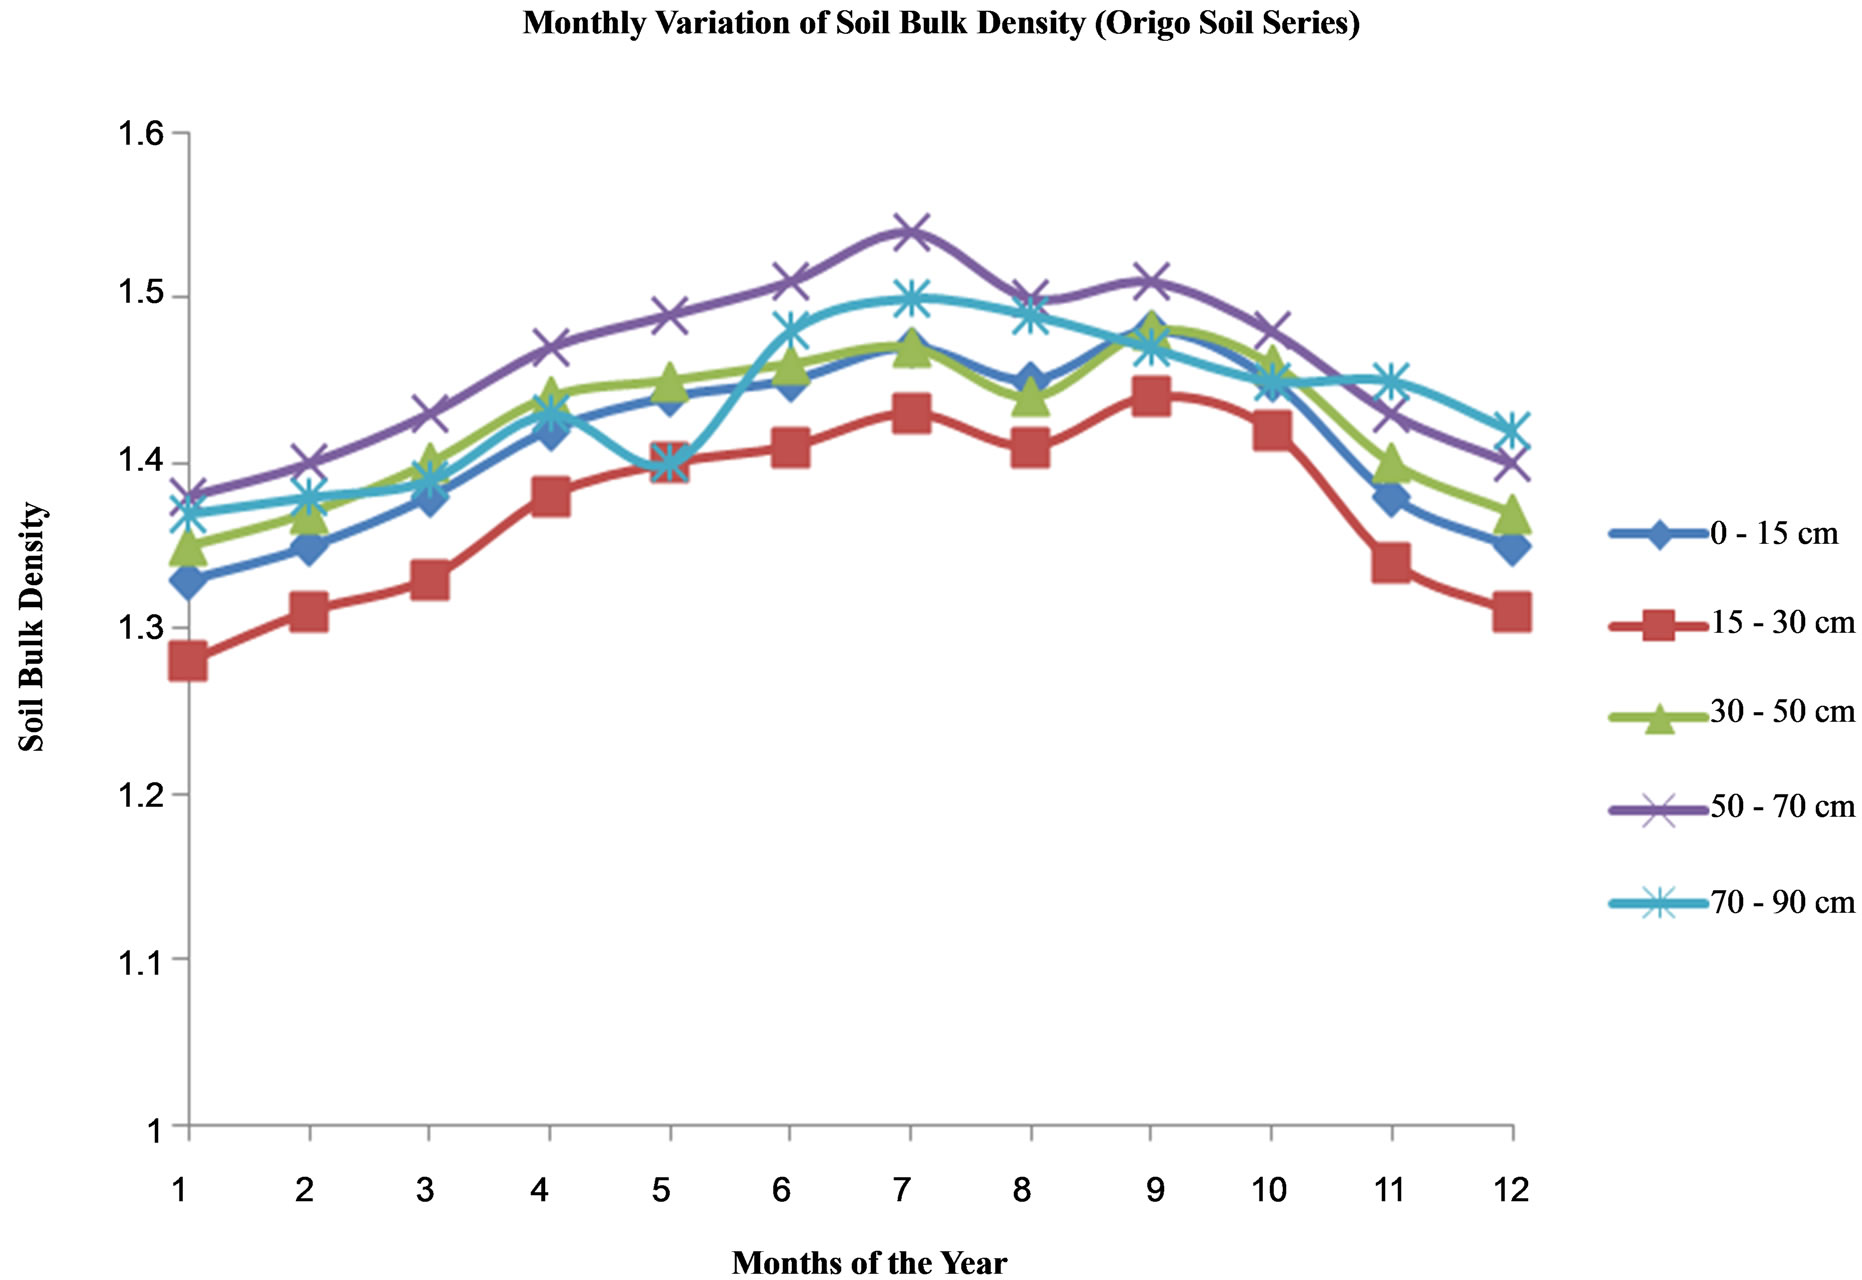
Figure 9. Monthly variation of soil water with the months of the year for Origo Soil Series.
plane (2 dimensions); the X-ray tube source irradiates the sample directly, and the fluorescence coming from the sample was measured by an energy dispersive XR- 100CR AMPTEK manufactured silicon X-Ray detector directly. The qualitative (elemental composition) and quantitative (concentrations of the elements present) analysis of the collected soil samples were determined. The computer program XCOM was applied to the raw results to generate total cross sections and attenuation coefficients on a standard energy grid. The weighting factors, that is, the fractions by weight of the constituents, were supplied by the user using the raw results. Theoretical estimates of the attenuation coefficients,  for the various soil series were obtained and compared with the experimental values.
3. Results
The results of the raw data (for the test samples taken at Ado-Ekiti) and calculation for the mass attenuation coefficient values for the eight (8) soil series at depths of interest mentioned in section 2.2 for June 2005 is displayed in Table 1. The results for the soil bulk densities and volumetric water contents for the eight (8) soil series at varying depths into the soil profile at monthly intervals from June 2006 to May 2007 are displayed in Figures 2- 9. Comparison of the results obtained for the soil bulk density,  and water content,
  using the dual energy gamma-ray transmission technique (DEGRTT) and that obtained by reference gravimetric method show a good agreement. Pearson correlation coefficient 0.987 was obtained for
  and 0.996 for
  after performing the 2-tailed significant test using the SPSS11.0 statistical package.
4. Discussions and Conclusions
4.1. Performance of the Radiological Technique
With the gravimetric method, the parameters  and
and  were measured independently after a 24-hour drying period, whereas it takes only 3 hours to accumulate sufficient data to measure these two parameters simultaneously using DEGRTT and this is due to the low activity of the available radioactive source. Since the results obtained by this radiological technique is accurate enough (when compared with the gravimetric (reference) method), this time and simultaneity advantages of DEGRTT should lay the foundation for a method of continuous monitoring of these parameters. Summarizing, the results of the monthly measurement of soil water contents obtained by DEGRTT are grouped according to the prevailing seasons of the year in Nigeria (harmattan, dry and wet). Between mid November and mid February the country is subjected to the harmattan season with short periods of hazy weather. From around March to mid May, the hot dry season typically predominates and from around late May to early October, a cooler rainy wet season is observed. For Iwo soil series, low values of θv was obtained during the harmattan season and the value reached a minimum of about 0.2 (20%) in January and thereafter began to rise in the dry season through to the wet season attaining a peak of about 0.36 (36%) in July at the 50 - 70 cm depth. Least soil water was obtained at the 0 - 15 cm depth and increased until it peaked at the 50 - 70 cm depth; it fell at the 70 - 90 cm depth and slightly rose at the 90 - 120 cm. Dry soil bulk density, ρs values ranged between 1.35 g/cm3 and 1.54 g/cm3 to 1.33 g/cm3 and 1.46 g/cm3 in the wet season for soil depths 0 - 120 cm. In the dry season, ρs values ranged between 1.26 g/cm3 and 1.35 g/cm3 to 1.29 g/cm3 and 1.39 g/cm3, and in the harmattan period, ρs values ranged between 1.27 g/cm3 and 1.39 g/cm3 to 1.22 g/cm3 and 1.33 g/cm3, for the same soil depths. For the Ondo soil series, a similar pattern with the Iwo type was observed with θv also attaining a minimum of about 0.2 (20%) in January, however it peaked at a value higher than 0.4 (40%) in July.
It’s ρs values ranged between 1.32 g/cm3 and 1.39 g/cm3 to 1.28 g/cm3 and 1.41 g/cm3 in the wet season, in the dry season, between 1.25 g/cm3 and 1.34 g/cm3 to 1.28 g/cm3 and 1.41 g/cm3, and in the harmattan period, ρs ranged between 1.24 g/cm3 and 1.35 g/cm3 to 1.22 g/cm3 and 1.30 g/cm3, for all the soil depths being considered. For Egbeda soil series, a similar pattern with the two considered series above was observed but for the minimum in January being around 0.23 (23%), the soil water content reaching a peak of about 0.4 (40%) at the 70 - 90 cm depth. Its ρs values ranged between 1.12 g/cm3 and 1.49 g/cm3 to 1.16 g/cm3 and 1.45 g/cm3 in the wet season, between 1.08 g/cm3 and 1.42 g/cm3 to 1.09 g/cm3 and 1.45 g/cm3 in the dry season, and ranged between 1.11 g/cm3 and 1.42 g/cm3 to 1.05 g/cm3 and 1.39 g/cm3 in the harmattan period. For 4) Itagunmodi soil type, the pattern was slightly different from those above; the least θv value was observed in the harmattan period with a minimum value of about 0.21 (21%) in January at the 0 - 15 cm depth, but rising within the depths considered to a peak value of about 0.38 (38%) in July at the 90 - 120 cm depth. Its ρs values ranged between 1.47 g/cm3 and 1.67 g/cm3 to 1.52 g/cm3 and 1.68 g/cm3 in the wet season, between 1.42 g/cm3 and 1.63 g/cm3 to 1.45 g/cm3 and 1.65 g/cm3 in the dry season, and ranged between 1.45 g/cm3 and 1.65 g/cm3 to 1.39 g/cm3 and 1.61 g/cm3 in the harmattan period. 5) The Okemessi soil series had a similar pattern with the Itagunmodi type, with its θv attaining a minimum value of about 0.17 (17%) in January, rising thereafter to peak around 0.30 (30%) in July at the 90 - 120 cm depth. Its ρs values ranged between 1.53 g/cm3 and 1.44 g/cm3 to 1.50 g/cm3 and 1.42 g/cm3 in the wet season, between 1.42 g/cm3 and 1.38 g/cm3 to 1.48 g/cm3 and 1.41 g/cm3 in the dry season and between 1.41 g/cm3 and 1.33 g/cm3 to 1.39 g/cm3 and 1.34 g/cm3 in the harmattan season. 6) The Mamu soil series has a pattern similar to the Iwo and Ondo series having a minimum θv value of about 0.17 (17%) also in January, but peaking at about 0.28 (28%) in May at the 50 - 70 cm depth, falling sharply at the 70 - 90 cm depth to rise again at the 90 - 120 cm depth. The ρs values for this soil type ranged between 1.28 g/cm3 and 1.42 g/cm3 to 1.27 g/cm3 and 1.41 g/cm3 in the wet season, between 1.22 g/cm3 and 1.36 g/cm3 to 1.26 g/cm3 and 1.39 g/cm3 in the dry season and between 1.21 g/cm3 and 1.34 g/cm3 to 1.19 g/cm3 and 1.31 g/cm3 for the harmattan period. 7) The Origo soil series has a pattern different from the foregoing. The soil water content was low in the harmattan period, reaching its minimum value of about 0.23 (23%) in January and peaking in July at about 0.43 (43%) at the 70 - 90 cm depth. Beyond the 90 cm depth, no reasonable data was obtained. This may be attributable to the fact that soils of this series are known to have impeded drainage, caused by compact horizons of impervious clay which prevent the free movement of water at relatively high levels in their profiles. The ρs values for this soil type ranged between 1.44 g/cm3 and 1.40 g/cm3 to 1.45 g/cm3 and 1.46 g/cm3 in the wet season, between 1.38 g/cm3 and 1.39 g/cm3 to 1.42 g/cm3 and 1.43 g/cm3 in the dry season and between 1.38 g/cm3 and 1.45 g/cm3 to 1.35 g/cm3 and 1.38 g/cm3 for the harmattan period. For 8) Jago soil series, the pattern is similar to the Origo type; probably due to the fact that this soil type are known to be subject to water-logging within 120 cm of the surface during, at least, a part of the year. The soil water content was low in the harmattan period, reaching its minimum value of about 0.23 (23%) in January and peaking in July at about 0.43 (43%) at the 50 - 70 cm depth. Beyond the 70 cm depth, no reasonable data was obtained, infact during the rainy season, water bed was encountered and this is indicative of a possible perched acquifer. The ρs values for this soil type ranged between 0.73 g/cm3 and 1.14 g/cm3 to 0.74 g/cm3 and 1.13 g/cm3 in the wet season, between 0.69 g/cm3 and 1.15 g/cm3 to 0.71 g/cm3 and 1.16 g/cm3 in the dry season and between 0.71 g/cm3 and 1.12 g/cm3 to 0.66 g/cm3 and 1.13 g/cm3 for the harmattan period.
For each of the series, it is interesting to point out that while θv and ρs values obtained for the Iwo, Ondo and Mamu soil series peaked at the 50 - 70 cm depth, the Egbeda series peaked at the 70 - 90 cm depth. The Itagunmodi and Okemessi series peaked at the 90 - 120 cm depth. The Origo and Jago soil series differed from the others in that though they peaked at 70 - 90 cm and 50 - 70 cm depths respectively, no reasonable data was obtainable for them beyond these respective depths as a result of encountering water logged layers. The differences in the depths at which the peak values of θv and ρs were obtained for the different soil series may be due to variations in their nature. The Iwo, Ondo and Mamu soils are known to be well-drained, coarse textured, medium to fine textured and medium textured; the Iwo type overlying weakened rock material, the Ondo type overlay mottled clay and the Mamu type was derived from sericite schists. The Egbeda soil is well-drained, fine textured soil overlying mottled clay. The Itagunmodi type is welldrained, very fine textured soil derived from amphibolite and related basic rocks, the Okemessi type is also well-drained, but coarse textured, gravelly and derived from quartz schists and massive quartzite. The Origo series are fine textured soils with impeded drainage derived from diorite-gneiss, and the Jago series are soils of various textures which are affected by seasonally high water table derived from alluvium and local colluvium.
The variations in the values of soil water content with depth for the different soil series reveal the soil types that have high water table and hence soil types from which ground water reservoirs can easily be located close to the surface, thus, making possible pumping for irrigation use, easier and less expensive than those soils with deep water table. Hitherto, Government owned River basin Authorities (especially the Ogun-Osun and the Benin-Owena) operating in this area diverts surface water from the seven (7) major river systems that drain this southwestern Nigeria, for irrigation purposes, thus further depleting available freshwater resource. Exploiting ground water from possible “water reservoirs” for irrigation purposes should therefore go a long way in conserving the freshwater resource of this region. These measurements have revealed that useable ground water reservoir exist for the Jago and Origo soil types. In this work, to a fair extent, the location of “temporary water reservoir” in some of these soil types of Southwestern Nigeria have been identified, further work using tomographic image techniques to determine the volume of available water in these reservoirs will go a long way in designing irrigation pumping systems for optimal agricultural quality.
4.2. Soil Attenuation Coefficients Obtained by XCOM
The attenuation coefficients obtained experimentally and that calculated using XCOM, were compared and discrepancies were observed between them. The raw result of the XRF analysis reveal elements with atomic numbers 19 and above as detected. This discrepancy can be attributed to the instrumental limitation imposed by the EDXRF spectrometer used for the analysis. This spectrometer could not detect elements with atomic numbers less than 19. The fact that the constituent elements in silica (silicon and oxygen) both have atomic numbers less than 19 may account for the observed consistent lower attenuation coefficients (since the contributions of these elements to total attenuation are not included) obtained with XCOM as compared with the respective experimentally obtained attenuation coefficients. The XRF analysis also show fairly high concentration values of Potassium, K and Iron, Fe for the Iwo soil series in all the depths, with the highest Fe concentration value of 5.089 ppm obtained at the 90 - 120 cm depth and the highest K value of 2.9613 ppm obtained at the 50 - 70 cm depth. Ondo soil series show Fe and Titanium, Ti as having the highest concentrations. The highest Fe value of 4.4691 ppm at the 50 - 70 cm depth and highest Ti value of 1.4822 ppm at the 0 - 15 cm depth was recorded. Egbeda soil series show high Fe value of 6.3438 ppm at 15 - 30 cm depth, K value of 2.3315 ppm at 0 - 15 cm and Ti value of 2.5159 ppm at 15 - 30 cm depth. Itagunmodi series show high concentration values of Fe and Ti; highest Fe value of 6.6845 ppm was obtained at the 30 - 50 cm depth while the highest Ti value of 1.8690 ppm was obtained at the 90 - 120 cm depth. The Okemessi series displayed high concentration values for Fe, K and Ti. The highest Fe value of 5.0252 ppm was obtained at the 90 - 120 cm depth, highest K value of 2.2763 ppm was obtained at 70 - 90 cm depth and the highest Ti value of 2.2975 ppm obtained at the 15 - 30 cm depth. Mamu series showed high Fe and K concentration values of 3.4996 and 3.3636 ppm respectively at the 30 - 50 and 50 - 70 cm depths respectively. Jago soil series showed high Fe and Ti values; highest Fe value of 5.1191 ppm obtained at the 50 - 70 cm depth and highest Ti value of 1.6453 ppm obtained at the 0 - 15 cm depth. The Origo series showed high Fe and Ti concentrations. Highest Fe concentration of 4.7193 ppm was obtained at the 90 - 120 cm depth, while the highest Ti concentration value of 1.0513 ppm obtained at the 30 - 50 cm depth. The soil sample collected for Origo type at the 90 - 120 cm depth was very muddy and was allowed to dry up before being subjected to XRF analysis. Summarizing, the Iwo and Mamu soils have high Fe and K concentrations with that of Iwo being higher and the  obtained for Iwo soil series are comparatively higher than that of Mamu. Similarly, the elemental concentrations of Fe, K, and Ti in Egbeda and Okemessi soils are high and that of Egbeda being higher; the
  obtained for Egbeda is higher than that of Okemessi. Ondo, Itagunmodi, Origo and Jago types have high Fe and Ti concentrations; the concentrations for Itagunmodi being highest followed by that of Jago, Origo and Ondo in that order. The
  value for Itagunmodi was highest, followed by that of Origo, Ondo and that of Jago being inexplicably the lowest.
4.3. Conclusions and Recommendations for Further Work
Soil bulk density and water content are two parameters that find applications in various fields of human endeavour, including agriculture. These data on temporal and spatial variations of soil wetness and bulk density have provided information about soil moisture and more importantly about the exact depth at which possible “temporary water reservoirs” are located. This information will be of tremendous assistance to designers of sprinklers and drip irrigation systems to develop systems that will pump irrigation water from such ground water reservoirs and also deliver water at rates that will achieve optimal agricultural plant production and quality.
When improvement is attained with instrumental accuracy through procurement of more sensitive EDXRF spectrometer or WDXRF spectrometer within the University or in the country, further work can be carried out to determine the exact elemental composition of the soil samples by XRF analysis. Further work can also be carried out to determine soil water potential, and in conjuction with measurements of soil water content, advance computer prediction programs may be developed for the hydrological movement of soil water. Further work can also be carried out using the principles of tomography which makes use of reconstruction algorithms to resolve the internal distribution of phase content or density (three dimensional) of the soil sample in the determination of volumetric soil water content. Also tomographic image techniques can be used to determine the volume of available water in suspected “temporary water reservoirs” in the Jago and Origo soil types; this should go a long way in designing irrigation pumping systems to pump water from these “temporary water reservoirs”, thus making possible pumping for irrigation use easier and less expensive than those soils with deep water table.
REFERENCES
- O. O. Adejumo, “Soil Bulk Density and Water Content Measurement of Southwestern Nigerian Soils by Dual Energy Gamma-Ray Transmission Method,” Ph.D. Thesis, 2009.
- A. C. Moreira, O. P. Filho, F. H. M. Cavalcante, M. M. Coimbra and C. R. Appoloni, “Gamma Ray Transmission for Hydraulic Conductivity Measurement of Undisturbed Soil Columns,” Brazilian Archives of Biology and Technology, Vol. 50, No. 2, 2007, pp. 321-328. doi:10.1590/S1516-89132007000200017
- J. C. Corey, S. F. Peterson and M. A. Wakat, “Measurement of Attenuation for Cs and Am Gamma Rays for Soil Density and Water Content Determinations,” Soil Science Society of America Journal, Vol. 35, No. 2, 1971, pp. 215-219. doi:10.2136/sssaj1971.03615995003500020016x
- J. W. Hopmans and J. H. Dane, “Calibration of a DualEnergy Gamma Radiation System for Multiple Point Measurement in a Soil,” Water Resources Research, Vol. 22, No. 7, 1986, pp. 1109-1114. doi:10.1029/WR022i007p01109
- M. E. Grismer, D. B. McWorther and A. White, “Monitoring Water and Soil Movement in Soils at Low Solution Contents,” Soil Science, Vol. 141, No. 2, 1986, pp. 163- 171. doi:10.1097/00010694-198602000-00010
- M. Oostrom, J. H. Dane, O. Guven and J. S. Hayworth, “Experimental Investigation of Dense Solute Plumes in an Unconfined Aquifier Model,” Water Resources Research, Vol. 28, No. 9, 1992, pp. 2315-2326. doi:10.1029/92WR01265
- J. H. Dane, M. Oostrom and B. C. Missildine, “An Improved Method for the Determination of Capillary Pressure-Saturation Curves involving TCE, Water and Air,” Journal of Contamination Hydrology, Vol. 11, No. 1-2, 1992, pp. 69-81. doi:10.1016/0169-7722(92)90034-C
- H. Vine, “Latosols of Nigeria,” Proceedings of the 2nd Inter-African Soils Conference, Leopoldville, 9-14 August 1954.
- J. D’Hoore, “Third Draft S.P.I Soils Map of Africa,” Presented at 7th International Congress of Soil Science, Madison, 1960.
- A. J. Smyth and R. F. Montgomery, “Soils and Land Use in Central Western Nigeria,” Government Printer Ibadan, Western Nigeria, 1962.
- R. W. J. Keay, “Derived Savanna Derived from What?” Bulletin de l’Institut Fondamental d’Afrique Noire: Series A: Sciences Naturelles, Vol. 21, 1959, pp. 427-438.
NOTES
*Corresponding author.