Journal of Environmental Protection
Vol. 3 No. 9A (2012) , Article ID: 22944 , 7 pages DOI:10.4236/jep.2012.329128
A Cross-Sectional Mortality Study Comparing the Use of Actual and Modeled Air Pollution Data
![]()
University of Wisconsin, Madison, USA.
Email: *dominika_dziegielewska@hotmail.com
Received May 20th, 2012; revised June 19th, 2012; accepted July 24th, 2012
Keywords: chronic mortality; air pollution; particulate matter
ABSTRACT
Cohort epidemiological studies consistently agree that small particulates increase mortality, but they do not agree about the magnitude of this effect. As cohort studies have included observations from more places, they have found smaller effects. This study relies on a sophisticated air pollution model to predict pollution concentrations across all counties in the contiguous United States. We test whether examining all counties in the US affects the magnitude of the pollution mortality effect. We find significant but smaller effects. The results suggest that continued epidemiological research using a broader base of locations is needed.
1. Introduction
The link between air pollution concentrations and human mortality is difficult to measure because it is not possible to conduct direct experimentation. Instead, the epidemiological literature has relied on three general types of studies: cross-sectional studies, intertemporal acute studies, and chronic panel studies. The cross sectional studies tend to rely on aggregated data usually at the county level [1-4]. The general advantage of these studies is that they include a large population and many sites but the disadvantage is that they do not carefully control for individual characteristics of people. The acute studies have examined pollution episodes in numerous cities and related them back to increased daily mortality [5-8]. The advantage of these studies is that the people remain the same and only the pollution changes over time. However, the disadvantage of this approach is that other factors may also change over time such as weather and that the acute effect of pollution may be only a component of chronic damages. Finally, the prospective panel studies look at selected individuals over time in selected places [9-14]. The panel studies do an excellent job controlling for the characteristics of people but they are expensive and so they rely on limited sites. It is always possible that undesired spatial variables (such as poor housing conditions or population density) are correlated with pollution concentrations across these few sites. Currently, only three cohort studies have been conducted to study particulate matter, PM2.5 [9,10,13]. The data from these studies (especially the first two) has received extensive secondary analysis [15-19].
A weakness of all the chronic studies of pollutionmortality effects is the limited available measurements of ambient pollution concentrations. There are not only relatively few measurements, but the measurements are also in non-randomly assigned locations. Pollution monitoring stations are located for enforcement purposes, not scientific inquiry. The stations tend to be clustered in highly populated areas near sources of pollution. Few stations are located in rural areas or in areas with less pollution. The stations thus provide less than the desired amount of variation in pollution concentrations and may not be representative of actual exposures. Some studies have tried to adjust for the absence of pollution stations by using statistical extrapolations. The extrapolations, however, have been relatively simplistic using only distance, humidity, and wind patterns. These extrapolations introduce errors in measurement in the pollution variable thus possibly biasing the pollution coefficients in the mortality regressions towards zero.
This study tries to overcome the limitations associated with available concentration data by relying on modern air quality modeling. Beginning with the US Environmental Protection Agency’s spatially detailed emission inventory, we use the Community Multi-scale Air Quality (CMAQ) model to predict concentrations in each county in the contiguous United States. We then conduct a cross-sectional analysis of human mortality in order to explore whether modeled pollution data could improve upon results that rely exclusively on observed pollution measurements. The modeled data allows us to compare the impacts across all counties in the United States, not just the urban areas studied in the cohort studies. In this study, we focus on the impact of PM2.5 on chronic mortality among adults 30 years and older. We analyze the effect on non-accidental mortality as well as cause-specific categories such as cardiopulmonary illnesses, cardiovascular disease, respiratory causes, lung cancer, nonlung cancers, and all other remaining causes of non-accidental fatalities. The age specification and categories of mortality were created for direct comparability with the existing panel studies. We specifically focus on comparability with the study by Dockery et al. (1993), referred to as the Six Cities or Harvard study and the study by Pope et al. (1995) known as the American Cancer Study (ACS). Both studies have been extensively reanalyzed by Health Effect Institute (HEI) [16]. The HEI replicates the major findings of both studies and, therefore, it will be used here for comparison with our results.
2. Empirical Methodology
Our study relies on cross-sectional analysis. The unit of observation is a county, and the variables are all county averages. The advantage of using this approach is that we effectively conduct the study on about 100 million people across a broader range of pollution concentrations than were possible in the cohort studies. This much larger sample of sites can also do a better job of controlling for spatial characteristics that may correlate with pollution in a metropolitan area. The disadvantage of the cross sectional approach using county data is that one cannot control for personal characteristics. We assume that the impact of (PM2.5) is homogenous across all individuals, and the exposure is homogenous within each county. We assume a simple model of mortality:
 (1)
(1)
 where risk of death for an individual i is a function of PM2.5, income m, marital status x, education c, available medical care z, and non-environmental characteristics of the place of living, s, such as the crime rate. Following the literature, we specify a log-linear specification, where mortality, yj, is the average annual mortality in county j and β is a vector of estimated coefficients:
 (2)
(2)
We estimate the coefficients using a weighted least squares multiple regression where W is a diagonal matrix whose elements are the square root of population size in each county:
 (3)
(3)
For consistency with the epidemiological literature, we report our results as the relative risk or risk ratio (RR):
 (4)
(4)
We compute the 95% confidence interval of RR to reveal the accuracy of the measure.
3. Data Sources
Our mortality data has been provided by the National Center for Health Statistics (NCHS). We combined the Compressed Mortality files from 1989 to 2000 for adults 30 years and older in order to create a long term county level mortality rate. We create mortality rates by combining the mortality counts with corresponding age specific county level data on population size. We consider mortality rates associated with only non-accidental causes of death. We also calculate individual mortality rates for cardiopulmonary causes, cardiovascular, respiratory, lung cancer, other types of cancers, and other causes that include the remaining non-accidental mortality.
The mortality rates are combined with socio-economic data by county provided by the Census Bureau for the corresponding years. We consider likely mortality determinants: socio-economic variables (per capita family income, proportion of married people, education), county characteristics (population density, urban vs. rural, proportion of population in nursing homes) and available health care services approximated by the number of MDs per capita and proportion of hospital beds per capita. Additionally, we include detailed climate information on long term average seasonal temperatures and precipitation.
The pollution concentration data was created by the Community Multi-scale Air Quality (CMAQ) modeling system. The analysis starts with the USEPA’s 1996 Emission Inventory which listed all major polluters by exact location and then all small polluters by county. The inventory has the estimated tonnage of emissions for each source of pollution and each type of pollutant that might contribute to PM2.5 concentrations. The CMAQ model is designed to capture atmospheric chemistry and dispersion. Using weather data from 1996, we predicted the PM2.5 concentrations in every county in the lower 48 states. We chose the year of 1996 because the data were available and it was a relatively representative year without unusual meteorological, economic or pollution episodes.
4. Results
We first present two models of adult mortality from non-accidental causes. The general model includes all theoretically appropriate mortality covariates, while the parsimonious one is limited to statistically significant variables only. Both, the general and the parsimonious models presented in Table 1 confirm that non-accidental mortality is positively correlated with annual average concentration of fine particles. As expected, mortality is also negatively correlated with income, education and marital status. Accordingly, our results confirm earlier findings that married people with bachelor’s or more advanced degrees and higher income are on average expected to live longer. The general model also reveals that population density and crime rate are not significantly affecting the probability of non-accidental deaths and that urban counties with higher crime rates are not associated with higher mortality. Consequently, the variables of population density and crime rate are omitted in the parsimonious model. The access to medical care approximated by the number of hospital beds and physicians per capita is positively correlated with non-accidental mortality. These results point to the unavoidable weakness of all cross-sectional studies, which is the inability to account for population mobility. The cross sectional data that relies on aggregated information from death certificates assign individuals to counties where the death certificate was issued. Individuals in need of medical care may travel to counties where hospitals are located thereby being assigned to a pollution concentration from a county where they died not where they lived.
Our models show also that non-accidental mortality is higher in counties with a larger proportion of population in nursing homes. The mortality rate in both models is not age specific and includes all individuals 30 years or older. Age is highly and positively correlated with nonaccidental mortality. The mortality rate increases with age and is higher in counties with larger elderly populations1.
Table 1 also contains regressions of non-accidental mortality in two important subsamples of counties. The first subsample includes the counties that compose the ACS sample of urban sites. The second subsample is all the sites that are not included in the ACS sample. We wish to test in these regressions whether the regression coefficients are stable across all of these samples or whether they are affected by the sample drawn.
Table 2 looks at the risk ratios for each of the regressions in Table 1.
We standardize all RR in Table 2 to a 10 μg/m3 change in fine particles and compare them against the results from the Reanalysis of the ACS and Six Cities studies that are presented in the same standardized risk ratio form. There are several differences to keep in mind in making this comparison: the number of people involved, the number of sites measured, the accuracy of the pollution measurement, and the control of individual characteristics. The Harvard study followed 8111 adults in six cities with very careful pollution measurements and individual characteristics [11]. The American Cancer Study (ACS) followed a much larger cohort of 552,138 adults in 200 cities with less careful pollution measurements and individual characteristics [14]. This cross sectional study followed about 100 million people in 3111 counties with modeled ambient concentrations and no individual characteristics.
In the Appendix, we build separate models for specific causes of death. We test the same set of covariates in each of these cause-of-death regressions. We observe the same patterns as in Table 1 amongst the control variables in each of these regressions. We consequently focus our discussion on the results of the PM2.5 coefficients.
Table 3 presents the risk ratios (RR) and their confidence intervals for each cause-of-death regressions shown in the Appendix.
The results in Table 3 confirm the findings of both cohort studies that fine particulate matter significantly increases the risk of mortality from all non-accidental, as well as cardiopulmonary and cardiovascular causes. The estimates from all three studies show also that the impact on the non-accidental mortality risk is the lowest, followed by higher impact on cardiopulmonary and the highest on cardiovascular mortality. The respiratory mortality, all non-lung cancers and all other non-accidental causes of mortality are not significantly affected by PM2.5. The only discrepancy between our study and the ACS & Six City results is the effect on lung cancer. We find it to be significantly affected by pollution. The effect on lung cancer has been a controversial one. It is significant in some data sets and not in others. In fact, Pope and colleagues find a significant impact of fine particles on lung cancer in their later research [18]. They estimate that 10 μg/m3 increase in PM2.5 leads to about an 8% increase in the risk of fatal lung cancer. They also find that it is very close to the increased risk for all non-accidental mortality, which they estimate to be 7%. Our results also show the same risk ratios for lung cancer and all cause mortality, but the magnitude of the RR is lower (in both cases 4%). In fact, all of our significant risk ratios are consistently lower than both the ACS and the Six Cities studies. We estimate half of the effect predicted by the ACS data and less than one third of the Six Cities predictions. For example, our data shows that a 10 μg/m3 increase in fine particles increase the mortality risk from all non-accidental causes by 4 percent, while the ACS data shows 7 percent and the Six Cities study estimates a 15 percent increase. The same is true for the
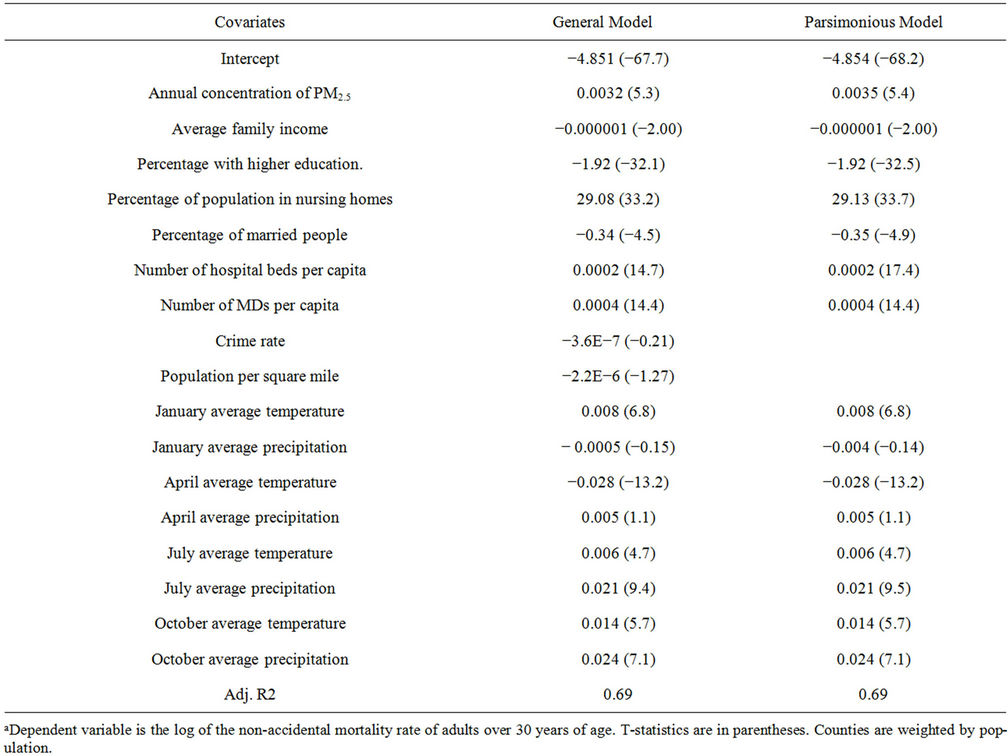
Table 1. Weighted least squares regression of the mortality rate on all countiesa.
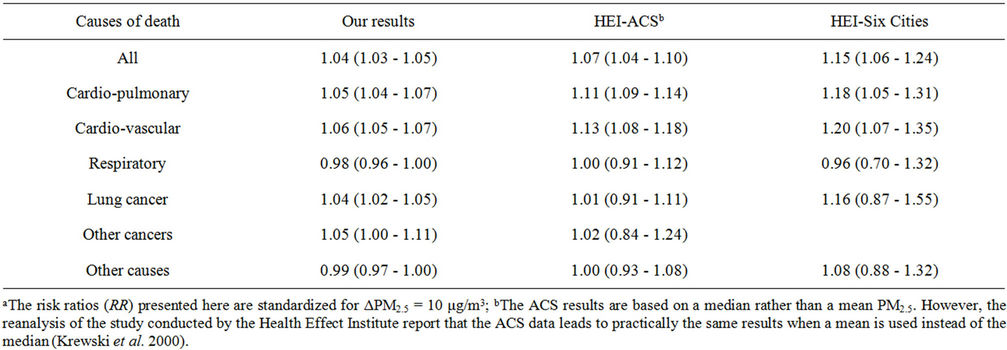
Table 2. Comparison of risk ratios for mortality and fine particles exposurea.
cardio-pulmonary mortality, where we compare our RR of 5% against 10% and 18% from the ACS and Six Cities respectively; as well as the 6% of cardio-vascular risk against 13% and 20% from the ACS and Six Cities respectively.
This consistent discrepancy is most likely result of the differences in sample sizes and stratifications used in all three studies. The Six Cities sample is the smallest (8111 observations) and collected from, as indicated by Six Cities. Their estimates are clearly the highest, and should

Table 3. Comparison of our risk ratios for mortality and fine particles exposure for the ACS and the non-ACS counties.
be interpreted as the impact observed in urban “hotspots.” The ACS sample is much larger (295,223 observations) and is collected from a larger area of 50 cities2. The cities are mostly located in the Eastern part of the US which tends to have a higher pollution concentration. Our data set is the most comprehensive and includes all 3111 US counties, both rural and urban. Therefore, our low estimates may suggest that the results from the cohort studies may overestimate the fine particle impact, and should be treated as an estimate of urban effect only. To pursue this hypothesis further, we divide our sample into two: one containing only counties that were analyzed in the ACS study and the other containing all other counties. Table 3 presents the comparison of results from the two sub-samples against the ACS results.
Our significant estimates from the ACS counties result in consistently higher risk ratios than our results from the non-ACS counties, confirming that studies that focus on urban counties only may overestimate the nation-wide impact of particular matter on mortality. We find that the impact of fine particles on all non-accidental mortality in all non-ACS counties is 3%, as opposed to 4% in the ACS ones. Both cardiopulmonary and cardiovascular mortality is increased in the non-ACS counties by 5% only in contrast to 6% and 7% in the ACS counties. The risk ratios from our ACS sample are still much lower then the risk ratios from the ACS study. One explanation of this discrepancy may be the non-linearity of the fine particle dose-response function even at relatively low concentration levels. Both cohort studies are based on older data with historically higher emissions. Additionally, both studies focus on high-concentration urban areas. The mean/median concentration in the original ACS study is 18.2 μg/m3 with the standard deviation of 4.4 μg/m3, as opposed to the CMAQ mean for 1996 of 10.8 μg/m3 with the standard deviation of 4.9 μg/m3. Even when focusing on the ACS counties only, CMAQ data produces a mean of only 14.9 μg/m3 with a standard deviation of 5.4 μg/m3. Therefore, using the two cohort results for estimating current nationwide mortality consequences may lead to serious overestimates of the actual impact of fine particles. The potential miscalculations are of non-trivial consequences when we consider that the ACS study doubles and the Six Cities study triples the risk we estimate.
5. Summary and Conclusion
This study applies modeled pollution data to estimate mortality risk associated with fine particulate matter. We estimate the impact of PM2.5 in all 3111 counties of the continental US on mortality rates for all non-accidental causes, cardiopulmonary, cardiovascular, and respiratory causes, lung cancer, other types of cancers, and other causes that include the remaining non-accidental mortality. We contrast our findings with the results of the reanalysis of two most prominent cohort studies by Dockery et al. (1993) and Pope et al. (1995). We confirm that fine particles significantly affect all non-accidental mortality, as well as cardiopulmonary, and cardiovascular mortality. We show, however, that the magnitude of the impact is much smaller than predicted by the cohort studies. These studies relied on much smaller data sets limited to urban locations, which led to overestimation of the mortality effect. Consequently, the damages from fine particles calculated using the cohort studies’ results have had serious upward bias. We estimate the size of the bias to be between 50% and 75% of the actual impact.
6. Acknowledgements
We thank Denise L. Mauzerall and Daniel Q. Tong for providing us with the CMAQ modeled air concentration data and the National Center for Health Statistics for providing us with Compressed Mortality files (1989-2000).
REFERENCES
- L. Lave and E. Seskin, “Air Pollution and Human Health,” Johns Hopkins University Press, Baltimore, 1977.
- R. Mendelsohn and G. Orcutt, “An Empirical Analysis of Air Pollution Dose Response Curves,” Journal of Environmental Economics and Management, Vol. 6, No. 2, 1979, pp. 85‑106. HUdoi:10.1016/0095-0696(79)90022-6U
- C. A. Pope III and D. W. Dockery, “Epidemiology of Chronic Health Effects. Cross Sectional Studies,” In: R. Wilson and J. Spengler, Eds., Particles in Our Air, Harvard University Press, Boston, 1996, pp. 149-167.
- P. J. Villeneuve, M. S. Goldberg, D. Krewski, R. T. Burnett and Y. Chen, “Fine Particulate Air Pollution and All-Cause Mortality within the Harvard Six Cities Study: Variation in Risk by Period Exposure,” Annals of Epidemiology, Vol. 12, No. 8, 2002, pp. 568-76. HUdoi:10.1016/S1047-2797(01)00292-7U
- D. W. Dockery and C. A. Pope III, “Acute Respiratory Effects of Particulate Air Pollution,” Annual Review of Public Health, Vol. 15, No. 1, 1994, pp. 107-113. HUdoi:10.1146/annurev.pu.15.050194.000543U
- C. A. Pope III and D. W. Dockery, “Acute Effects of PM10 Pollution on Symptomatic and Asymptomatic Children,” American Review of Respiratory Diseases, Vol. 145, No. 5, 1992, pp. 1123-1128. HUdoi:10.1164/ajrccm/145.5.1123U
- J. Schwartz and D. W. Dockery, “Increased Mortality in Philadelphia Associated with Daily Air Pollution Concentrations,” American Review of Respiratory Diseases, Vol. 145, No. 3, 1992, pp. 600-604.
- J. Schwartz and D. W. Dockery, “Particulate Air Pollution and Daily Mortality in Steubenville, Ohio,” American Journal of Epidemiology, Vol. 135, 1992, pp. 12-19.
- D. E. Abbey, N. Nishino, W. F. McDonnell, R. J. Burchette, S. F. Knusten, W. L. Beeson and J. X. Yang, “Long-Term Inhalable Particles and Other Air Pollutants Related to Mortality in Nonsmokers,” American Journal of Respiratory and Critical Care Medicine, Vol. 159, No. 2, 1999, pp. 373-382.
- D. W. Dockery, C. A. Pope III, X. Xu, J. D. Spengler, J. H. Ware, M. E. Fay, B. G. Ferris and F. A. Speizer, “An Association between Air Pollution and Mortality in Six US Cities,” New England Journal of Medicine, Vol. 329, No. 24, 1993, pp. 1753-1759. HUdoi:10.1056/NEJM199312093292401U
- F. Dominici, M. Daniels, J. M. Samet and S. L. Zeger, “Estimating PM10-Mortality Dose-Response Curves and Threshold Levels: An Analysis of Daily Time-Series for the 20 Largest US Cities,” American Journal of Epidemiology, Vol. 152, No. 5, 2000, pp. 397-412. HUdoi:10.1093/aje/152.5.397U
- F. Dominici, M. Daniels, S. L. Zeger and J. M. Samet, “Air Pollution and Mortality: Estimating Regional and National Dose-Response Relationships,” Journal of the American Statistical Association, Vol. 97, No. 3, 2002, pp. 100-111. HUdoi:10.1198/016214502753479266U
- C. A. Pope III, M. J. Thun, M. Namboodiri, D. W. Dockery, J. S. Evans, F. E. Speizer and J. C. W. Heath, “Particulate Air Pollution as a Predictor of Mortality in a Prospective Study of US Adults,” American Journal of Respiratory and Critical Care Medicine, Vol. 151, No. 3, 1995, pp. 669-674.
- J. M. Samet, F. Dominici, F. Curriero, I. Coursac and S. L. Zeger, “Fine Particulate Air Pollution and Mortality in 20 US Cities: 1987-1994,” New England Journal of Medicine, Vol. 343, No. 24, 2000, pp. 1742-1757. HUdoi:10.1056/NEJM200012143432401U
- M. Jerrett, R. T. Burnett, R. Ma, C. A. Pope III, D. Krewski, K. B. Newbold, G. Thurston, Y. Shi, N. Finkelstein, E. E. Calle and M. J. Thun, “Spatial Analysis of Air Pollution and Mortality in Los Angeles,” Epidemiology, Vol. 16, No. 6, 2005, pp. 727-736. HUdoi:10.1097/01.ede.0000181630.15826.7dU
- D. Krewski, R. T. Burnett, M. S. Goldberg, K. Hoover, J. Siemiatycki, M. Jarret, M. Abrahamowicz and W. H. White, “Reanalysis of the Harvard Six Cities Study and the American Cancer Society Study of Particulate Air Pollution and Mortality,” Special Report, Health Effects Institute, Cambridge, 2000.
- F. Laden, J. Schwartz, F. E. Speizer and D. W. Dockery, “Reduction in Fine Particulate Air Pollution and Mortality: Extended Follow-Up of the Harvard Six Cities Study,” American Journal of Respiratory and Critical Care Medicine, Vol. 173, No. 3, 2006, pp. 667-672.
- C. A. Pope III, R. T. Burnett, M. J. Thun, E. E. Calle, D. Krewski, K. Ito and G. D. Thurston, “Lung Cancer, Cardiopulmonary Mortality, and Long-Term Exposure to Fine Particulate Air Pollution,” Journal of American Medical Association, Vol. 287, No. 9, 2002, pp. 1132- 1141. HUdoi:10.1001/jama.287.9.1132U
- C. A. Pope III, R. T. Burnett, G. D. Thurston, M. J. Thun, E. E. Calle, D. Krewski and J. J. Godleski, “Cardiovascular Mortality and Long-Term Exposure to Particulate Air Pollution: Epidemiological Evidence of General Pathophysiological Pathways of Disease,” Circulation, Vol. 109, No. 1, 2004, pp. 71-77. HUdoi:10.1161/01.CIR.0000108927.80044.7FU
Appendix
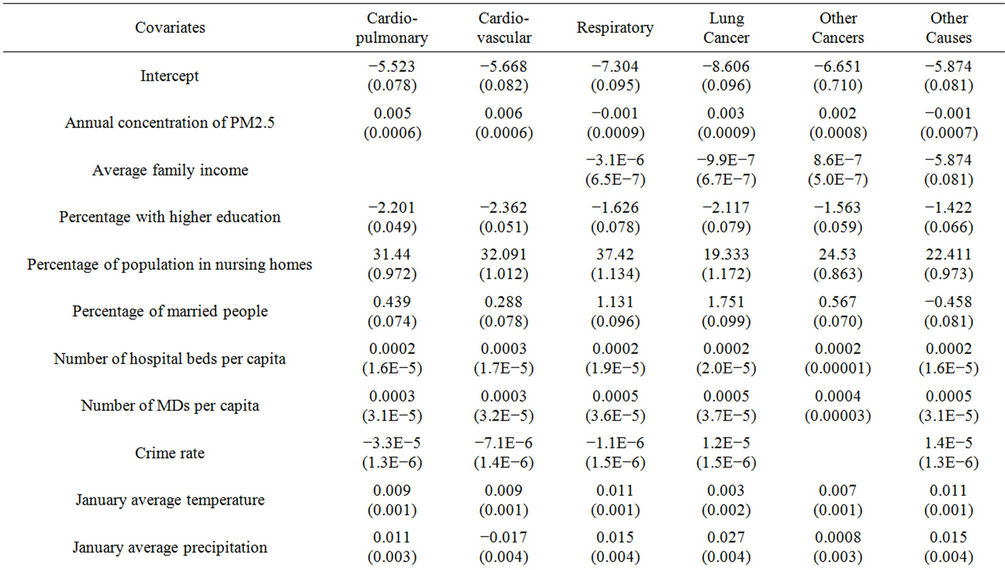

Table A1. Regression of adult (30+) mortality rate in all continental countiesa.
NOTES
*Corresponding author.
1Our age specific models reveal that the proportion of population in nursing homes is indeed correlated with non-accidental mortality only for the 65 and older part of the sample.
2The ACS study includes two cohorts. The fine particle cohort includes 50 cities and 295,223 observations, while sulfate cohort includes 151 cities and 552,138 observations.