Smart Grid and Renewable Energy
Vol.07 No.11(2016), Article ID:72076,22 pages
10.4236/sgre.2016.711021
Cost Estimation of Voltage Dips in Small Industries Based on Equipment Sensitivity Analysis
Leake Enquay Weldemariam1*, Vladimir Cuk1, Joseph Fraciscus Gerardus Cobben1,2
1Department of Electrical Engineering, Eindhoven University of Technology, Eindhoven, The Netherlands
2Dutch Electric Utility, Arnhem, The Netherlands

Copyright © 2016 by authors and Scientific Research Publishing Inc.
This work is licensed under the Creative Commons Attribution International License (CC BY 4.0).
http://creativecommons.org/licenses/by/4.0/


Received: October 20, 2016; Accepted: November 14, 2016; Published: November 17, 2016
ABSTRACT
Voltage dip is one of the detrimental power quality problems that can lead to huge financial losses in industries. Its economic impact is not only associated with the quality of the supply but also with sensitivity of electronic controls and equipment of the industry which are susceptible to voltage dips. Mitigating solutions are available but the choice depends on the careful assessment of the economic impact of voltage dips and economic gains of solutions. This paper presents an approach for estimating the economic cost of voltage dips based on sensitivity analysis. The voltage-tolerance curves of the sensitive equipment are obtained from experimental tests under different conditions. From the behavior and interaction of process equipment, different failure modes and economic sensitivity density are determined for different types of voltage dips. Voltage events monitored in the MV-network for several years are assessed to determine the frequency and severity of voltage dips at the customer terminal. The economic values of equipment and processes are assessed to get insight into alternative solutions with more rewarding measures. Then, cost-benefit analysis is performed to compare the economic gains of solutions protecting equipment or processes showing more rewarding economic values.
Keywords:
Economic Impact, Equipment Sensitivity, Power Quality, Voltage Dip

1. Introduction
Voltage dip is one of the most prevailing power quality (PQ) phenomena with a detrimental impact on industrial customers. The proper operation of modern industries relies on electronic controls and equipment which are susceptible to voltage dips mostly coming from the grid. The performance of a process against voltage dips depends on the severity of the disturbance and the robustness of the process equipment. The severity of voltage dips are often expressed in terms of magnitude and duration. On the other hand, the robustness of process equipment is a measure of the ride-through capability of devices against different voltage dips. The annual economic loss of an industrial plant depends on the number of voltages dips causing load outages, size of critical load, and cost of process interruption.
This paper presents an approach for assessing the economic loss of voltage dips in small industrial plants based on equipment sensitivity analysis. The paper is organized as follows: first, a critical review of existing standards and previous work is given in Section 2. In Section 3, the procedures to find the sensitivity index of different failure modes of processes in a facility are briefly described. Results of immunity curves of sensitive equipment and the actual failure modes are analyzed in Section 4. The economic impact of voltage dips is estimated and the economic values of individual equipment and process are compared. Cost-benefit analysis is applied on investments showing more rewarding economic values. Finally, the main findings and contributions of the paper are summarized in the conclusion section.
2. Review of Existing Standards and Previous Work
As defined in several standards [1] [2] , a voltage dip is the sudden reduction in the RMS voltage below a specified threshold followed by its quick recovery. It is mainly caused by short-circuit faults but switching-on of large loads can cause longer- and shallow dips [3] . Severity of the disturbance is commonly expressed in terms of magnitude of the residual voltage, which depends on the network impedance and type of fault, and duration that is related to the fault clearing time of the protection devices [3] [4] . However, additional parameters including the type of voltage dip, location and type of measurement, and more importantly the robustness of process equipment can influence the effect of voltage dips on different types of loads.
The proper operation of modern industries relies on electronic controls and equipment which are often susceptible to voltage dips [5] [6] [7] [8] [9] . The response of industrial processes to incoming voltage dips is directly influenced by the voltage dip ride-through capability of equipment that make up the process. PQ standards like SEMI F47 and ITIC are developed for defining immunities of industrial device against voltage dips at the customer installations [10] [11] . The IEC 61000-4-11/34 standards [12] [13] specify different immunity classes of devices against voltage dips based on testing and measurements. However, different types of equipment exhibit different sensitivities to voltage dips [5] [6] [7] [8] [9] . Besides, different brands of the same equipment type, and even different models of the same equipment brand often have different sensitivity curves. From this perspective, industries can obtain the realistic behavior of their process equipment from laboratory tests. In [14] [15] [16] [17] probabilistic approaches are considered to address the effects of compositions of equipment types and their interconnections on customer process sensitivity.
The disruption of an industrial process caused by voltage dips can result in very substantial costs [18] [19] [20] related to loss of production, damaged equipment, restarting the process, etc. Although there exist solutions to mitigate voltage dips, it is important that facilities evaluate the economic impact of voltage dips before making new investments for reducing the problems. Over the years, numerous attempts have been made to address the economic consequence voltage dips. Some methods concentrating at network level are proposed in [18] [19] while others applied on plant-level losses are suggested in [21] [22] [23] . The accuracy of the overall assessment of the economic loss relies on the precise information about the cost a single process failure, accurate data of voltage profile at the point of connection (POC) of an industrial plant, and equipment sensitivity to voltage dips. Detailed approaches that consider direct and indirect costs are proposed in [22] [24] . However, this method highly depends on the cost figures of every sub-processes in the plant related to all direct and indirect costs which are difficult to obtain; require time-consuming investigation; and often involve confidentiality issues. Another estimation approaches [16] [20] [25] [26] [27] [28] [29] consider weighting factors to account for different magnitudes of voltage dips to estimate the economic loss voltage dips relative to the cost of a complete interruption. Nevertheless, the method provides no additional information about the effect of dip-duration and dip-type. With a list of direct and indirect costs in a disruption evaluation form, the IEEE 1346-1998 [9] provides guidelines for calculating the costs of voltage dips at customer facility. The standard stipulates the participation of frontline workers, suppliers, finance, accounting, sales and marketing staff to determine the cost related to process stoppage. The sensitivity of the entire industrial process is determined by the most sensitive equipment in the process. In fact, tripping the most sensitive equipment may not disrupt the entire process. Besides, the standard does not consider the interconnections between equipment and sub-processes, and it is not flexible enough to compare morealternative solutions.
With all efforts made so far, the direct evaluation of the economic losses caused by voltage dips is still almost untouched and is a challenging issue. This paper discusses an approach that allows assessing the economic contribution of individual equipment and processes in the manufacturing line. This helps customers to consider more alternative solutions at different levels.
3. Methodology
Figure 1 shows the flow diagram for estimating the economic loss of voltage dips based on sensitivity analysis. The annual economic loss of an industrial plant due to voltage dips depends on the composition, behavior and interaction process equipment against voltage dips, annual frequency and severity of voltage dips at the POC of the plant, and cost of load interruption.
3.1. Sensitivity Analysis
In industrial plants, AC contactors, adjustable speed drives (ASDs), programmable logic controllers (PLCs) and personal computers (PCs) are the most common voltage

Figure 1. Flow chart for estimating economic impact of voltage dips.
sensitive devices. With this approach, the process of cost estimation depends on the composition, interconnection, robustness and significance of process equipment.
3.1.1. Process Layout
To illustrate the procedures of cost estimation, a manufacturing facility that comprises four independent processes connected to the LV-network is considered as depicted in Figure 2. The complete production of the manufacturing facility will depend on the performance of the four processes during voltage dips. The performance of each process is determined by the ride-through capability of the equipment that make up the process. In this case, process P1 depends on the immunity of AC contactor (D1) connected in series with ASD (D2), while process P2 depends on the sensitivity of two PCs (D3 and D4) supplied from two different phase-voltages and connected in parallel to perform the same task. PLC (D5) and SEMI F47 device (D6) are considered as devices vulnerable to voltage dips in process P3 and P4. It is presumed that
・ Process P1 trips if the contactor (D1) and/or ASD (D2) fails,
・ Process P2 trips if both PCs (D3 and D4) fail,
・ Process P3 trips if the PLC (D5) fails, and
・ Process P4 trips if the SEMI F47 device (D6) fails.
3.1.2. Voltage-Tolerance Curves of Equipment
By generating different magnitude and duration of voltage dips from a programmable source, the voltage-tolerance curves of six conductors, an ASD and three PLCs are obtained from experimental tests conducted at the TU/e PQ lab [30] . Table 1 gives a summary of experiment parameters.
3.1.3. Failure Modes of Load Process
For a facility that comprises “n” independent processes, the maximum possible number of failure modes (Nfm) can be found using Equation (1),
 (1)
(1)
where “r” is the number of processes failing at a the same time during a voltage dip. The actual number of failure modes (m), however, depends on the ride-through capabilities of process equipment and their interaction against various types of voltage dips in the facility.
3.1.4. Sensitivity Values of Failure Modes
Suppose L1, L2, …, Ln are the load compositions of the respective processes such that a particular dip causes a partial disruption of the total load that can be expressed as percentage of loss relative to a total shutdown of the load process. The sensitivity index (Is) of the “m” failure modes can be calculated using Equation (2),
 (2)
(2)
where Fppf is matrix of process participation factor of the failure modes and Lcp is the percentage of load composition matrix of processes, articulated by Equation (3). The
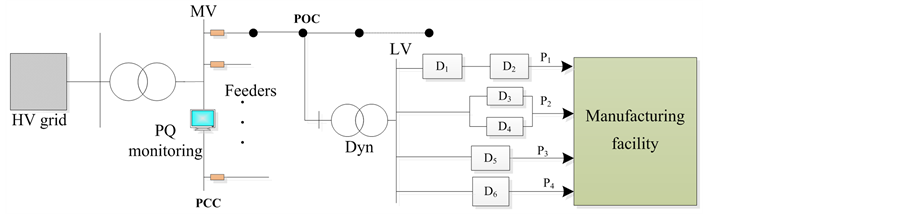
Figure 2. Layout of a manufacturing facility for illustration.

Table 1. Experiment parameters.
Fppf is represented by “1” or “0” to indicate the participation processes to the respective
failure modes.
 (3)
(3)
By replacing each failure mode with its corresponding value of sensitivity index (Is), tables of sensitivity density ( ) are obtained for each type of dip “k” (one-phase dips, two-phase dips and three-phase dips) having “u” magnitude of residual voltage and “Δt” duration.
3.2. Voltage Dip Analysis
In this work, waveforms of voltage dip events are used from the monitor installed at the PCC of the MV-network. Using the guidelines in IEC 61000-4-30 [13] , half-cycle sliding window is used to obtain the RMS voltage characteristics as a function of time, and then the parameters that define the severity of voltage dips are determined. End-users are essentially affected by the phase-phase voltage dips in the MV-network while phase-ground voltages are monitored at the PCC of the MV-network. Not all voltage dips monitored at the PCC of the MV-network are seen at the customer terminals connected to the LV-network and the transfer of voltage dips is considered during the analysis.
The frequency of voltage dips varies from location to location and time to time. To consider the most sounding investment on mitigation techniques, the variations in frequency and severity of voltage dips over several years should be taken into account when evaluating the average annual economic loss. From this perspective, average annual voltage dip density ( ) will be considered for each type of dip.
3.3. Economic Impact of Voltage Dips
By combining the voltage dip density with the respective sensitivity density, the total annual impact of voltage dips (f0) relative to a complete shutdown of the total load can be estimated using Equation (4),
 (4)
(4)
where dk and sk are the annual voltage dip density and sensitivity density functions of each type of dip.
3.3.1. Cost of Voltage Dips
For an industrial plant of size “Scl” critical loads in kVA and experiencing f0 average outages per year due to voltage dips, the total annual load outage cost (ALOC) can be calculated by Equation (5),
 (5)
(5)
where Cint is the cost of interruption per unit load (?kVA). The economic loss due to voltage dips can be reduced by improving the power supply performance and/or improving the equipment ride-through capabilities. In practice, not every mitigating solution is effective to solve all voltage dip problems and the investments on the mitigation solution can vary with the type, size and effectiveness of the solution.
3.3.2. Economic Significance of Equipment and Processes
Before making any investment for reducing the voltage dip problems, it is very important to know the expected contribution of equipment and processes to the economic loss. This will help to rank the economic values of equipment and processes, and paves the way to compare more alternative solutions. Evaluating the economic importance of equipment and processes involves the following steps.
1. Consider that a particular equipment is completely immune to voltage dips,
2. Formulate the failure modes and their sensitivity values,
3. Evaluate the economic loss due to other equipment and processes,
4. Compute the reduction in economic loss after the equipment under consideration is made fully immune.
For each equipment, process or group of processes, the above steps can be repeated to determine the respective economic values. In each case, the reduction in equivalent interruption (fr), calculated by Equation (6), indicates the maximum contribution of the equipment, process or group of processes to the economic loss of the facility under consideration,
 (6)
(6)
where fam is the annual interruption after a mitigation.
3.3.3. Cost-Benefit Analysis
Investments on PQ solutions could be too expensive or cost competitive as compared with the expected reduction in the outages caused by voltage dips. In this paper, the net present value (NPV) method is used to perform the cost-benefit analysis, and this is given by Equation (7),
 (7)
(7)
where fr is annual frequency of reduction in the load outages; Cint is cost of load interruption (?kVA); Scl is size of the critical load (kVA); C0 is cost of initial investment on the PQ solution (?; OMCt is the annual operating and maintenance cost (?yr) in the t-year time; n is period of investment (yr), and r is the discount rate. With PQ investment, the main target is cost reduction and this can be achieved by maximizing the avoided economic damages that depends on the future benefits and expenditures. This can be expressed by Equation (8)
 (8)
(8)
in which the economic benefits and OMC of the solution are both zero at the time of investment (t = 0), and the net return at the time of investment is −C0.
4. Results and Discussions
In this section, a case study of industrial facility described in section 3.1 is considered to analyze the proposed methodology for estimating the economic impact of voltage dips. Experiment results of sensitive equipment and their interaction for obtaining sensitivity density of various types of voltage dips are discussed.
4.1. Immunity Tests
The voltage-tolerance curves of six AC contactors against voltage dips with 0˚ and 90˚ point-on-wave dip initiations are shown in Figure 3. Voltage dips below the respective curves cause three-phase power supply interruptions of the load. With a PQ analyser connected to the load terminals, the automatic reengagement of contactors is affirmed by the U-0-U transition in the RMS voltage.
As can be seen from Figure 3, different types of contactors show variation in the sensitivity thresholds of magnitude and duration. For voltage dips with 0˚ point-on-wave initiation, the voltage-tolerance curves of the tested contactors varied between 50% - 73% of the nominal voltage and the duration threshold varied within 25 - 50 ms. For voltage dips with 90˚ point-on-wave initiations, the magnitude thresholds varied in the range of 38% - 70% of the nominal voltage while the duration threshold varied between 10 - 20 ms. Each contactor trips faster to deeper dips with 90˚ than 0˚ and no significant change is observed on the voltage-tolerance curves of the contactors by changing the loading conditions.
Figure 4 shows the tolerance curves of the ASD drive tested for various types of voltage dips and under different load conditions. In the experiment, the “fail” state is ascertained by the stoppage of the load and the need of manual starting (resetting) to

Figure 3. Voltage-tolerance curves of AC contactors against voltage dips with (a) 0˚ point-on-wave dip initiations; (b) 90˚ point-on-wave dip initiations.

Figure 4. Voltage-tolerance curves of an ASD against different types of voltage dips at (a) no-load, (b) 50% of rated load, (c) 75% of rated load, and (d) 100% of rated load.
bring the system to operation. According to the experiment, the sensitivity of the ASD is not only affected by the magnitude and duration of voltage dips but also by the type of voltage dips and the loading condition the ASD.
As can be seen from Figure 4, the ASD is observed to be immune to one-phase dips when the machine is loaded to below 70% of rated load. At fixed and low loading conditions, the effect of the voltage dip magnitude is more pronounced with each type of dip. The vulnerability of the ASD to voltage dips increases when more number of phases supplying the machine are affected by the dip. For each type of dip, an increase in the load increases the sensitivity of the device. At full-load, the ASD tripped for almost all two-phase and three-phase dips lasting more than a cycle, and for one-phase dips with residual voltage of ~80% and longer than a cycle.
For three PLCs from different manufacturers, the voltage-tolerance curves of the power supply modules along with the SEM F47 and ITIC power acceptability curves are shown in Figure 5. Voltage dips below the curves cause the internal DC voltages of the PLCs to fall below the lower limit and the relays or contacts to disengage the load. The disconnection-reconnection states are ascertained by the PQ analyzer connected to the load terminal with a U-0-U transition in the RMS voltage. The voltage dip magnitude for the tested PLCs varied between 18% - 35% and the duration threshold varied between 20 - 380 ms. It can be seen from Figure 5 that all tested PLCs satisfy the ITIC and SEMI F47 power acceptability curve. However, it should be recalled that different types of PLCs with wide range of ride-through capabilities are available for various methods of process controls.
4.2. Failure Modes and Economic Sensitivity Values
Depending on the voltage-tolerance curves of equipment, different processes exhibit

Figure 5. Voltage-tolerance curves of PLCs (PLC1 = Schneider, PLC2 = Siemens, PLC3 = EATON), and generalized device from Semiconductor industry (SEMI F47) and Information Technology (ITIC).
different behavior to voltage dips that trigger to the malfunction of the equipment. For the illustrative facility considered in this paper, process equipment are considered tohave the tolerance curves of,
§ contactor C1 that trips for ur ≤ 54% and Δt > 20 ms (considering characteristics of both 0˚ and 90˚ point-on-wave dip initiations),
§ ASD at 75% rated load which fails for one-phase, two-phase and three-phase dips when ur ≤ 70%, Δt ≥ 1000 ms; ur ≤ 70%, Δt ≥ 30 ms; and ur ≤ 80%, Δt ≥ 30 ms,
§ Programmable logic controller PLC1 that trips the process when ur ≤ 32%, Δt ≥ 30 ms and ur ≤ 35%, Δt ≥ 130 ms,
§ PCs and SEMI device that comply with the ITIC and SEMI F47 curves.
Figure 6 shows the tolerance curves of the sensitive devices of the plant plotted together against three types of voltage dips and the possible failure modes of the load process are indicated. Examining the behavior and interaction of process equipment subjected to different types of voltage dips (Figure 6), the facility that consists of four processes actually resulted in nine failure modes (F1 - F9). The vulnerability area of each failure mode varies with different types of dips. Considering 30%, 20%, 10% and 40% as load compositions of the respective processes, Table 2 gives a summary of processes and dip types affecting each failure mode, and their sensitivity index values.
It can be seen from Table 2 that all processes fail for two-phase and three-phase dips in the first failure mode (F1), and participation of the processes P1, P2, P3 and P4 is indicated by the participation factor 1111. Similarly, the ninth failure mode is affected by single-phase dips and this involves only process P4. The sensitivity index of the failure modes range from 20% for F8 to 100% when all processes are affected in F1. It can be concluded that the sensitivity index value of any failure mode is affected by the number of processes and the load composition of each process. By assigning values of sensitivity index of failure modes, tables of sensitivity density are obtained for the three types of
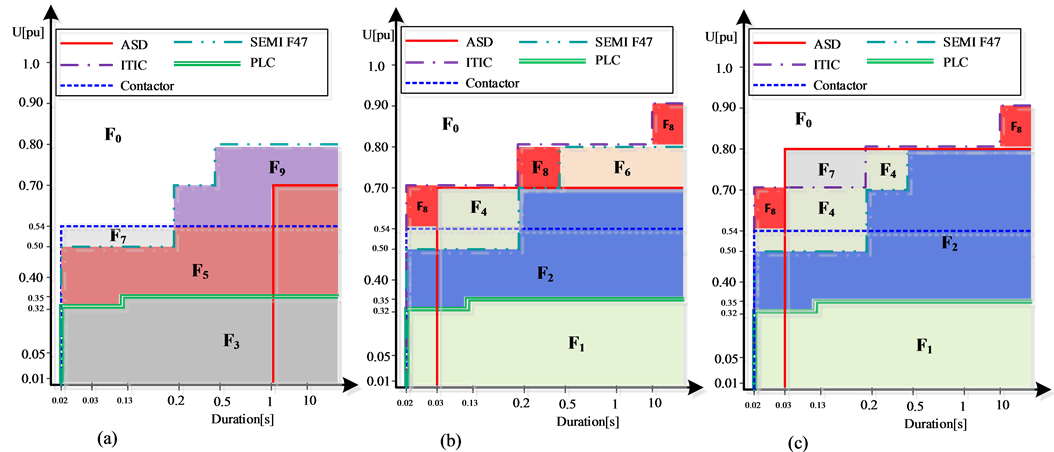
Figure 6. Failure modes of the load process obtained from the voltage-tolerance curves of equipment when subjected to (a) One-phase dips; (b) Two-phase dips; (c) Three-phase dips.
Table 2. Values of process participation factors and sensitivity index for each failure mode.
voltage dips as given in Table 3.
4.3. Voltage Dip Profile and Economic Impact
From the dataset of voltage events monitored at the point of common coupling (PCC) of a MV-network for four years, the dips that can be seen at the customer terminals are obtained [31] . Corresponding to the voltage dips sensitivity density table (given in Table 3), Table 4 shows the average density of three types of voltage dips having different magnitude and duration. On average, the facility experiences 9.25 dips per year. In this case, most of the dips are three-phase dips and a majority of them are deeper and longer dips.
By combing the annual dip density with the sensitivity density values, the annual equivalent interruption of the facility are obtained as shown in Table 5. It can be seen that the facility would experience about 5.83 annual interruptions equivalent to the 9.25 dips per year and this will incur 5.83 times the economic impact relative to that of a total shutdown of the load process.
A closer look at the contribution of failure modes (Table 6) shows that ~97% of the economic impact is due to tripping of processes in F1, F2 and F4 while other failure

Table 3.Sensitivity density for various typs of voltage dips.

Table 4. Average annual voltage dip density at the connection point of the facility.
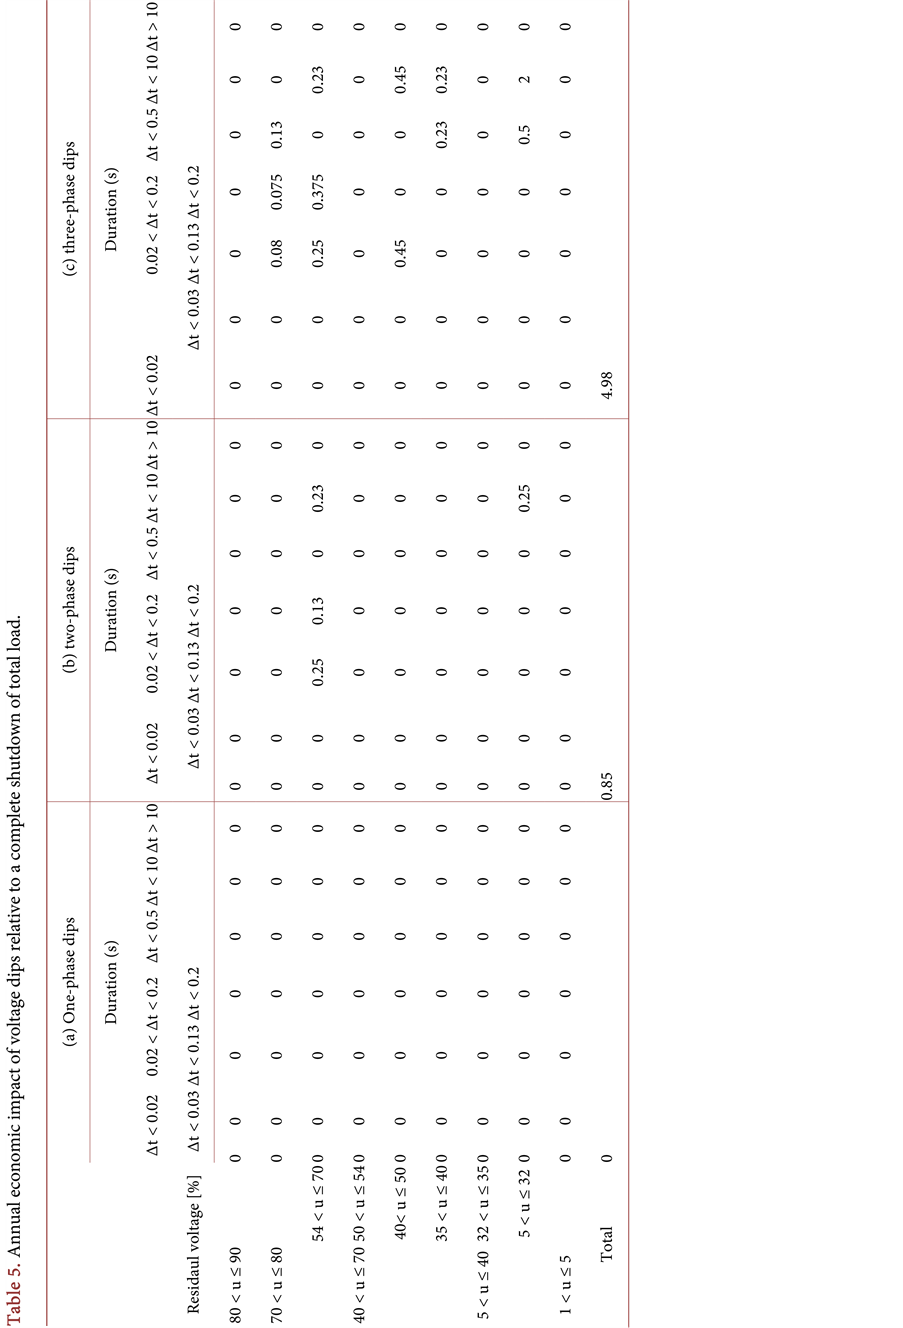
Table 5. Annual economic impact of voltage dips relative to a complete shutdown of total load.
Table 6. Contribution of failure modes to the annual economic impact of voltage dips.
modes contribute little or nothing. It should be recalled, however, that variations in the frequency and/or severity of dips, or load composition of process can alter the level of economic impact and contributions by each failure mode.
4.4. Mitigation and Economic Gains
A maximum economic gain may be attained with a mitigation strategy that is capable of alleviating the most disruptive voltage dips equipment and/or processes could experience. The economic significance of individual equipment, individual processes and combined processes during the most optimistic situation are summarized in Table 7.
At equipment and process level, maximum economic gain of 38.6% can be attained when the ASD is completely immune followed by the SEMI F47 device and PCs. When group of processes are fully protected, the economic gains increase. In practice, not every mitigation technique is able to solve all dip disturbances. Assuming 50% as minimum economic gain from the most optimistic situations (Table 7), seven conditions all involving group of processes can be considered for comparing alternative solutions. As depicted in Figure 7, combination of two processes, three processes and all processes protected by solutions at “A”, “B” and “C” are considered for further cost-benefit analysis.
In this work, active voltage conditioner (AVC), dynamic voltage restorer (DVR), dynamic sag corrector (DySC), Flywheel (FW) and uninterruptable power supply (UPS) are considered to protect group of processes at different positions shown in Figure 7 and they will be examined for cost-benefit analysis. Theeffectiveness of the solutions in reducing the number of voltage dips are
§ AVC can mitigate voltage dips up to 30% and 50% of nominal for one-phase and three-phase dips for at least 30 s.
§ DVR can mitigate voltage dips up to 50% of nominal for significant time.
§ DySC can solve voltage dips and interruptions for Δt ≤ 5 s.
§ FW can protect voltage dips and interruptions for a significant period.
§ UPS can mitigate voltage dips and interruptions for considerable durations.
Taking the effectiveness of each solution into account, the reduction in the annual economic losses are evaluated and presented in Table 8. It can be noticed that AVC and DVR would reduce the annual shutdown of the manufacturing facility by less than 30%. This is because most of the dips are deeper which could not be mitigated by these devices. On the other hand, DySC, UPS and FW can effectively reduce the number of
Table 7. Economic significance of equipment and processes during most optimistic solutions.

Figure 7. Positions of solutions considered for cost-benefit analysis protecting (a) two processes (A1 = P1P2, A2 = P1P4, or A3 = P2P4) at “A”, (b) three processes (B1 = P1P2P3, B2 = P1P2P4, or B3 = P2P3P4) at “B”, (c) all processes (P1P2P3P4) at “C”.
Table 8. Economic gains (annual reduction in process outage) with solutions considered at different positions.
voltage dips by ~57% - 100% depending on the position of solutions application.
4.5. Cost-Benefit Analysis
To compare the cost of voltage dips with cost of solutions, 1 MW critical load of Electronics and Semiconductor manufacturing industries having the same layout as the in the illustration and experiencing the dip density presented in Table 4 are considered here. Average cost of interruption 3 ?kVA and 40 ?kVA are used from surveys for electronics and semiconductor industry [4] [32] . The initial costs and running costs associated with the alternative solutions are summarized in Table 9 [4] [33] .
Considering a 10-year investment on the solutions, Figure 8 shows a comparison of
Table 9. Costs of different alternative solutions at machine or group of machines level.


Figure 8. Comparison of annualized cost (in Thousands) with no mitigation (NM) and with various mitigations at different positions for (a) Electronics industry; (b) Semiconductor manufacturing industry.
annualized costs of voltage dips in Electronics and Semiconductor industries before and after mitigation. It can be seen that the effectiveness of different solutions applied at different positions in reducing the annual interruptions and hence the economic gains vary. Only the DySC in the Electronics plant and most of the solutions in the Semiconductor manufacturing industry show lower costs after mitigation than before mitigation, and they can be considered as acceptable solutions over the lifetime of the investments for this case study. However, the profitability of these acceptable solution considered at several positions can vary significantly.
To choose the most profitable position of an acceptable solution, Figure 9 shows the NPVs of investments on the DySC projected over the lifetime of the projects. It can be seen that DySC is the most preferable solution at A1 and the least acceptable at B3 in the Electronics industry. In the Semiconductor plant, maximum economic gains would be expected when the DySC is used at C, and the solution is comparatively the least acceptable at A3.
When mutually exclusive investments yield positive NPV values, the project with the largest positive value is most preferred. Industrial companies also usually consider PQ investments with higher return rate, and decision can also be made based on the payback times (PBT). In Figure 10, comparisons of PBTs for the acceptable solutions in the Electronics and Semiconductor industries show that the investments on FW and UPS have longer PBT than DySC solutions at all positions. This is because they involve large running (operation and maintenance) costs despite their capability to completely mitigate voltage dips. In the Semiconductor industry, DySC solutions at all positions show at most two years of PBTs and the solution at A1 is the most preferable despite the case with the NPV method at C. In the Electronics plant, the PBTs of DySC at all positions are longer than six years and the solution at A1 is the most desirable as the case with the NPV method.
5. Conclusion
This paper describes an approach for estimating the economic cost of voltage dips incurred by industrial facilities based on sensitivity analysis. For a case of manufacturing facility with four processes, the approach considers the behavior and interaction of process equipment to derive the number of failure modes. For each failure mode, sensitivity index is determined from the participation of processes within each failure mode and the load composition of processes to the total load. This is useful for obtaining the sensitivity density of different types of voltage dips. A case study is used to apply the approach and average annual economic losses incurred by two industries are compared by taking into account the variation in frequency and severity of voltage dips over several years. By evaluating the economic significance of individual equipment and pro- cesses, the method helps to rank their economic contribution. This paves the way to carry out cost-benefit analysis of mitigation solutions with more rewarding economic values that would be possible at different levels. In the analysis, it is confirmed that the economic loss due to voltage dips depends on the frequency and severity of voltage dips, the behavior and interaction of process equipment to voltage dips, type of facility and load composition of processes. The approach also gives more opportunities for customers to consider more alternative solutions, and chose the most optimal solution


Figure 9. Present values (PV) of investments on DySC at different positions in the (a) Electronics industry; (b) Semiconductor manufacturing industry.
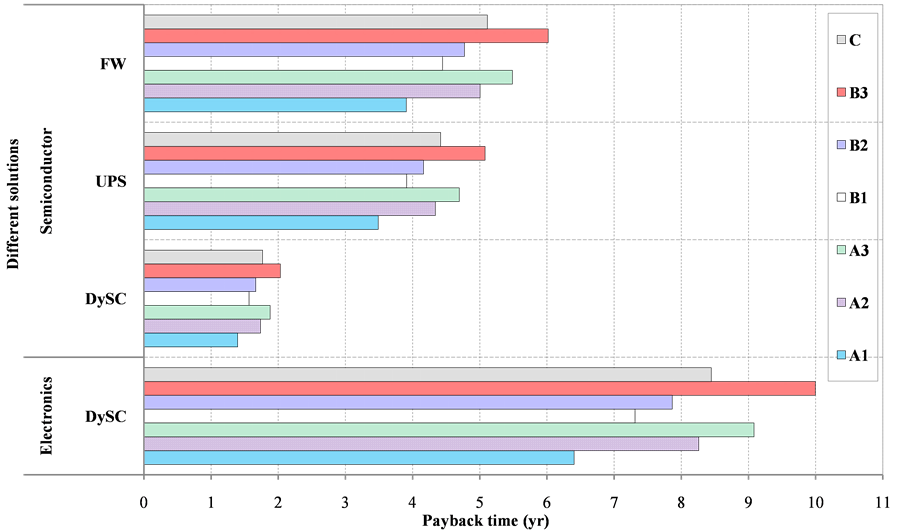
Figure 10. Payback time (PBT) of investments on mitigation solutions at different positions.
for their facility.
Cite this paper
Weldemariam, L.E., Cuk, V. and Cobben, J.F.G. (2016) Cost Estimation of Voltage Dips in Small Industries Based on Equipment Sensitivity Analysis. Smart Grid and Renewable Energy, 7, 271- 292. http://dx.doi.org/10.4236/sgre.2016.711021
References
- 1. EN 50160 Std (2010) Voltage Characteristics of Electricity Supplied by Public Electricity Networks.
- 2. IEC 61000-2-8 (2002) Voltage Dips and Short Interruptions on Public Electric Power Supply Systems with Statistical Measurement Results.
- 3. Bollen, M.H.J. (2000) Understanding Power Quality Problems: Voltage Sags and Interruptions. IEEE Press, New York.
- 4. Cobben, J.F.G. (2007) Power Quality Implications at the Point of Connections. PhD Thesis, TU Eindhoven, Eindhoven.
- 5. Djokic, S.Z., Milanovic, J.V. and Kirschen, D.S. (2004) Sensitivity of AC Coil Contactors to Voltage Sags, Short Interruptions, and Under-Voltage Transients. IEEE Transaction on Power Delivery, 19, 1299-1307.
http://dx.doi.org/10.1109/TPWRD.2004.824396 - 6. Bollen, M.H.J. and Zhang, L.D. (2000) Analysis of Voltage Tolerance of AC Adjustable-Speed Drives for Three-Phase Balanced and Unbalanced Sags. IEEE Transaction on Power Delivery, 36, 904-910.
http://dx.doi.org/10.1109/28.845069 - 7. Djokic, S.Z., Stockman, K., Milanovic, J.V., Desmet, J.J.M. and Belmans, R. (2005) Sensitivity of AC Adjustable Speed Drives to Voltage Sags and Short Interruptions. IEEE Transaction on Power Delivery, 20, 494-505.
http://dx.doi.org/10.1109/TPWRD.2004.832353 - 8. Djokic, S.Z., Desmet, J., Vanalme, G., Milanovic, J.V. and Stockman, K. (2005) Sensitivity of Personal Computers to Voltage Sags and Short Interruptions. IEEE Transaction on Power Delivery, 20, 375-383.
http://dx.doi.org/10.1109/TPWRD.2004.837828 - 9. IEEE Std 1346 (1998) IEEE Recommended Practice for Evaluating Electric Power System Compatibility With Electronic Process Equipment.
- 10. SEMI F47-0606 (2006) Specification for Semiconductor Processing Equipment Voltage Sag Immunity.
- 11. ITI (CBEMA) Curve and Application Note.
http://www.itic.org - 12. IEC 61000-4-11 (2004) Testing and Measurement Techniques-Voltage Dips, Short Interruptions and Voltage Variations Immunity Tests.
- 13. IEC 61000-4-30 (2008) Testing and Measurement Techniques-Power Quality Measurement Methods.
- 14. Milanovic, J.V. and Gupta, C.P. (2006) Probabilistic Assessment of Financial Losses due to Interruptions and Voltage Sags, Part I: The Methodology. IEEE Transaction on Power Delivery, 21, 918-924.
http://dx.doi.org/10.1109/TPWRD.2006.870988 - 15. Milanovic, J.V. and Gupta, C.P. (2006) Probabilistic Assessment of Financial Losses due to Interruptions and Voltage Sags, Part II: Practical Implementation. IEEE Transaction on Power Delivery, 21, 925-932.
http://dx.doi.org/10.1109/TPWRD.2006.870987 - 16. Pohjanheimo, P. and Lehtonen, M. (2004) Introducing Prob-a-Sag—A Probabilistic Method for Voltage Sag Management. International Conference on Harmonics and Quality of Power, Lake Placid, 12-15 September 2004, 250-254.
http://dx.doi.org/10.1109/ichqp.2004.1409362 - 17. Chan, J.Y., Milanovic, J.V. and Delahunty, A. (2009) Generic Failure-Risk Assessment of Industrial Processes due to Voltage Sags. IEEE Transaction on Power Delivery, 24, 2405-2414.
http://dx.doi.org/10.1109/TPWRD.2009.2014493 - 18. Heine, P., Pohjanheimo, P., Lehtonen, M. and Lakervi, E. (2002) A Method for Estimating the Frequency and Cost of Voltage Sags. IEEE Transaction on Power Systems, 17, 290-296.
http://dx.doi.org/10.1109/TPWRS.2002.1007895 - 19. Heine, P., Pohjanheimo, P., Lehtonen, M. and Lakervi, E. (2001) Estimating the Annual Frequency and Cost of Voltage Dips for Customers of Five Finnish Distribution Companies. Proceeding of CIRED International Conference and Exhibition, Amsterdam, 18-21 June.
- 20. McGranaghan, M. and Roettger, B. (2002) Economic Evaluation of Power Quality. IEEE Power Engineering Review, 22, 8-12.
http://dx.doi.org/10.1109/MPER.2002.981339 - 21. Quaia, S. and Tosato, F. (2003) Interruption Costs Caused by Supply Voltage Dips and Outages in Small Industrial Plants: A Case Study and Survey Results. Proc. IEEE Region 8 EUROCON, Ljubljana, 22-24 September 2003, 258-262.
http://dx.doi.org/10.1109/eurcon.2003.1248195 - 22. Quaia, S. and Tosato, F. (2003) A Method for the Computation of the Interruption Costs Caused by Supply Voltage Dips and Outages in Small Industrial Plants. Proc. IEEE Region 8 EUROCON, Ljubljana, 22-24 September 2003, 249-253.
http://dx.doi.org/10.1109/eurcon.2003.1248193 - 23. Lamedica, R., Patrizio, A., Prudenzi, A., Tironi, E. and Zuninelli, D. (2000) Power Quality Costs and Upgrading Solutions: The Energy Centre. International Conference on Harmonics and Quality of Power, Orlando, 1-4 October 2000, 691-696.
http://dx.doi.org/10.1109/ichqp.2000.897762 - 24. Gupta, C.P., Milanovic, J.V. and Aung, M.T. (2004) The Influence of Process Equipment Composition on Financial Losses due to Voltage Sags. International Conference on Harmonics and Quality of Power (ICHQP), Lake Placid, 12-15 September 2004, 28-34.
http://dx.doi.org/10.1109/ichqp.2004.1409324 - 25. Wang, J., Chen, S. and Lie, T.T. (2004) Estimating Economic Impact of Voltage Sags. International Conference on Power System Technology, Singapore, 21-24 November 2004, 350-355.
http://dx.doi.org/10.1109/icpst.2004.1460019 - 26. Shih-An, Y., Chun-Lien, S. and Rung-Fang, C. (2006) Assessment of Power Quality Cost for High-Tech Industry. IEEE Power India Conference, New Delhi, 10-12 April 2006.
http://dx.doi.org/10.1109/poweri.2006.1632616 - 27. McGranaghan, M.F. and Roettger, W.C. (2003) The Economics of Custom Power. Proc. Transmission and Distribution Conference and Exposition, 3, 944-948.
http://dx.doi.org/10.1109/tdc.2003.1335065 - 28. Dugan, R.C., McGranaghan, M.F., Santoso, S. and Beaty, H.W. (1996) Electrical Power System Quality. 2nd Edition, McGraw-Hill, New York, 72-79.
- 29. El-Gammal, M.A. and Abou-Ghazala, A.Y. (2010) Custom Power Devices for Voltage Sags Mitigation: A Techno-Economic Analysis. Journal of Electrical Engineering and Technology, 3, 71-76.
- 30. Weldemariam, L.E., Gärtner, H.J., Cuk, V., Cobben, J.F.G. and Kling, W.L. (2015) Experimental Investigation on the Sensitivity of an Industrial Process to Voltage Dips. Proceeding of IEEE PowerTech, Eindhoven, 29 June-2 July 2015, 1-6.
- 31. Weldemariam, L.E., Papathanasiou, F., Cuk, V., Cobben, J.F.G. and Kling, W.L. (2015) Assessment of Voltage Dips Based on Field Measurements in MV Networks. International Conference on Renewable Energies and Power Quality, La Coruña, 25-27 March 2015.
- 32. KEMA (2006) Power Quality op het aansluitpunt, fase 1: Inventarisatieenprobleemomschrijving (Dutch). Laborelec.
- 33. Thasananutariya, T., Chatratana, S. and McGranaghan, M. (2005) Economic Evaluation of Solution Alternatives for Voltage Sags and Momentary Interruptions. Magzine on Electrical PQ and Utilization, 1, 17-26.