Smart Grid and Renewable Energy
Vol.06 No.08(2015), Article ID:58544,11 pages
10.4236/sgre.2015.68019
Evaluation of Renewable Energy Vulnerability to Climate Change in Brazil: A Case Study of Biofuels and Solar Energy
Antonio Oscar Jr., Wanderson Luiz Silva, Vera Ruffato, Renata Barreto, Marcos Freitas
Federal University of Rio de Janeiro, Rio de Janeiro, Brazil
Email: thony.oscar@gmail.com
Copyright © 2015 by authors and Scientific Research Publishing Inc.
This work is licensed under the Creative Commons Attribution International License (CC BY).
http://creativecommons.org/licenses/by/4.0/


Received 19 June 2015; accepted 1 August 2015; published 4 August 2015
ABSTRACT
This study aims to calculate indicators and indexes to subsidize the analysis of vulnerability and adaptation of the renewable energy sector to climate change in Brazil, focusing on biofuels and solar energy. For biofuels, in general, the Brazilian coast will be a propitious area for agricultural productivity during the XXI century, but these are areas historically intended for occupation and development of the urbanization process, that is, with limited land availability and supply for primary production. In some parts of the Northeast, Midwest and South of the country, offer for the cultivation land will be reduced. For the solar energy is observed that Brazil has area and highly expressive power for the use of this power, both today and in the coming decades, especially in the North, Northeast and Midwest. In statistical terms, the Mann-Kendal test and Sen’s Bend point to a very weak tendency to useful radiation indicator in all regions of Brazil by 2100. In addition, it is projected a significant increase in mean air temperature by the end of XXI century across the country that can mean a reduction in power conversion capability, which is sensitive to ambient temperature variations, especially in the Midwest and North of the country.
Keywords:
Renewable Energy, Climate Change, Brazil, Biofuels, Solar Energy

1. Introduction
Climate change increasingly occupies an important position within the various sectors of society, both nationally and internationally. Several studies, including the fifth assessment report of the Intergovernmental Panel on Climate Change [1] , indicate that the growing trend of greenhouse gases is the main agent of such changes. Thus, there is an imminent concern about the mitigation of these future climate changes, making it necessary to establish measures to adapt to possible impacts.
As the power generation and consumption are key to socio-economic development, it is essential to understand how the energy production infrastructure responds to the clash of climate change. From this knowledge is possible to measure the vulnerability of a nation and promote development of alternative means of it, offering appropriate prospects for the future. In Brazil, due to its characteristic of primary producer associated with continental proportions of its territory and climatic aspects, its energy matrix were guided primarily in renewable energy.
Energy sources exploited in Brazil include hydropower, thermal power, solar power, biofuels and wind energy. According to the National Electric Energy Agency [2] , the country has 3336 projects of electricity generation in operation, representing an output of approximately 118 Gigawatts. Thus, significant climate changes may represent substantial impacts for development and for the country economy in this sector. Specifically this research, the main focus will be on solar energy and biofuels, as these sources have significant enhancement conditions and vulnerability to present and future climate scenarios.
The energy originated from biofuels is from renewable sources which in Brazil are essentially represented by biodiesel and ethanol. For proper use of land with purposes of exploitation of agricultural potential for the generation of biofuels, in addition to economic and social factors, it must take into account basic environmental factors, considering the physicochemical requirements of each culture, as well as the ecology of the region. Among the physical and ecological conditions, the climate plays an important role, especially with regard to water availability, which depends directly on rainfall supply and intensity of evapotranspiration process, elements that act as limiter to vegetation.
For its intertropical location, Brazil has a high incidence of solar radiation throughout the year, making this a potential source for the exploration of energy in order to supply the increasing demand of energy in the country. Most of Brazil is located relatively close to the equator, so that there are not wide variations in daily sunlight. However, most of the population and socio-economic activities of the country are concentrated in more distant regions of equator, as in the Southeast and South.
In view of the above perspectives, this work presents a vulnerability analysis and interpretation of the impacts (both positive and negative) of future climate changes in the renewable energy sector of biofuels and solar energy, in order to support researches that aim to adaptations and implementations in the current Brazilian energy matrix.
2. Metodology
2.1. Data from Climate Model
The Numerical Models of the Earth System (NMESs) are the most promising tools to develop projections of future climate change. Through the simulation of important physical and dynamical processes, NMESs can represent the complex nonlinear interactions that influence the climate as well as the interactions between the components of the Earth system (mainly atmosphere, biosphere and hydrosphere) and feedback mechanisms, including changes in the frequency and intensity of extreme events [3] . In addition, NMESs can simulate future climates in response to changes in the concentration of greenhouse gases and aerosols.
For this study, the regional climate was simulated by Eta model of Weather Forecasting and Climate Studies Center/National Institute for Space Research (CPTEC/INPE), which is coming from the original Eta model [4] developed at the University of Belgrade (Serbia) and operationally implemented by the National Center for Environmental Predictions (NCEP) in the United States. The Eta 20 km regional model scenarios were simulated using the global model boundary conditions MIROC (Model for Interdisciplinary Research on Climate), a model developed in cooperation with the climate research center in Japan. From these integrations, the model is called Eta-Miroc5 [5] [6] .
In this study, the average of thirty years is used as reference model for the processing of data and evaluation of future scenarios of the indicators described hereafter. The RCP 8.5 scenario [1] was selected to perform the climate change analyzes. Historical values (1961-1990) and projected future values (2011-2040, 2041-2070 and 2071-2100) were calculated. Then the future-present differences were computed in order to verify the simulations of future trends.
2.2. Biofuels Indicator
Assuming that water availability is fundamental to the farm of genres used for the production of biofuels, including ethanol, it is used the aridity index (D) proposed by [7] :

where  is the Thorntwaite Moisture Index, PRECP is the precipitation and EVTP is
the evapotranspiration.
From this method, it was shown that occurrence of areas of desertification more emphatic process, so those with very low agricultural potential, are in the range 2 < D < 7.
To complement this methodology is also used as reference humidity data in the soil in 0.1 m, which aims to support the assessment of water availability to the root system of plants. Furthermore, air temperature is also analyzed, from which proposes an index based on its variation (projected temperature-historical temperature), allowing estimation of the thermal stress of the plant in climate change scenarios, fundamental factor that directly affects the photosynthetic capacity of the plant.
2.3. Solar Energy Indicator
Assuming that the use of solar energy depends on the incident solar radiation in a given area, an efficient method of analyzing the view of the offer of this source is the radiation balance in a given region, which can be determined by calculating the balance of radiation. This radiation (Rn) is the available energy in the earth-atmos- phere system and is defined as the radiation balance of all radiative fluxes leading to and from a surface [8] . Therefore, to define a useful radiation indicator (Ru) is required equating the variables of shortwave radiation incident to the surface (OCIS), albedo (α), short wave radiation emerging at the top of the atmosphere (ROCE) and short wave radiation emerging to the surface (OCES). Thus:

The albedo (fraction of incident radiation which is reflected) regarded was the planet mean value, so 0.30 or 30%. The maps show the average annual values of the indicator for a particular day of the year in Brazil, so Ruis multiplied by 24 hours, having a send unit W∙h/m2∙day.
The equipment controllers of solar energy can be markedly influenced by variations in ambient temperature. Thus, also it is performed an analysis of projections of future increase or decrease in air temperature along the XXI century in Brazil.
2.4. Statistical Tests
For the evaluation of significance in climatic trends, it is used the Mann-Kendall nonparametric statistical test [9] . This test has been the most appropriate method to analyze the significance of possible climate change in time series [10] .
Sen’s Bendis also calculated in this work. This is a non-parametric method (assuming a linear trend) used to estimate the trends magnitude [11] . As Sen’s Bend is insensitive to outliers and missing data, such testis more rigorous than the usual curvature of regression and provides a more realistic measure of trends in a time series.
3. Results
3.1. Air Temperature
Figure 1 shows the differences in air temperature between the future climate (2011-2040, 2041-2070 and 2071- 2100) and the historical period (1961-1990) projected to Brazil through Eta-Miroc5 model in IPCC RCP 8.5 scenario. The estimates show an increase of about +2.0˚C in Brazil during 2011-2040. During 2041-2070, the projections indicate a similar temperature rise, but more sharply in the center of the country, with values reaching up to +3.0˚C in the Midwest region and vicinity. Analyzing the period 2071-2100, it is noted that the

Figure 1. Air temperature differences between the future climate (2011-2040, 2041-2070 and 2071-2100) and the present climate (1961-1990) projected to Brazil through Eta-Miroc 5 regional climate model in the IPCCRCP 8.5 scenario.
increase in air temperature is emphatic in Brazil. The simulations show an increase between +2.0˚C and +3.0˚C in the South and in the east coast, while in up-country the difference can reach up to +5.5˚C in the Midwest and something around +4.0˚C in the North and in the most part of the Northeast and Southeast regions.
In statistical terms, the analyzes indicate a significant upward trend in the average air temperature at 2 m for the five Brazilian regions by the end of the century, confirming the possibility of warming and frequency and intensity growth of temperature extreme events (Table 1). Based on this analysis, the Midwest and North Regions Brazil present the highest rates of average temperature rise, with +1.51˚C by slice of time and +1.37˚C by slice of time, respectively. The region with the lowest magnitude of increase in the period analyzed is the South, with an increase of approximately +0.87˚C by slice of time.
3.2. Biofuels (Bioethanol)
The aridity index, formulated in the previous session, is an excellent indicator to assess the water availability in a particular climate type, pointing regions susceptible to the occurrence of severe droughts and desertification process. In the Brazilian, case is notoriously the prone to dryness of the Wild Northeast. From the proposed index (Figure 2), the northern state of Bahia is presented as area of desertification process, which evolves in terms of extension from the time slice 1961-1990 to 2071-2100. It also arise desertification outbreaks in the State of Pará.
The coast of Brazil, both in its east coast as northeast remains with high moisture index, as well as the southeast

Table 1. Statistical analysis of air temperature at 2 meters for Brazilian regions. Values in red were considered significant at a confidence level of 90%.

Figure 2. Present climate (1961-1990) and simulated future climate (2011-2040, 2041-2070 and 2071-2100) projected for the aridity index in Brazil through Eta-Miroc5 regional climate model in the IPCCRCP 8.5 scenario.
of the country, which suffers with significant retraction of this area in 2011-2040 period, particularly in the States of São Paulo and Paraná, but from 2041 onwards, it rises again. Certainly the Brazilian coast characteristics associated with a closed topography with high solar radiation and temperature of the surface ensures considerable moisture content and low static stability overlying the air, allowing when the synoptic situation is favorable, the occurrence of convective instability and hence surplus moisture in the environment.
The most significant impact will be felt in the Central West and North of Brazil, where there is significant reduction in available moisture over the time slices, especially in the Amazon and Tocantins, Mato Grosso and Goiás, with increased susceptibility to dryness situations.
In quantitative terms (Figure 3), the projection data of the IPCC RCP 8.5 scenario from Eta-Miroc5 show that in the period 1961-1990, over 74% of Brazil had aridity index below 0.9, so moisture supply code. However, modeling shows a reversal of this scenario by 2100, where approximately 67% will be in the next dryness class, that is, between the indexes 0.9 and 2.0. The areas in desertification, north of Bahia and in specific situations of Pará, will suffer a 0.2% increase in area extension until the end of the twenty-first century.
As for the statistical analysis, the Mann-Kendall test indicates a significant trend in the level of 90% of the aridity index for Brazilian regions, except for the Southeast (Table 2). The magnitude of this change will be greater in the North of Brazil, which several studies have pointed to the savannization trend of lush rainforest, which corroborates the results. Jarring the other regions, the South has an increased trend of humidity, that is, over the slices, the trend observed in this region is greater availability of moisture.
Soil moisture data (Figure 4) also confirm the spatial trend in the aridity index, so point to an expansion of the water deficit area, especially in the States of Bahia, Piauí and Minas Gerais. The data also show an available surface moisture reduction for the Midwest Region of Brazil and project a little significant change to the Brazilian coast and the Southeast. However, the State of Mato Grosso do Suland Amazon region have significant loss of soil surface moisture over the time slices, common characteristics by virtue of the types of soils developed in these areas.
These data are of great importance, since they are indicative of water availability to the root system of the plant, which has a direct impact on nutrient absorption capacity of it. Thus, from the modeling data is possible to estimate a reduction of the area with water availability for vegetation development, leading directly to the productivity of various genres that are distributed between the Northeast and Midwest regions of Brazil.
Statistical analyzes show a high significance for the Northeast region of the country, whose magnitude is −0.01% reduction in moisture between the slices of time on study (Table 3). The Region that clashes of this feature is the South of Brazil, whose tendency is soil moisture increases of +0.01% between the slices of time, strong by connecting with the results presented to the aridity index in the same area.
From the indicators analyzed above, as well as the air temperature (item 3.1), it was possible the development of Figure 5, which is a synthesis map that shows those areas of Brazil with unfitness for cultivation due to
Table 2. Statistical analysis of the aridity index for Brazilian regions. Values in red were considered significant at a confidence level of 90%.
Table 3. Statistical analysis of the soil moisture for Brazilian regions. Values in red were considered significant at a confidence level of 90%.

Figure 3. Evolution of the areasofaridity index for Brazil through Eta-Miroc5 regional climate model in the IPCCRCP 8.5 scenario.
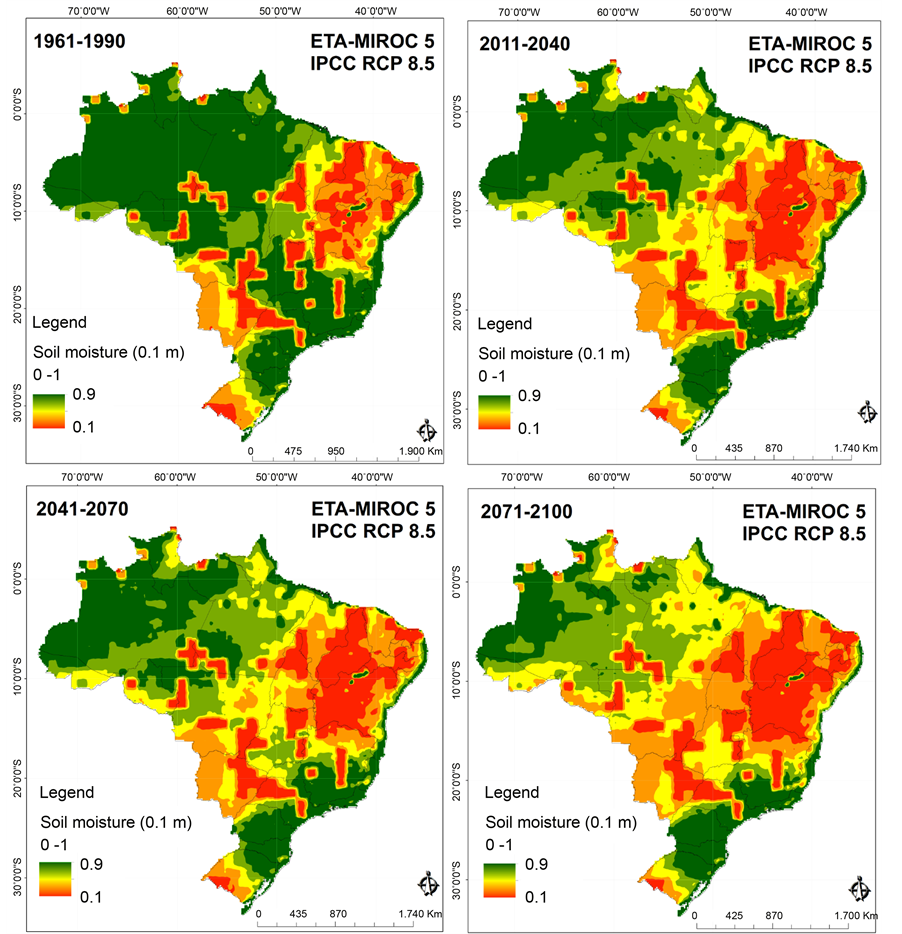
Figure 4. Present climate (1961-1990) and simulated future climate (2011-2040, 2041-2070 and 2071-2100) projected forsoil moisture (0.1 m) in Brazil through Eta-Miroc5 regional climate model in the IPCCRCP 8.5 scenario.

Figure 5. Synthesis map of cultivation fitness class to Brazil for present climate (1961-1990) and simulated future climate (2011-2040, 2041-2070 and 2071-2100) through Eta-Miroc5 regional climate model in the IPCCRCP 8.5 scenario.
projected climate features (areas in red) as well as those areas which have the potential production, but human interventions with the use of more extensive methods of irrigation are required (yellow areas). The map shows also possible situations of ideal suitability for farming, areas where productivity will reach the maximum possible if the other agronomic and environmental conditions prove favorable (green areas). It is noted that by the end of the century, much of the Northeast of Brazil and in the States of Mato Grosso do Sul and Rio Grande do Sul may present climate unsuited to cultivation. However, most of the coast and the North of the country may be able to farming.
Therefore, from the results presented in this section, it is observed that the Southeast region of Brazil, as well as the country’s coastline, is favorable areas for agricultural productivity. However, these regions are historically intended for occupation and development of the urbanization process, that is, with limited land availability and supply for production.
3.3. Solar Energy
Analyzing by generalized way all the maps produced by the Eta-Miroc5 regional climate model (Figure 6),

Figure 6. Present climate (1961-1990) and simulated future climate (2011-2040, 2041-2070 and 2071-2100) projected for the useful radiation indicator in Brazil through Eta-Miroc5 regional climate model in the IPCCRCP 8.5 scenario.
there is the same pattern that remains admittedly: an inverse relationship between the intensity of solar radiation and latitude; so at lower latitudes (areas close to the equator, as the North and Northeast of Brazil) solar radiation is high, while in higher latitudes (towards the south of the country), the intensity of this radiation is reduced. This occurs because of the sunlight on the earth’s surface, that is, perpendicular in the equatorial and tropical zone and more obliquely toward the poles.
When the historical period (1961-1990) of the Eta-Miroc5 model is evaluated, it is noted that the Northern region of Brazil has the highest values of useful radiation indicator, and these are established between about 5700 and 5900 W∙h/m2∙day. Next, there are the Northeast, Midwest and Southeast, with values around 5500 - 5700 W∙h/m2∙day. The southern region has the most marked variation of intensity of this radiation, with values ranging between 5500 W∙h/m2∙day in the north area to 4900 W∙h/m2∙day in southern part.
As mentioned previously, the eminent values of useful radiation indicator in northern Brazil are due to emphatic solar energy that this area receives during the whole year. Thus, despite the yearly averages for the indicator representation, the values of them remain significantly high. In contrast, the southern region exhibits lower values due to the lower amount of solar energy receipted by this area. In addition, the South has the striking feature of quite often the performance of weather systems that enhance cloud cover, especially the cold fronts.
Observing the future projections of useful radiation indicator generated by the Eta-Miroc5 model forced with the IPCC RCP 8.5 scenario, it appears that the simulated values by the end of the twenty-first century are minor compared with the present climate (historical period). On average, such radiation intensity reductions vary between 4% and 8% in Brazil, values considered not significant, since the country still find within a suitable range for the generation of energy from the short-wave radiation (solar radiation).
Between 2011 and 2040, the North and the northern sector of the Midwest Brazil must have an average value of the useful radiation indicator in about 5600 W∙h/m2∙day, so a decrease of around 4% compared with the present climate. The south-center of the Midwest Region, as well as the Northeast and Southeast regions are likely to have values around 5300 W∙h/m2∙day, representing thus a reduction about 6% over the historical period. The South should show greater decay in the intensity of solar energy, about 8%, as the average value in this area would be around 5100 W∙h/m2∙day.
Accompanying the future projections over 2041 to 2070 periods, there is a negligible increase in the values of useful radiation indicator in Brazil. These elevations are around 2% compared to the previous period (2011- 2040), but still remain around 4% lower in relation to the present climate (1961-1990). In the period 2071-2100, the simulated scenario of solar radiation in the country is quite similar to the first discussed future period (2011-2040), with distribution of values of similar manner to that period. There is only one short exception in the States of Minas Gerais and Paraná, which keeps the value of the previous period (2041-2070).
Figure 7 shows the percentage fractions of Brazil area for certain ranges of useful radiation indicator in function of time simulated by the Eta-Miroc5 regional climate model. Taking into consideration a land area of the country at 8.9 million∙km2, currently (1961-1990) and future (2011-2100) the majority (around 61%) has/will have an average annual radiation intensity between 5600 and 6000 W∙h/m2∙day. On a slightly lower power range (5200 - 5600 W∙h/m2∙day) it is noted and projected to remain around 34% of the total area of Brazil. Finally, about 5% of the country’s land have/will have solar radiation between 4800 and 5200 W∙h/m2∙day.
Also according to Figure 6 and Figure 7, it is noted that the range of greater intensity of useful radiation indicator (5600 - 6000 W∙h/m2∙day) is located on the North and parts of the Northeast, Midwest and Southeast of Brazil. On the other hand, the range with lower solar radiation (4800 - 5200 W∙h/m2∙day) is confined in a given stretch of southern Brazil. This reinforces one of the main geographical features and hence climate of Brazil: a country predominantly tropical with strong solar energy available.
In addition, it is projected a significant increase in average air temperature by the end of XXI century across the country, as seen in item 3.1. It means a reduction in energy conversion capacity, sensitive to ambient temperature variations, especially in the North and Midwest of the country. Furthermore, there would be area limitations for the installation of photovoltaic stations due to the large expansion of the urban phenomenon in the national territory, leaving few free areas for these developments.
In statistical terms, the Mann-Kendal test and Sen’s Bend point to a few significant trends to useful radiation indicator in all regions of Brazil (0.73), according to Table 4. Probably, this is due a few factors, including: the

Figure 7. Percentage portions of Brazil area to the useful radiation indicator ranges (W∙h/m2∙day) between 1961 and 2100 simulated by Eta-Miroc5 regional climate model in the IPCCRCP 8.5 scenario.
Table 4. Statistical analysis of the useful radiation indicator for Brazilian regions. Values in red were considered significant at a confidence level of 90%.
use of the 30-year average and the low frequency of variation in solar radiation data. However, from the Sen’s Bend analysis, it is noted the magnitude of the trend, with unanimity in whimsy decrease in the useful radiation availability, especially in the North and Midwest, which associated with a rise in temperature could interfere in the production ability of energy from photovoltaic systems. However, it is noteworthy that these values are not statistically significant at the 90% level.
Wherefore, it can be concluded that Brazil has area and highly expressive power for using solar energy, both today and in the coming decades, especially in the North, Northeast and Midwest regions. Regarding these considerations, it is worth noting that, since the given values are annual averages in 30 years, it is expected that in the summer the incident solar radiation intensity is more significant, with attenuation only in the presence of cloudiness, mainly in the North, a factor not impeding in a tropical country.
4. Conclusions
The objective of this study was to calculate indicators and indexes so that they subsidized the analysis of vulnerability and adaptation of the renewable energy sector to climate change in Brazil, focusing this research specifically in the sources of biofuels and solar energy.
For biofuels, in general, the Brazilian coast is presented as propitious area for agricultural productivity, but these are areas historically intended for occupation and development of the urbanization process, that is, with limited land availability and supply for primary production. In some parts of the Northeast, Midwest and South of the country, offer for the cultivation land will be reduced.
In general, for the solar energy, it was observed that Brazil had area and highly expressive power for the use of this power, both today and in the coming decades, especially in the North, Northeast and Midwest. In statistical terms, the Mann-Kendal test and Sen’s Bend point to a very weak tendency to useful radiation indicator in all regions of Brazil. In addition, it is projected a significant increase in mean air temperature by the end of XXI century across the country that can mean a reduction in power conversion capability, which is sensitive to ambient temperature variations, especially in the Midwest and North of the country.
Finally, it should be noted that this work is based on current technology, thus technology improvement with biotechnology incentives can reverse the results once presented, and these are the recommendations of this study: 1) investment in biotechnology and genetic improvement of plants for better adaptation to climatic contrasts; 2) investment in technology to better use of solar energy for power generation, in addition to the improvement of the materials to be less susceptible to temperature variation and transmission systems, which can reduce energy losses in the distribution process.
Acknowledgements
The authors acknowledge the support of the Brazilian Ministry of Science, Technology and Innovation within the “Preparation of the Third National Communication of Brazil to the Framework Convention of the United Nations about Climate Change” project. The authors also thank Rede CLIMA and Sub-Rede Energias Renováveis for the assistance.
Cite this paper
Antonio OscarJr.,Wanderson LuizSilva,VeraRuffato,RenataBarreto,MarcosFreitas, (2015) Evaluation of Renewable Energy Vulnerability to Climate Change in Brazil: A Case Study of Biofuels and Solar Energy. Smart Grid and Renewable Energy,06,221-232. doi: 10.4236/sgre.2015.68019
References
- 1. Intergovernmental Panel on Climate Change—IPCC: Climate Change (2013) The Physical Science Basis. Contribution of Working Group I to the Fifth Assessment Report of the IPCC. In: Stocker, T.F., Qin, D., Plattner, G.-K., Tignor, M., Allen, S.K., Boschung, J., Nauels, A., Xia, Y., Bex, V. and Midgley, P.M., Eds., Chapter: Summary for Policymakers, Cambridge University Press, Cambridge, United Kingdom and New York, 1535 p.
- 2. National Electric Energy Agency—ANEEL (2008) Atlas de Energia Elétrica do Brasil. Agência Nacional de Energia Elétrica, Brazil.
http://www.aneel.gov.br/arquivos/PDF/atlas3ed.pdf. - 3. Gordon, C., Cooper, C., Senior, C.A., et al. (2000) Simulation of SST, Sea Ice Extents and Ocean Heat Transport in a Version of the Hadley Centre Coupled Model without Flux Adjustments. Climate Dynamics, 16, 147-168.
http://dx.doi.org/10.1007/s003820050010 - 4. Mesinger, F., Chou, S.C., Gomes, J.L., et al. (2012) An Upgraded Version of the Eta Model. Meteorology and Atmospheric Physics, 116, 63-79.
http://dx.doi.org/10.1007/s00703-012-0182-z - 5. Chou, S., Lyra, A., Mourão, C., et al. (2014) Evaluation of the Eta Simulations Nested in Three Global Climate Models. American Journal of Climate Change, 3, 438-454.
http://dx.doi.org/10.4236/ajcc.2014.35039 - 6. Chou, S., Lyra, A., Mourão, C., et al. (2014) Assessment of Climate Change over South America under RCP 4.5 and 8.5 Downscaling Scenarios. American Journal of Climate Change, 3, 512-527.
http://dx.doi.org/10.4236/ajcc.2014.35043 - 7. Hare, F.K. (1983) Climate and Desertification: A Revised Analysis. World Climate Applications Programme. World Meteorological Organization, Geneva, 149 p.
- 8. Klein, S.A. (1977) Calculation of Monthly Average Insolation on Titled Surfaces. Solar Energy, 19, 325-329.
http://dx.doi.org/10.1016/0038-092X(77)90001-9 - 9. Sneyers, R. (1975) Sur L’analyse Statistique des Series Dóbservations. Organisation Méteorologique Mondial, Genève, 192 p.
- 10. Goossens, C. and Berger, A. (1986) Annual and Seasonal Climatic Variations over the Northern Hemisphere and Europe during the Last Century. Annales Geophysicae, 4, 385-400.
- 11. Sen, P.K. (1968) Estimates of the Regression Coefficient based on Kendall’s Tau. Journal of the American Statistical Association, 63, 1379-1389.
http://dx.doi.org/10.1080/01621459.1968.10480934