Smart Grid and Renewable Energy
Vol.06 No.03(2015), Article ID:54951,6 pages
10.4236/sgre.2015.63004
Metrological Analysis of Sunflower Prototype
Hermes Jose Loschi, Yuzo Iano, Rosivaldo Ferrarezi, Neusa Rocha Ferrarezi, Fabrizzio Daibert Conte
Department of Communications, Faculty of Electrical and Computer Engineering, State University of Campinas (UNICAMP), Campinas, Brazil
Email: eng.hermes.loschi@ieee.org
Copyright © 2015 by authors and Scientific Research Publishing Inc.
This work is licensed under the Creative Commons Attribution International License (CC BY).
http://creativecommons.org/licenses/by/4.0/


Received 10 November 2014; accepted 20 March 2015; published 24 March 2015
ABSTRACT
It is well known that the solar tracking systems can increase the efficiency of the photovoltaic (PV) panel by about 30 percent. However, these systems require precise control of their components, mainly of the equipment’s used for the measurement of energy. In this paper, a metrology analysis is conducted, through of the results obtained by Sunflower prototype. The Sunflower is a solar tracking system developed by H. J. Loschi. A tracking system through a microcontrolled timing logic, sending commands to a linear actuator that moves the system. The deductions, based on in research trials, confirms that the Sunflower prototype is more efficient in relation to fixed PV panels, it is possible to observe the difference in the efficiency of 31%, with a variation of ±0.8% (that depends the solar irradiation). The main purpose of this paper is to attest to the quality of the measurements carried out during the performance tests of the Sunflower prototype, eva- luating the uncertainty of measurements collected through the measurements equipment, and, introducing methods to minimize uncertainties of measurement equipment in the PV systems.
Keywords:
Photovoltaic-PV, Tracking, Metrological, Sunflower, Prototype

1. Introduction
In the history of metrology, ideas concerning problems of current importance, as well as methods of their solution, have qualitatively changed more than once. Such changes are caused by new requirements for industry and society at each stage of development. These changes were taken into account in the revision of metrological legislative acts and regulations [1] .
Systematic effects are the most critical issue in measurement, especially in the metrological field, since their effect on the measured values and on the resulting total uncertainty are often dominant. In this respect, and considered the use of PV systems for electric power generation, it is necessary metrological suitability of the equipment used in the tests [2] .
The main purpose of this paper is to attest to the quality of the measurements carried out during the performance tests of the Sunflower prototype, evaluating the uncertainty of measurements collected through the measurements equipment, such as DDM (digital multi meter) [3] [4] .
The assessment begins with a brief introduction to the concept of basic greatness and influence. The third chapter introduces the boundary conditions during the period of measurements, detailed description of the measurements performed with the Sunflower prototype. The fourth chapter introduces all the components and assessment of uncertainty in measurement of electrical current and voltage, and, in the fifth chapter introduces the assessment of uncertainty in measurement of electrical power. Finally in the sixth chapter an analysis of conclusion is introduced, highlighting the applicability of method used.
2. Basic Greatness and Influences
In the PV panels, the electricity transduction occurs through the photon effect and greatest power converted, expressed in watts . It is known that electric power can be expressed in various ways, but most commonly is treated [5] .
 (1)
(1)
where the voltage  is expressed in volts
 , current
  in ampere
  and the angle
  is the electric discrepancy between voltage and current. When it is to resistive impedance, the reactances are despicable and the angle
  is approximately zero and Equation (1) results in [5] .
 (2)
(2)
In this way, the voltage and electric current are the values of influence on measurement and metrological evaluation of power [5] [6] . It is essential to determine the correlation between the three variables ,
,
because the measurements of voltage and electrical current, were performed directly with DMM. The power was not obtained from direct measurements, was obtained, indirectly, by use of Equation (2), full details of the locations and conditions of the tests performed in sunflower prototype are introduced in the paper [3] [4] .
3. Boundary Conditions during the Period of Measurements Carried out
The measurements carried out on the Sunflower prototype, voltage and electrical current, were performed in the tracking  and static
  mode, will be adopted the following notation conventions, as follows: voltage tracking mode
 , voltage static mode
 , electric current tracking mode
 , electric current static mode
 . Figure 1 and Figure 2, demonstrate the Sunflower prototype and PV panels, in the field test [3] [4] .
The measurements of voltage and electric current were performed from 06:00 am to 06:00 pm at intervals of 10 and 10 minutes, during 5 days. Figure 3 introduce to the graph of voltage measurement, for both, tracking and static mode, during 12 hours in 5 days [3] [4] .
Figure 4, introduce to the graph of electric current measurement, for both, tracking and static mode, from 06:00 am to 06:00 pm at intervals of 10 and 10 minutes, during 12 hours in 5 days [3] [4] .
The measurements of voltage and electric current were practically constant, with low oscillation, over the period from 7:10 am to 04:00 pm, other data (outliers) were discarded at the discretion of standardization, expressed by Equation (3) [7] - [9] .
 (3)
(3)
where  is the average value of the measurements and
  is the standard deviation of measurements. In this way, the values considered “outliers” resulted in the
 , it may be presented as zero or negative [7] - [9] .
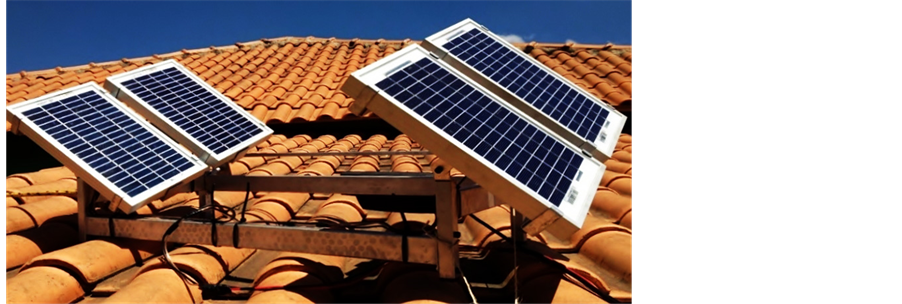
Figure 1. Sunflower prototype [3] [4] .

Figure 2. PV panels [3] [4] .
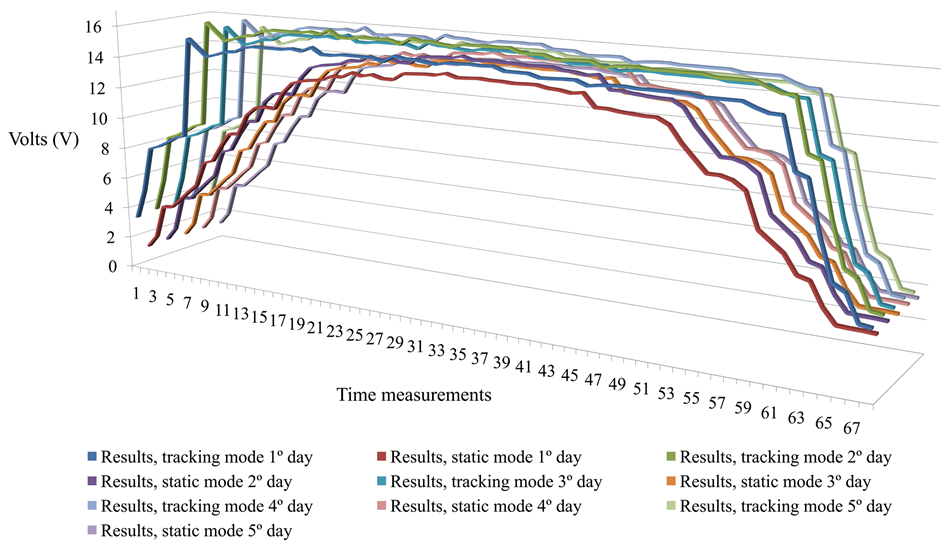
Figure 3. Measurements of voltage in the tracking mode  and static mode
  [3] [4] .
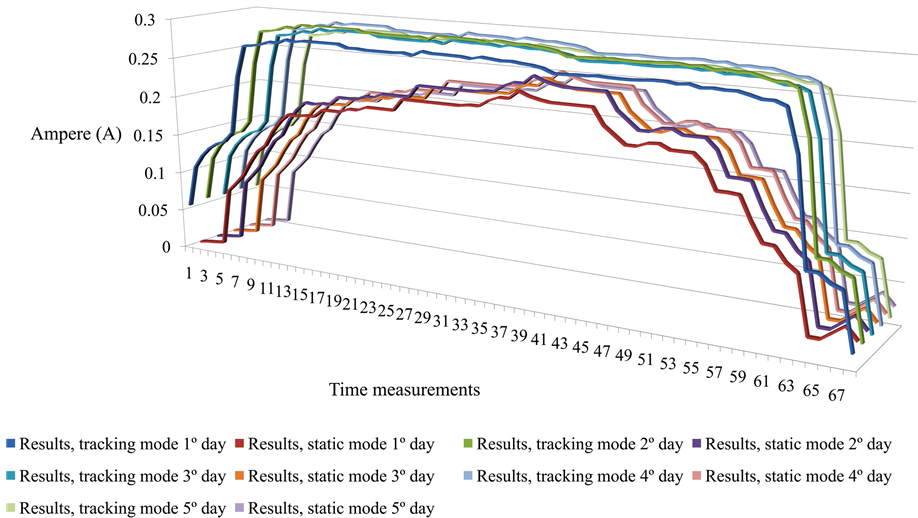
Figure 4. Measurements of electric current in the tracking mode  and static mode
  [3] [4] .
4. Components and Assessment of Uncertainty in the Electrical Current and Voltage
The expression of measurement uncertainty of a quantity takes into account, several components of uncertainty, which are classified, such as, “A” and “B”. Basically, the difference is in the evaluation of statistical reasoning of components of uncertainty [1] [2] . As mentioned, both the voltage and electric current was measured directly through DMMs, soon, the values can be expressed by Equations (4a) and (4b) [9] [10] .
 (4a)
(4a)
 (4b)
(4b)
In order to facilitate theoretical exposure, considers the generic notation, express by Equation (5) [7] - [9] .
 (5)
(5)
where ,
, . The value
 , expresses the arithmetic average of greatness
  or
or , which can be express by Equation (6) [7] - [9] .
 (6)
(6)
where  is the set of n measured values using a DMM. The portion
  from Equation (5), represents the expanded uncertainty and can be express by Equation (7) [7] - [9] .
 (7)
(7)
where  refers to the coverage factor obtained from [10] , to a level of confidence of 95.45% and
  refers to the combined uncertainty, calculated by quadratic combination of all measurement uncertainty components. Equation (8) illustrates the portions of component
  [7] - [9] .
 (8)
(8)
The factor  refers to the sensitivity coefficients of each portion of the combined uncertainty with respect to the measured. When this value is unknown, considers the worst case, which is unitary. The
  represents the “
 ” portions of uncertainty components, which are express by Equation (9) [7] - [9] .
 (9)
(9)
where:
Ø  , component type “A”, related to measurements carried out;
Ø  , component type “B”, related to the percentage of the output as read on the DMM and the offset from the DMM, in accordance with the manufacturer’s specifications;
Ø  , component type “B”, related to the resolution of the DMM;
Ø  , component type “B”, related the manufacturer specification of the PV cell;
Ø  , component type “B”, related to the resolution of the PV cell.
The component  is express by Equation (10).
 (10)
(10)
The components  and
and  are obtained by specifications contained, respectively, in the manuals of the DMM and manufacturers of PV cells, whose distributions are rectangular [11] . The components
  and
and 
are obtained, respectively, of the resolutions of the DMM and PV cells, whose distributions also are rectangular. Table 1, contains the values of each component, both for voltage and electrical current and both the operating modes, tracking and static [12] [13] .
Degrees of Freedom and Coverage Factor
Once calculated the components of uncertainty and the combined uncertainty of each of the variables, both for tracking and static mode, the next step is to calculate the effective degrees of liberty , by Equation (11) [12] .
 (11)
(11)
In this present value, analysis  will depend, primarily, of the component
  in all 4 scenarios analysed (VTracking, Itracking, Vstatic, Istatic). Therefore, Table 2, presented the values obtained for
 ,
,  ,
,  ,
,  ,
,  and, finally, the expression of measurement uncertainty
  for the situations mentioned.
5. Assessment of the Measurement Uncertainty of Electric Power
The algebraic expression that relates voltage and current is express by Equation (2) and the electric power values were determined by calculations involving the quantities  and
and . In this scenario, for the determination of electric power values related to values of correlated quantities, it is necessary the use of covariance resource for determining the uncertainty of measurement of electrical power. The following Equation (12) expresses the cal- culation for correlated quantities [7] [13] .
 (12)
(12)
Measurement uncertainties are estimated for both Ptracking (correlates Vtracking and Itracking) and Pstatic (correlates Vstatic and Istatic). It is considered the experimental average and the experimental standard deviation to express the uncertainties of electrical power from the PV panel. Table 3 presented the average values ob- tained for power electrical , the correlation coefficients
 , the combined uncertainties
 , the factors included
  and their uncertainties
 .
.

Table 1. Record of voltage and electrical current measurements.
Table 2. Expression of measurement uncertainty of voltage and current.
Table 3. Expression of measurement uncertainty of electric power.
6. Conclusions
The metrological analysis of the Sunflower Prototype, method presented in this paper concerns the specific data of the measurements carried out during the performance tests. The methodology, presented in the paper, for testing and describing the metrological properties of the measurements collected though the measurements equipment’s, and introducing methods to minimize uncertainties of measurement equipment in the PV systems. The determination of the distribution for an output quantity, using the propagation of distributions, through a DDM, proved to be appropriate. The concepts of probability theory provide a unique, self-consistent method for quantitative reasoning given incomplete information. In the case of measurement data evaluation, they permit the rigorous treatment of non-linear measurement models that, for particular reasons, cannot validly be linearized.
It is possible to decrease the measurement uncertainty through the following factors:
・ Decrease the time interval considered as representative measurements carried out, taking into account only the 4 hours of greater solar intensity, which would imply in the range of measured from 30 to 35 values. This reduced of the sample space would allow them to be used the methods of Dixon, Cochran and Grubbs to determining the outliers;
・ Using DMMs with 5½ or 6½ digit, to decrease the component type A of measurement uncertainty and even the component type B, concerning the resolution of the instrument.
The powers (Ptracking and Pstatic) were not measures, were obtained through calculations performed with the measures of V and I, which makes the measurement uncertainty of power be calculated through correlation of variables. It is possible to decrease the uncertainty of measurement of power, replacing the indirect for direct methodology, i.e. made using energy meters or wattímetros.
Acknowledgements
The authors would like to thank The Coordenação de Aperfeiçoamento de Pessoal de Nível Superior (CAPES), The Department of Communications (DECOM), The Faculty of Electrical Engineering and Computing (FEEC) and The State University of Campinas (Unicamp), for their support in the development this research.
References
- Taymanov, R. and Sapozhnikova, K. (2010) Metrological Self-Check and Evolution of Metrology. Measurement, 43, 869-877. http://dx.doi.org/10.1016/j.measurement.2010.04.004
- Pavese, F. (2009) About the Treatment of Systematic Effects in Metrology. Measurement, 42, 1459-1462. http://dx.doi.org/10.1016/j.measurement.2009.07.017
- Loschi, H., Ferrarezi, R. and Rocha, N. (2014) Solar Tracking System Installed with Photovoltaic (PV) Panels to Connection Grid Tie Low Voltage (Sunflower). Energy and Power, 4, 49-53.
- Loschi, H. (2013) Sistema de Rastreamento Solar Instalado em Módulo com Painéis Fotovoltaicos para Conexão “Grid Tie” de Baixa Tensão. Universidade Paulista―UNIP, São Paulo.
- Naeem, W. (2012) Concepts in Electric Circuits. Belfast, Northern Ireland, 1-87.
- Kessel, W. (2002) Measurement Uncertainty According to ISO/BIPM-GUM. Thermochimica Acta, 382, 1-16. http://dx.doi.org/10.1016/S0040-6031(01)00729-8
- Joint Committee for Guides in Metrology (JCGM) (2008) Evaluation of Measurement Data: Guide to the Expression of Uncertainty in Measurement. Geneva.
- Bich, W., Cox, M.G. and Harris, P.M. (2006) ISO Guide to the Expression of Uncertainty in Measurement. Metrologia, 43, S161-S166. http://dx.doi.org/10.1088/0026-1394/43/4/S01
- Theodorou, D., Meligotsidou, L., Karavoltsos, S., Burnetas, A., Dassenakis, M. and Scoullos, M. (2011) Comparison of ISO-GUM and Monte Carlo Methods for the Evaluation of Measurement Uncertainty: Application to Direct Cadmium Measurement in Water by GFAAS. Talanta, 83, 1568-1574. http://dx.doi.org/10.1016/j.talanta.2010.11.059
- Beltrán, J., Muñuzuri, J., Rivas, M. and González, C. (2010) Metrological Management Evaluation Based on ISO10012: An Empirical Study in ISO-14001-Certified Spanish Companies. Energy, 35, 140-147. http://dx.doi.org/10.1016/j.energy.2009.09.004
- Prat, M. and Desanlis, T. (1998) Metrological Analysis of a High Current Measurement System. 1998 Conference on Precision Electromagnetic Measurements Digest, Washington DC, 6-10 July 1998, 1-2.
- Lombard, B. (2006) Estimation of Measurement Uncertainty in Food Microbiology: The ISO Approach. Accreditation and Quality Assurance, 11, 94-100. http://dx.doi.org/10.1007/s00769-005-0085-5
- Borkowski, J. and Mroczka, J. (2002) Metrological Analysis of the LIDFT Method. IEEE Transactions on Instrumentation and Measurement, 51, 67-71. http://dx.doi.org/10.1109/19.989903